Main scenario: consider long positions from corrections above the level of 1.2453 with a target of 1.2821 – 1.3000.
Alternative scenario: breakout and consolidation below the level of 1.2453 will allow the pair to continue declining to the levels of 1.2294 – 1.2033.
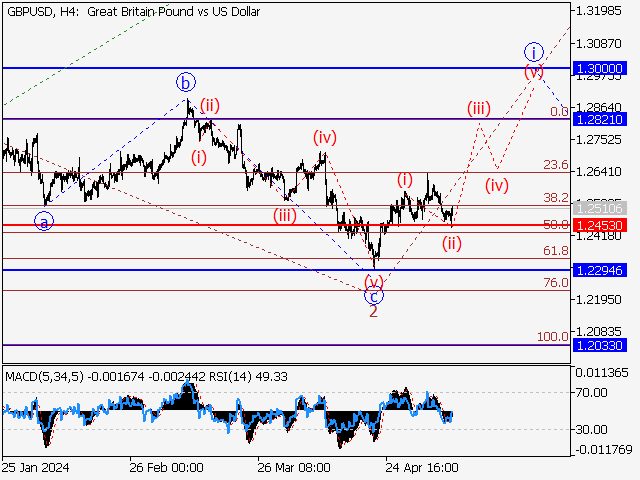
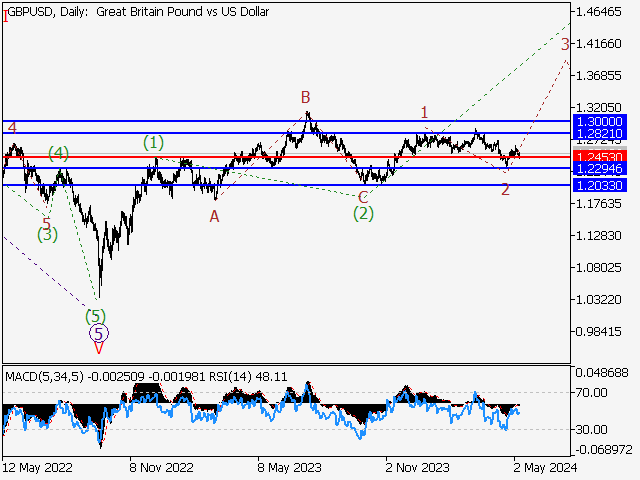
Analysis: the first wave of larger degree (1) is presumably formed, a correction developed as second wave (2), and the ascending third wave (3) started unfolding on the daily chart. On the H4 chart, wave 1 of (3) is formed, a descending correction is completed as second wave 2 of (3), and wave 3 of (3) started developing. Apparently, the first wave of smaller degree i of 3 is forming on the H1 time frame, with a local corrective wave (ii) of i of 3 completed and wave (iii) of i of 3 developing as its components. If the presumption is correct, the GBPUSD will continue to rise to the levels of 1.2821 – 1.3000. The level of 1.2453 is critical in this scenario as its breakout will enable the pair to continue declining to the levels of 1.2294 – 1.2033.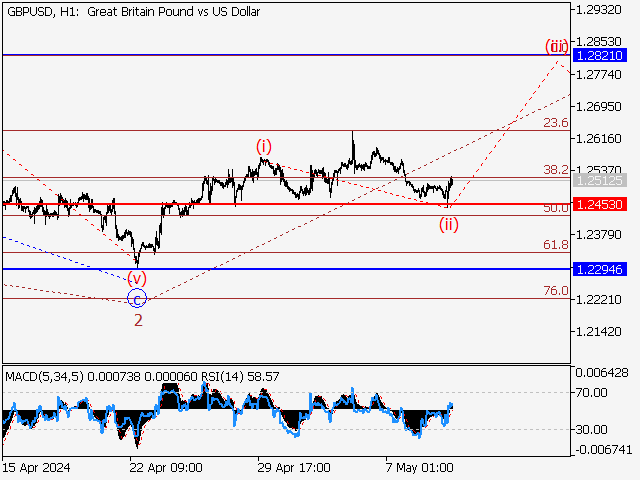
Price chart of GBPUSD in real time mode

The content of this article reflects the author’s opinion and does not necessarily reflect the official position of LiteFinance. The material published on this page is provided for informational purposes only and should not be considered as the provision of investment advice for the purposes of Directive 2004/39/EC.