- Search Forex Factory
- 22 Results
-
 PriceProphet replied Feb 15, 2017
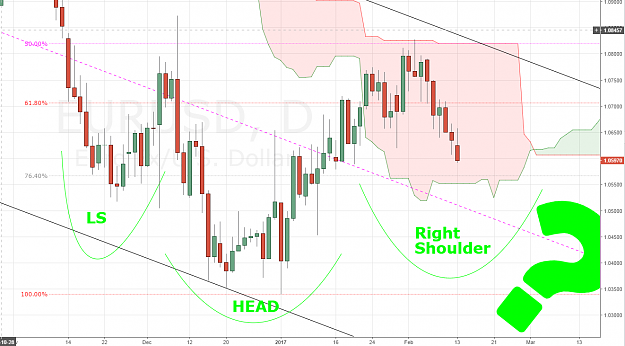
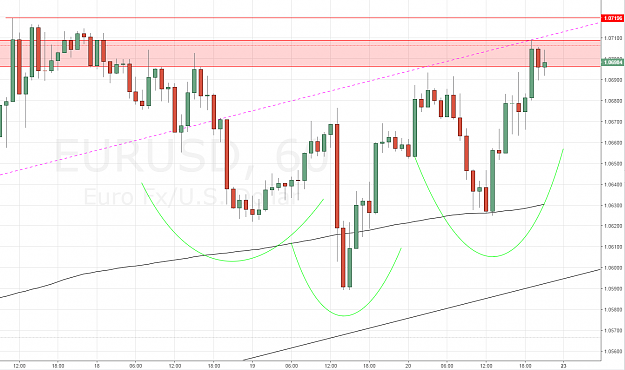
This potential Inverse head and shoulders could be a winner
EURUSD
- PriceProphet replied Feb 15, 2017
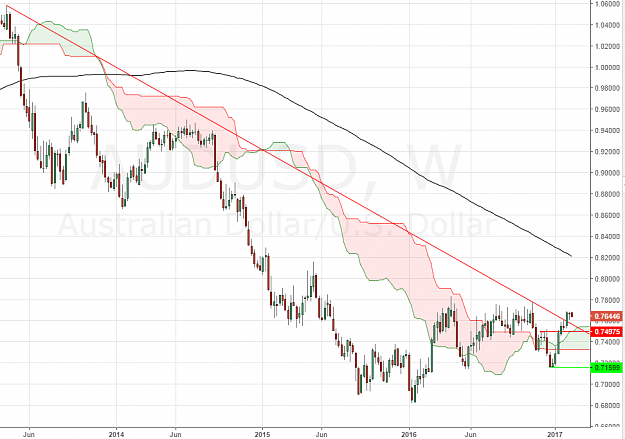
hate to say I told you so, but AUD looks very strong after the downtrend breakout image
AUD/USD
- PriceProphet replied Feb 13, 2017
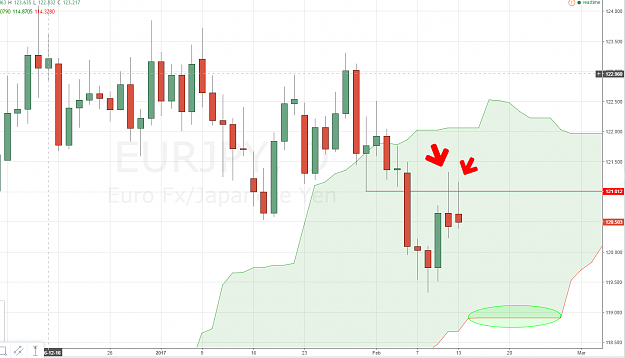
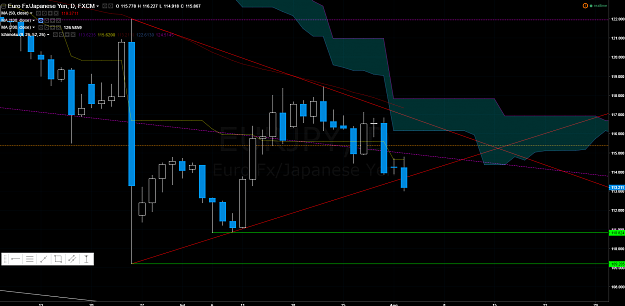
Look at these exhaustion candles on the daily, must be lower prices for sure. Sellers lined up into 121.00 Fill you boots, this one is going lower. image
EUR/JPY
- PriceProphet replied Feb 13, 2017
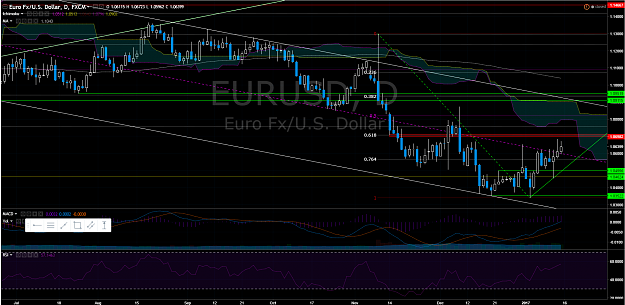
Anyone else think that EURUSD could turn into a inverse head and shoulders on the daily chart??? image
EURUSD

- PriceProphet replied Feb 13, 2017
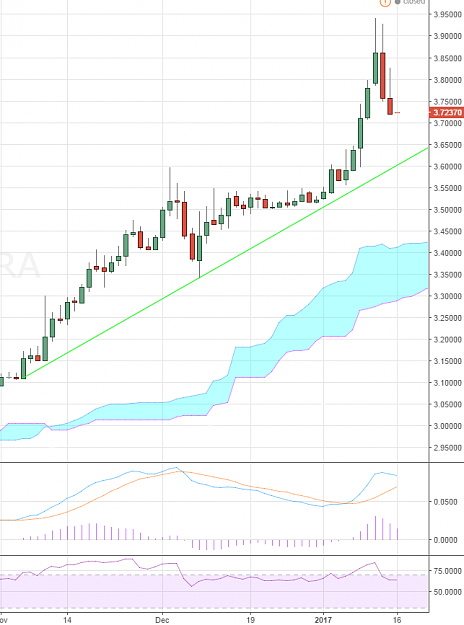
Look at this! On the weekly AUDUSD has broken the down tend line: image Buy 0.7600
AUD/USD

- PriceProphet replied Feb 13, 2017
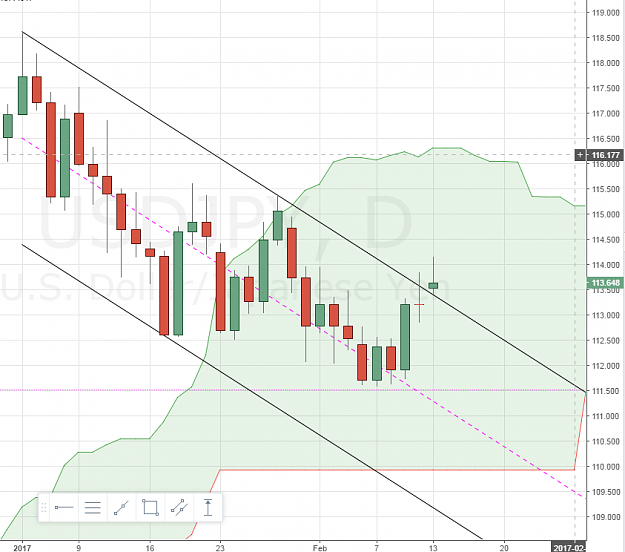
Broken out of down channel. But 114 providing resistance. might be best to play it cautious with this breakout as it may be a trap. image
USD/JPY Discussion
- PriceProphet replied Feb 12, 2017
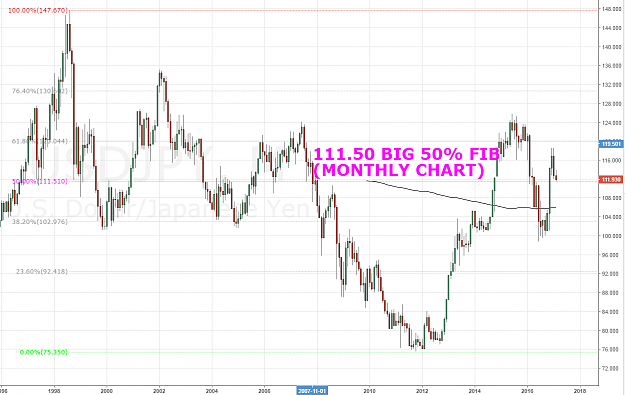
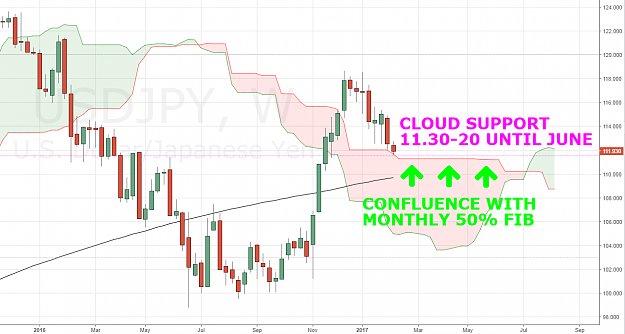
111.50-30 is a big level. If that goes we could see 110-109 Big monthly 50% fib of the moved from 1998-2011: image Confluence of cloud support on the weekly chart. 111.50-30: image If we break and close below this area, I will be getting short ...
USD/JPY Discussion
- PriceProphet replied Jan 22, 2017
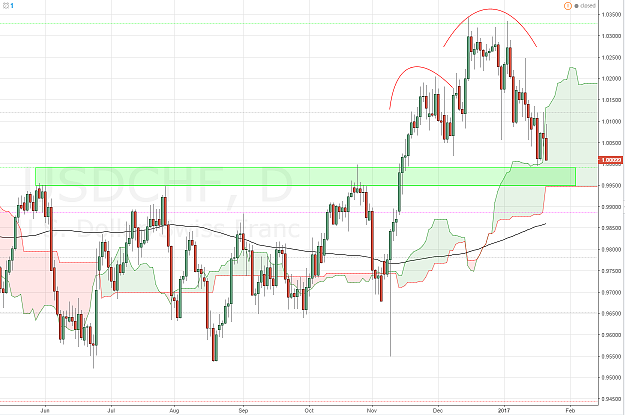
EURUSD is chewing through resistance with an inverse head and shoulders! USDCHF is also in play hitting an area of support, could see some SNB action, check my full inter-market analysis. image
EURUSD
- PriceProphet replied Jan 22, 2017
Looks to be hitting an area of support just at the same time as EURUSD is hitting resistance. There will be some intermarket play, check my full analysis. image image
USD/CHF

- PriceProphet replied Jan 15, 2017
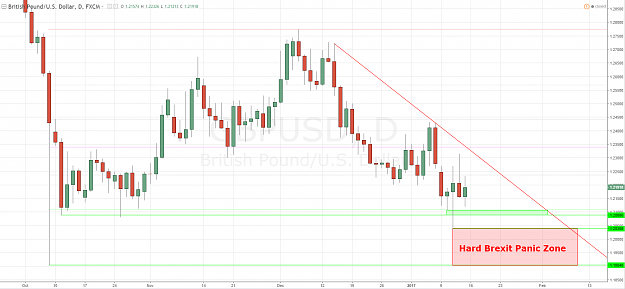
The Sunday open should be fun, might also see a bounce following the actual speech. Here's my chart and what I'm calling the This "Hard Brexit Panic Zone" between 1.2040 - 1.1900. image Read my analysis on what to watch out for.
Cable Update (GBPUSD)
- PriceProphet replied Jan 14, 2017
This is stuck in a range between 1.0350 - 1.0700 If we clear 1.07 we see 1.09 But 1.07 is previous support, now resistance. Its also a 0.61 fib.
EURUSD
- PriceProphet replied Jan 14, 2017
Looks like this may have topped for now. Central bank action and promises from the government to "root out speculators" Also El-Erian Says Buy Emerging-Market Currencies That Fell Too Much So that might also include the MXN
USD/TRY
- PriceProphet replied Aug 3, 2016
Confluence of previous resistance and Fib support. short term trade long from between 112.60-70. Stop 112.55, Targeting 113.00 image
EUR/JPY
- PriceProphet replied Aug 2, 2016
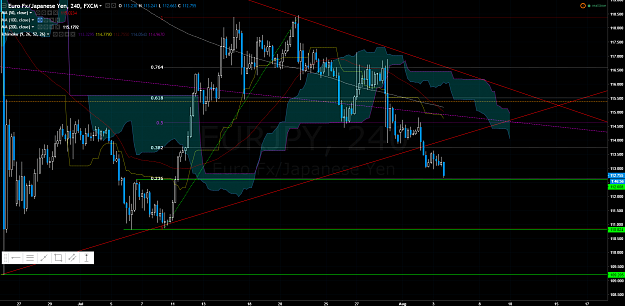
Today's break and close below the recent up trend line suggests a retest of the brexit lows in the next couple of weeks. image Risk to deteriorate after a dead cats bounce..
EUR/JPY
- PriceProphet replied Aug 2, 2016
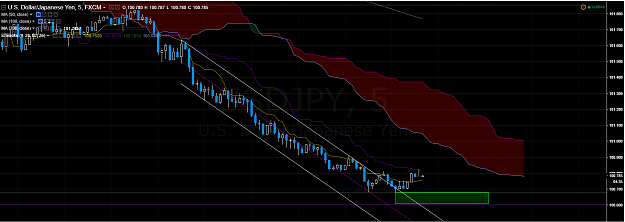
5 min chart: There's a confluence of fibs between 100.60-70: image
USD/JPY Discussion
- PriceProphet replied Aug 1, 2016
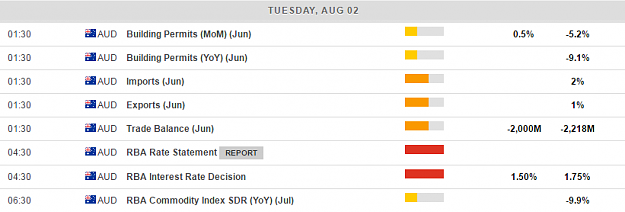
Keep an eye out for the other data points tonight.building permits and trade balance could both easily move AUD 50+ pips. image
AUD/USD
- PriceProphet replied Aug 1, 2016
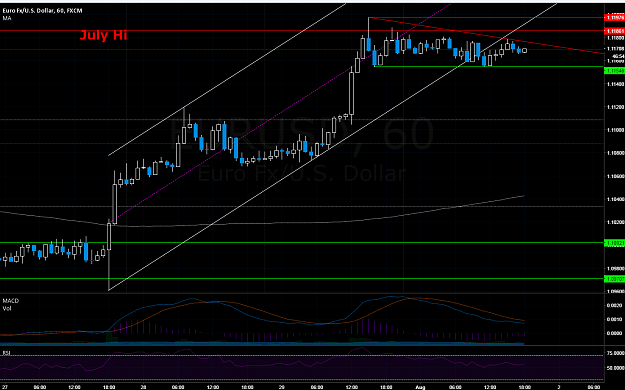
EURUSD stuck in a bull flag from 1.1154-97 Waiting for a break either side to give a bit of bias image Also that should be "June hi" in red.
EURUSD
- PriceProphet replied Jul 30, 2016
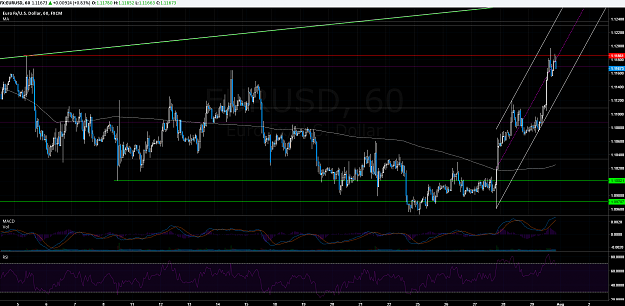
US Q2 GDP came in soft so the Fed will be wanting to support the economy, should lead to a weaker $ as rate hike expectations get moved further into the future. Morgan Stanley are also warning that the worst for the USD is yet to come. Will be ...
EURUSD
- PriceProphet replied Jan 6, 2016
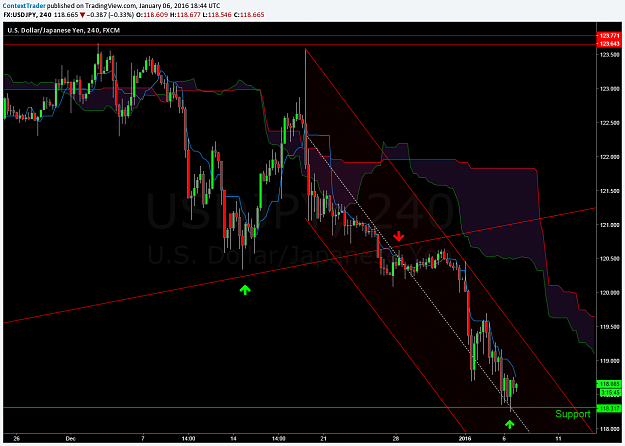
Nice long at 118.30, but i cant condone trading without a stop. You know that's unlimited risk right? That was some sweet confluence of support around that 118.30 level. Middle of the downward channel and 26/03 low coming together. If you got long ...
USD/JPY Discussion
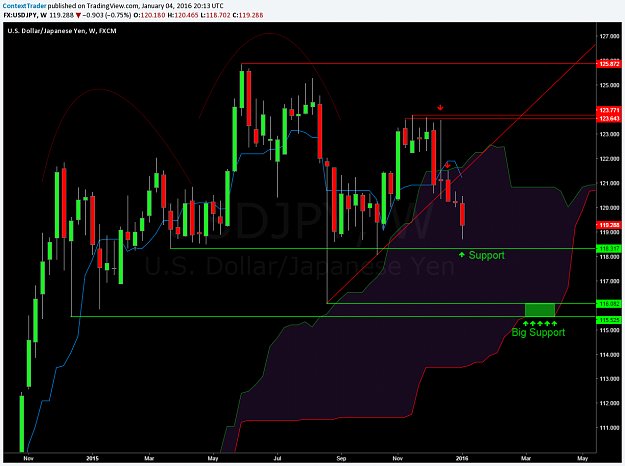
- PriceProphet replied Jan 4, 2016
@Zinot There could deffo be a retracement, but will be picking my spots Here's the chart that was supposed to go in the previous post.
USD/JPY Discussion