- Search Forex Factory
- 49 Results
-
 guilherme replied Mar 18, 2020
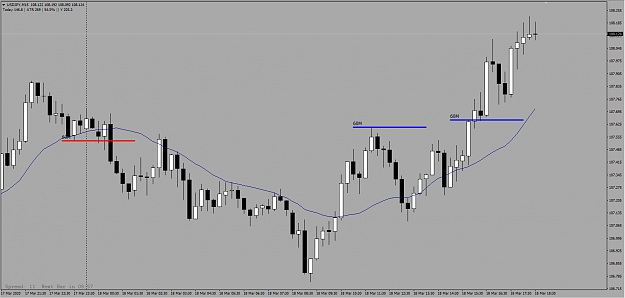
yeah. it was risky at that level. but it gave a nice set up later. target hit. I´m out. image
3 Bar Fractal Break
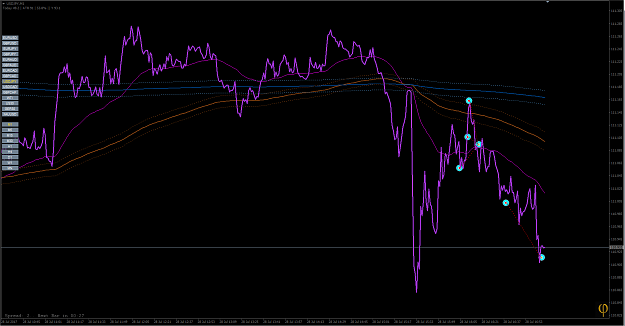
- guilherme replied Nov 13, 2017
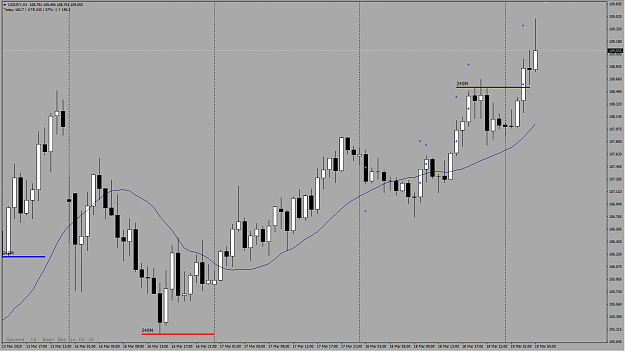
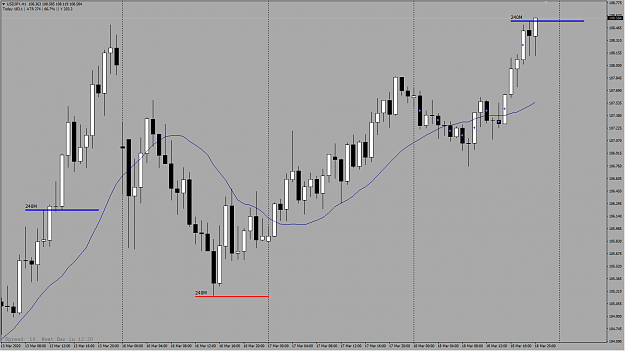
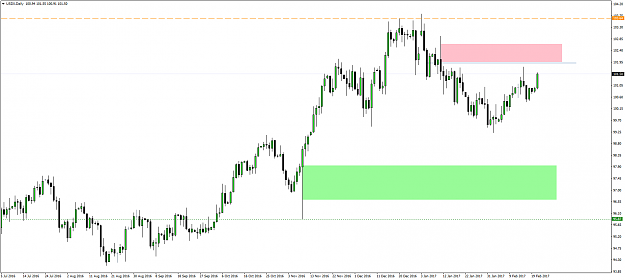
I think it would be something like this...... I have taken levels from the last day because we cant zoom out more. But as he says in the video you should look back 2 or 3 days searching for the levels. And those levels will change from time to time. ...
New free indicator for losers in forex
- guilherme replied Nov 13, 2017
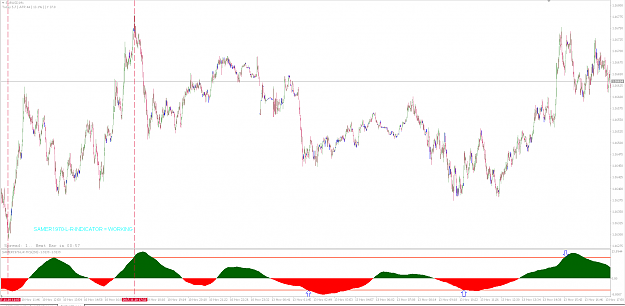
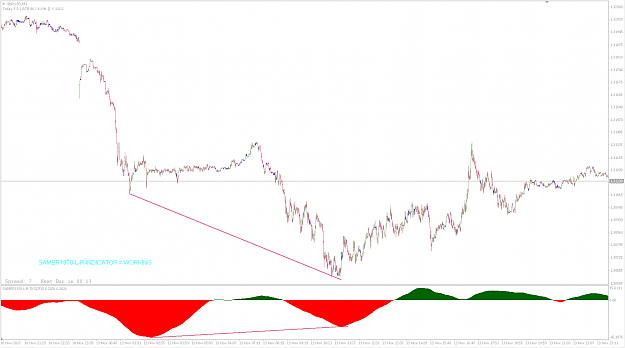
Hope you´re feeling better Samer. Nice indicator and nice drawings. Can this indicator be used to trade divergences as well ?
New free indicator for losers in forex
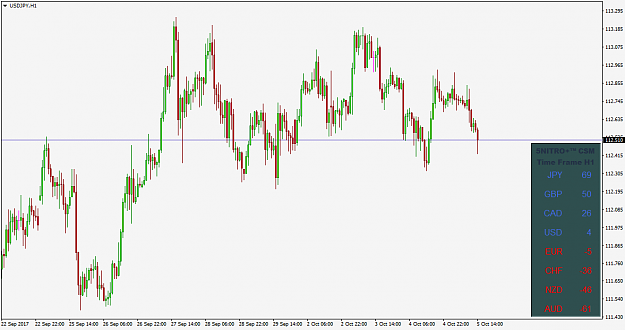
- guilherme replied Jul 28, 2017
You´re welcome. Here is my first screen shot. Still in the learning by seeing what/how you do.
(binned per thread starter’s request) My Kingdom of Trading
- guilherme replied Jul 27, 2017
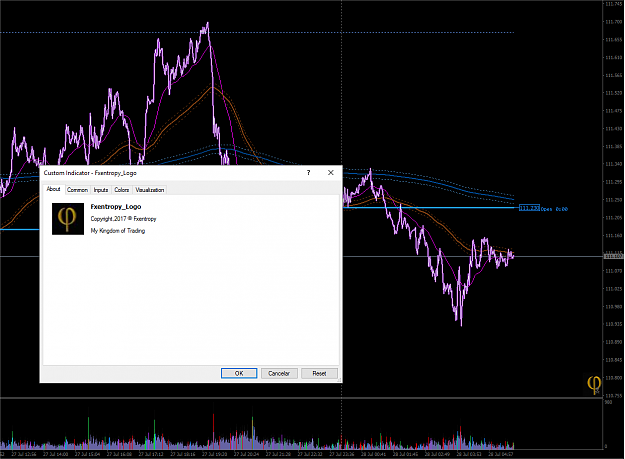
Once again, nice journal. Thanks for sharing you tpl. I would like to share a gift for you to keep posting your charts with your signature. Hope you like it. Just copy the image to your MQL4/Images folder (if you dont have this folder just create ...
(binned per thread starter’s request) My Kingdom of Trading

- guilherme replied Aug 11, 2016
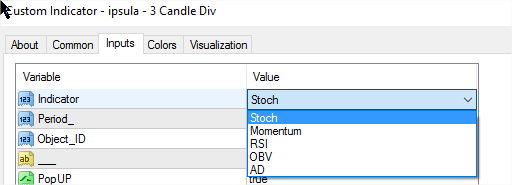
ok here it goes. I did not have the chance to test and check if the strategies are ok. Please let me know if anything goes wrong. Attached are 2 indicators. One for each strategy ipsula showed us. On both you can chose wich indicator you want to use ...
Armageddon reloaded v.2
- guilherme replied Jul 28, 2016
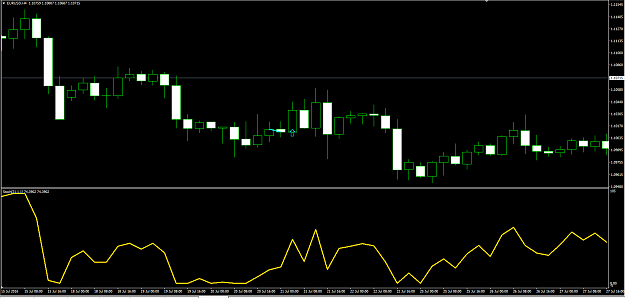
Here is an indicator I just made. Build 988. Didnt have time to test the alerts. So if you find any bug please let me know. It´s an indicator for the first setup ipsula shared. Also sharing an indicator of SMI Divergence wich I think is the same ...
Armageddon
- guilherme replied Jul 12, 2016
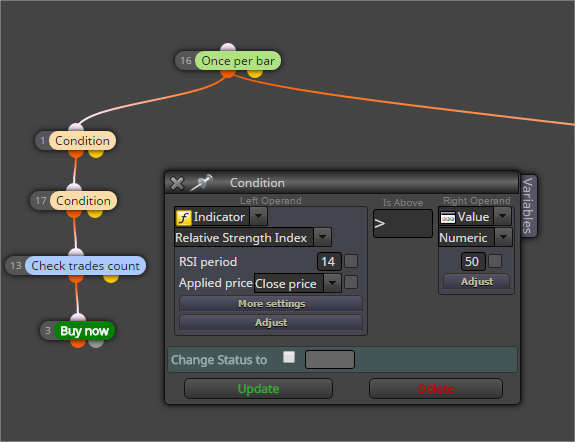
just add one condition after the other. you dont need the AND block.
Fxdreema Community
- guilherme replied Jun 15, 2016
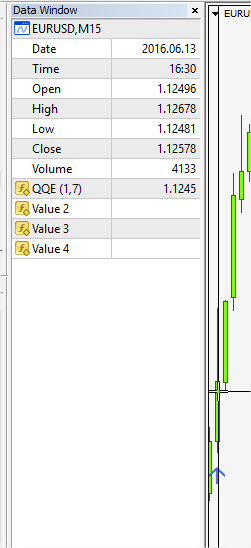
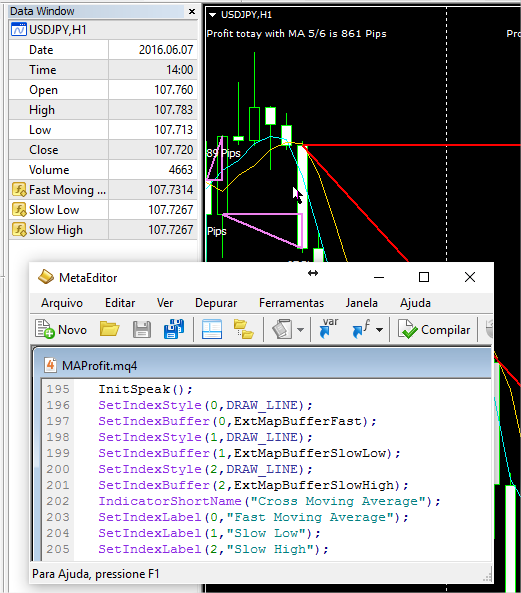
yes. just as an example in the picture. You open your Data Window, place your cursor above the candle with the arrow and check wich buffer changes value. In my case it was buffer 1 for the sell arrow and buffer 0 for the buy arrow
Fxdreema Community

- guilherme replied Jun 14, 2016
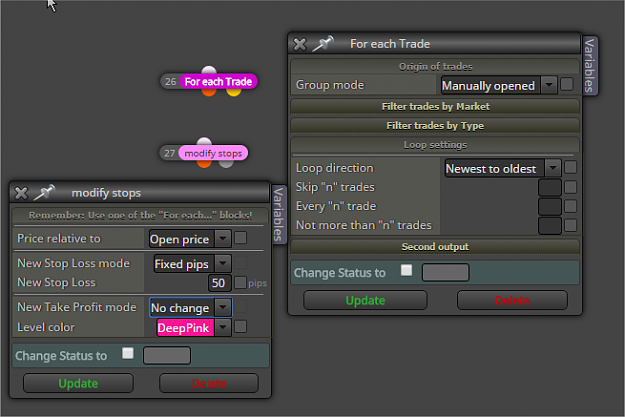
I agree with Daniel. Better use BE or trail. Unless you are using an indicator or some pivot point to move the Stop. First thing you have to check is : all the blocks that have Group Mode, you must remember to change it to "Manually Opened" (even ...
Fxdreema Community
- guilherme replied Jun 11, 2016
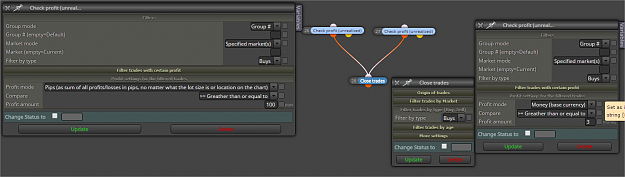
mojepole, I will try to answer that one. Hope Daniel dont mind. LoL to close the buys : use the "Check Profit(unrealized) block twice. Both filtering buys. One for Money mode and other for Pips mode. and conect those 2 to "Close Trades" block ...
Fxdreema Community
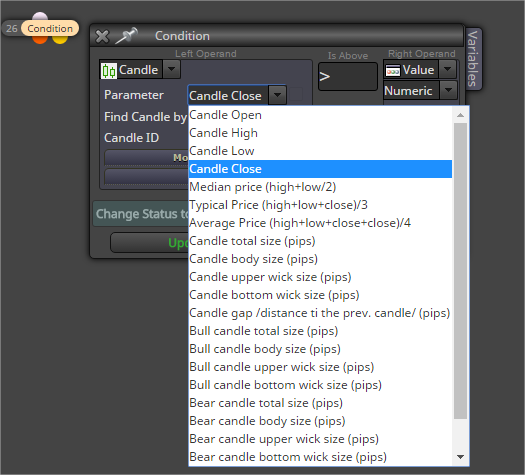
- guilherme replied Jun 10, 2016
I didnt get the ideia very well. But in the block Condition you have the Candle option. There are several kinds of candle condition you can use there. Have a look.
Fxdreema Community
- guilherme replied Jun 10, 2016
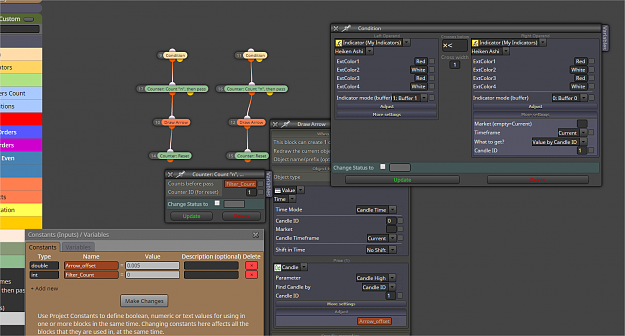
ok. to see the buffer you can always check the Data Window or the code it self. In this case you will see you have just 3 buffers used by the moving averages. So some condition inside the indicator creates the triangle (object). We have now 2 ...
Fxdreema Community
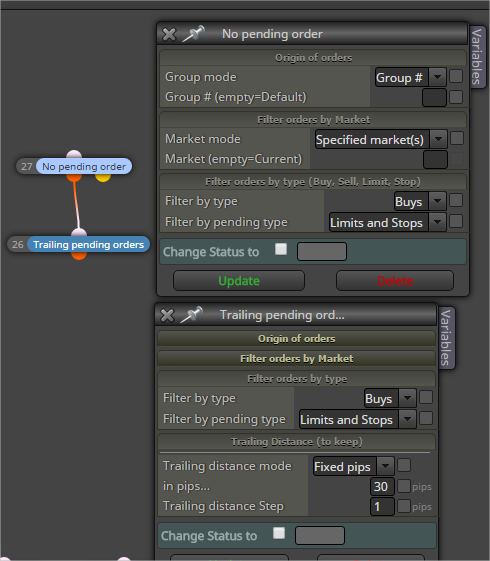
- guilherme replied Jun 8, 2016
ok. So you want the pending to keep going with the market from a certain distance. And when it moves fast to take your trade. You could use something like this example in the picture. And the same for sell. This way you will always have pending ...
Fxdreema Community
- guilherme replied Jun 7, 2016
The things you want to do are not easy. Sorry but I really dont have a clue on how to do it. How you would measure the distance from the last arrow and etc. But for the way it is I think the attached may help.
Fxdreema Community