King Dollar
A few notes on risky assets and the USD:
- Dollar positioning and momentum are the highest they’ve been since we started collecting data for the Positioning Report in October 2022. See Positioning Report at the end of today’s note.
- April 15 Tax Day has now passed. The unconditional tax-related selling should abate now.
- The PBoC looks like they have blinked a little bit as the CNY fix came in higher last night, finally. It’s rare for spot USDCNY to just sit there exactly 2% above the fix for so long. That’s the max that the PBoC will allow, and we have been there for ages. In the past, this either meant they slam it or they deval.
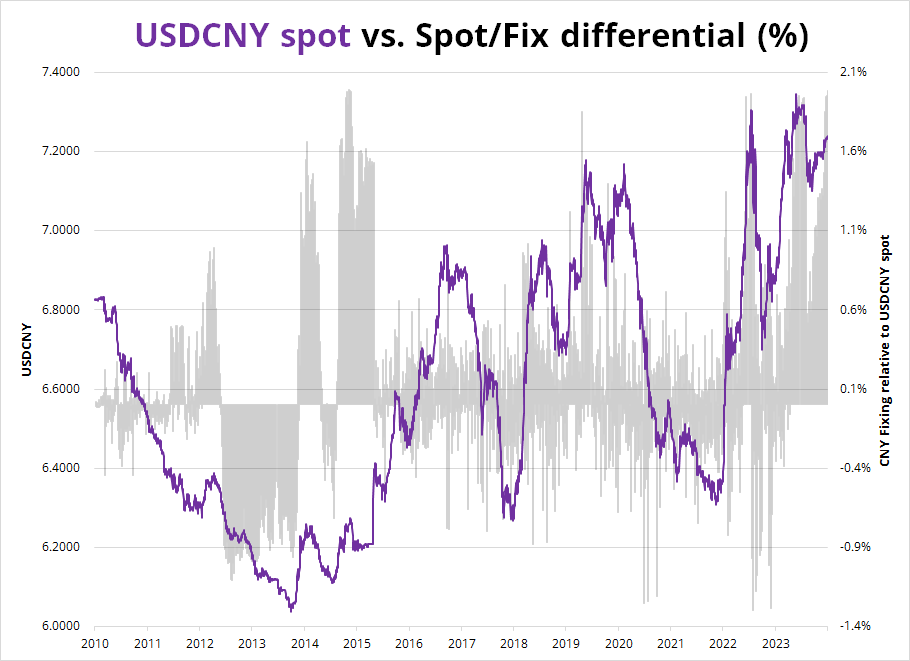
Deval talk has picked up recently due to suspicions around the massive bid in commodities (China buying before the deval?) and the persistent stickiness of spot at the 2% extreme. If you look at 2015, they devalued after the 2% gap persisted for a while, and in 2022 and 2023 they smashed USDCNY / USDCNH with some help from the MOF and from broad USD weakness. Interesting.
I’m not quite ready to go short USD against anything, but I’m temped and looking for a reason. Long AUD, NZD, CAD, or JPY would make sense as options for short USD as much is priced for yield divergence and positioning and momentum are extreme. But positioning isn’t enough reason to do a trade on its own.
Safe Haven Deep Dive
For whatever reason, it really bugs me when people describe bitcoin as a safe haven. Yes, it’s a hedge against loose monetary policy, but it usually trades more like a tech proxy than a safe haven. This got me thinking about safe havens in general and the lack of suitable assets fitting the bill these days. I decided to go through the major safe havens (and bitcoin) and see how they have performed over time. This might shed some light on a) what used to be a safe haven b) what was never a safe haven and c) what is still a safe haven.
I constructed my study as follows: Look at how various assets perform in weeks when the NASDAQ is up or down one standard deviation or more. I consider NASDAQ to be the ultimate risky asset and I don’t think I need to worry about anyone arguing with that. It’s high-beta equities—the definition of a risky asset.
The red line in the charts is the performance of the asset when NASDAQ is down. The green line is the performance of the asset when NASDAQ is up. A perfect safe haven, then, would have the red line going up (it rallies when NASDAQ sells off) and the green line going down. Let’s start with bonds, because they are easy to understand, and they were a great safe haven when we lived in a world of low inflation.
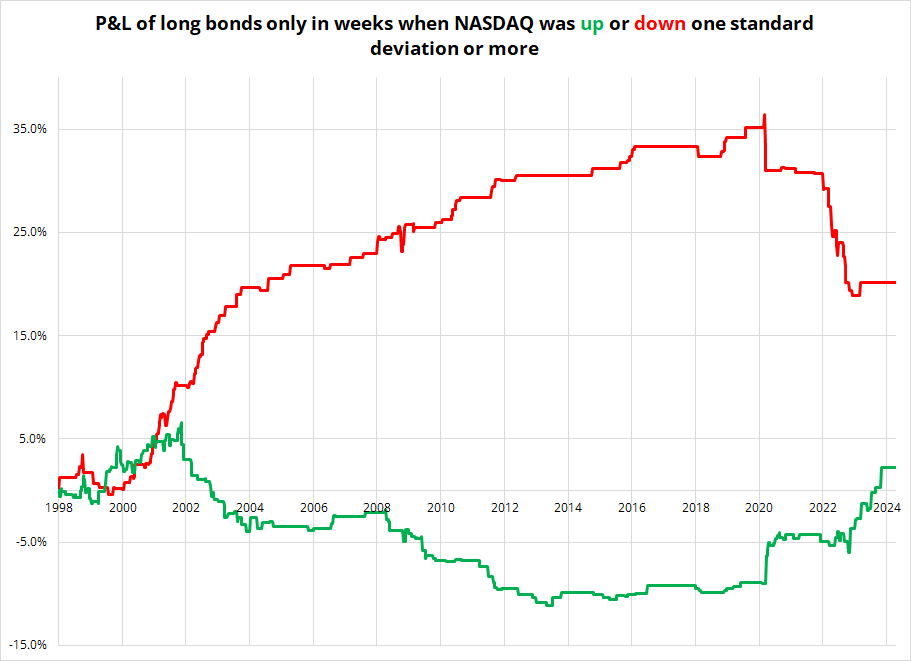
Chart shows total return of bonds for each week where NASDAQ up or down condition is met, summed over time
You can see that bonds were a great safe haven until COVID, but then the inflationary kaboom led to many instances of bonds down / NASDAQ down (just like we’ve seen over the past week or so after the strong CPI reading). Verdict: Bonds used to be a safe haven, but they don’t perform when inflation is high.
Next, let’s look at gold.
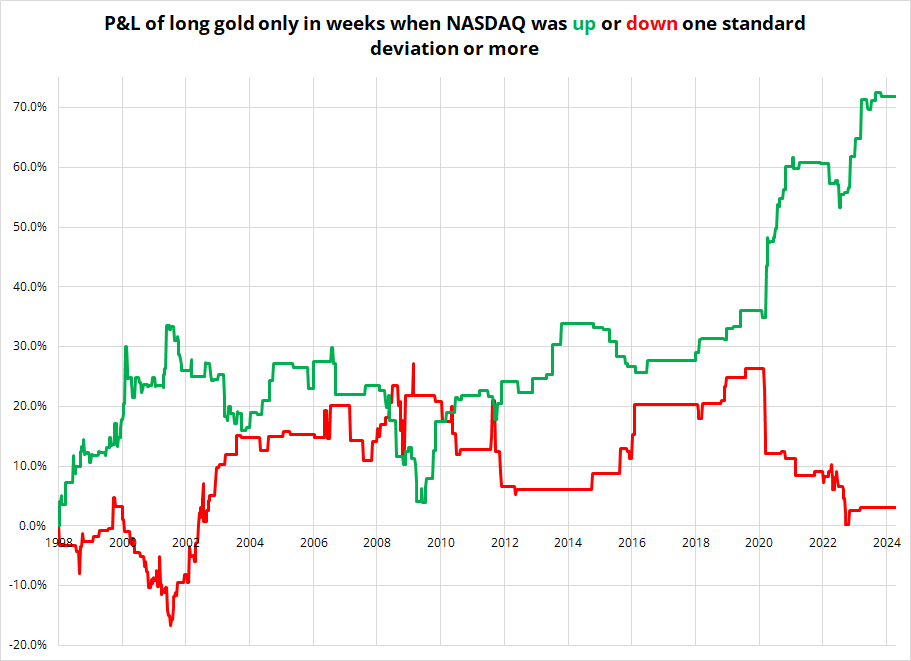
Is it a safe haven? Not really. When stocks go up, gold goes up and when stocks go down, gold does nothing. So, it’s not terrible! But it’s more a liquidity thermometer than a safe haven. Perhaps more importantly, its behavior is wildly inconsistent and therefore it’s not a reliable safe haven. At all. Verdict: Gold is part risky asset, part liquidity thermometer, part safe haven.
The JPY and CHF used to be great safe havens as they represented the funding side of cyclical currency trades, so specs sold them when things were good. They saw unwinds and repatriation when scary stuff happened, so specs bought them when times were less good. This gave them a safe haveny vibe, but much of that came from their correlation to yields. So, when the yields / NASDAQ correlation broke, the JPY and CHF stopped working as well. Significant government interventions in JPY and CHF have also muddied the waters. Here are the charts.
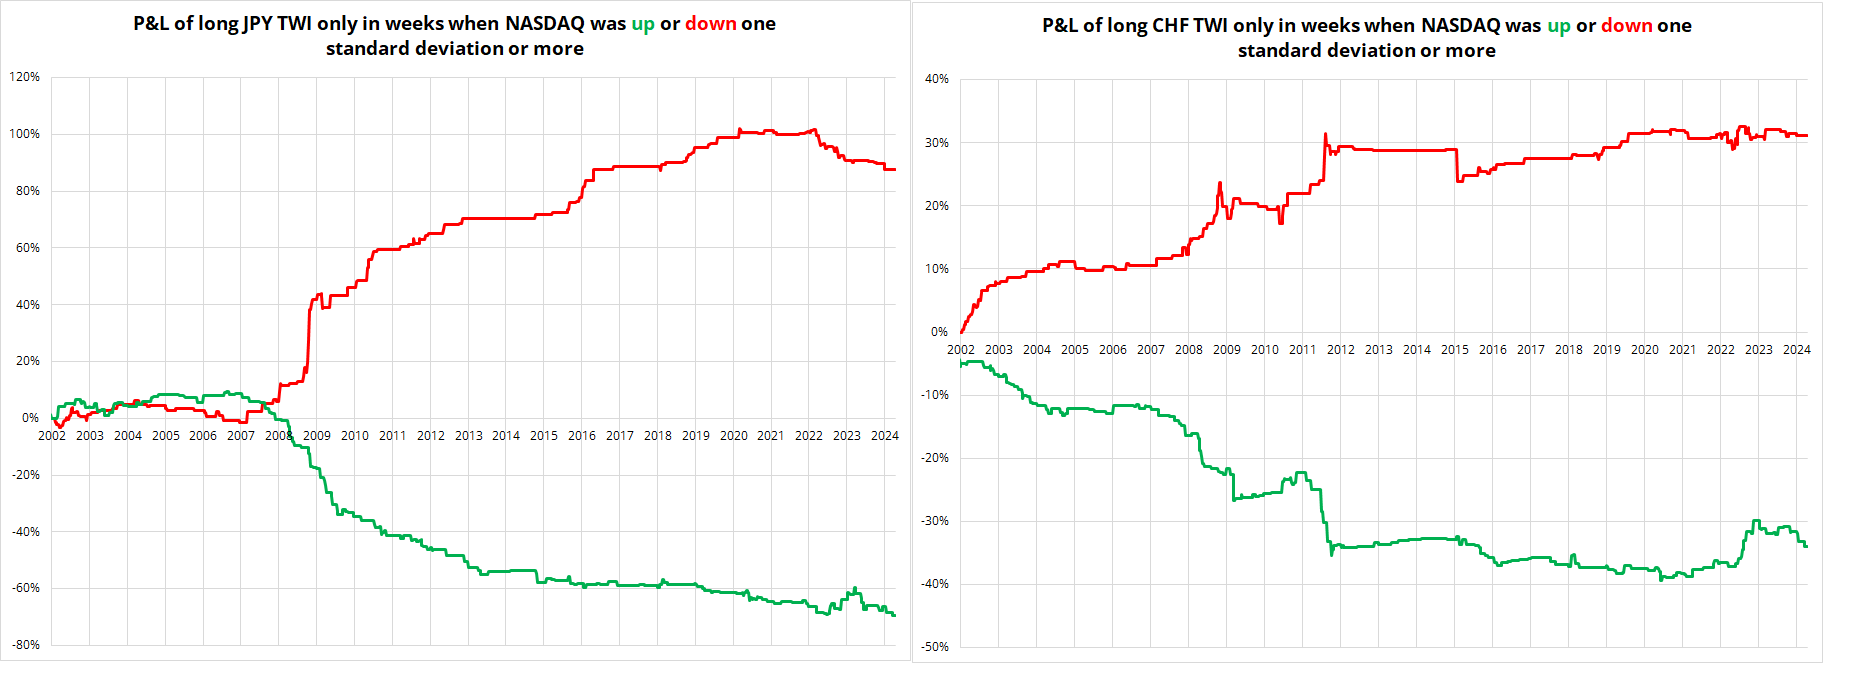
You can see the JPY was a great safe haven during and after the GFC but has not performed that role since 2020 (the red line is down since then, indicating NASDAQ down = weaker JPY). The CHF chart is a mess because they pegged it for ages and EUR is 70% of the Swiss TWI. Again, you can see that CHF was an OK safe haven from 2002 to 2011 then lost its haven characteristics. Verdict: CHF and JPY are not safe havens when bonds are positively correlated with stocks and/or their central banks are distorting the FX market.
Moving to things that people sometimes think are safe havens, but are actually risky assets… The first one to look at is silver. The results for this one are so remarkable I asked Justin to run it independently to make sure I didn’t screw up the xls. He confirmed the chart looks like this:
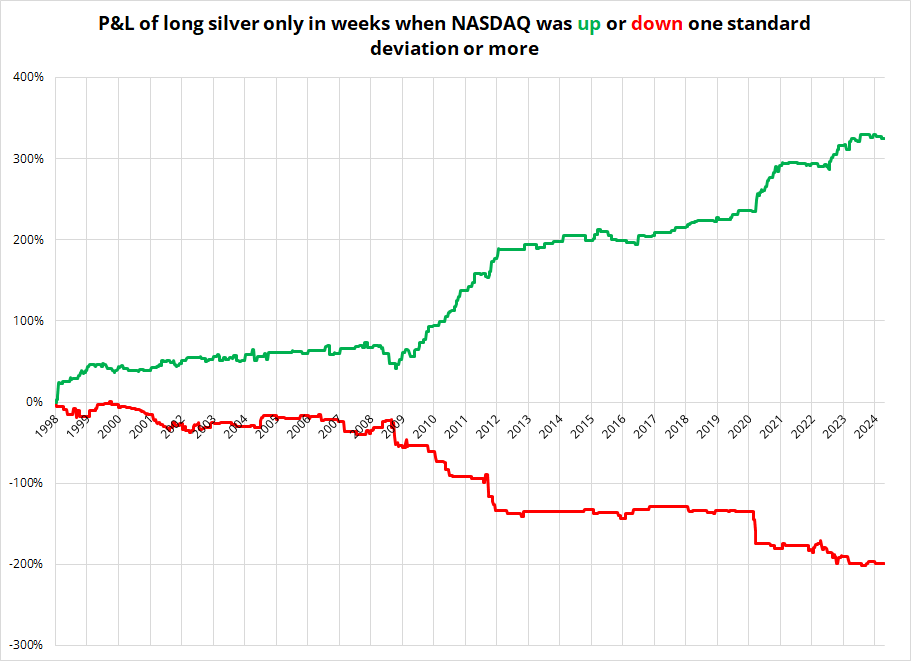
Verdict: Silver is a risky asset. As risky as they get. It’s a liquidity thermometer and debasement hedge. Same thing as NASDAQ.
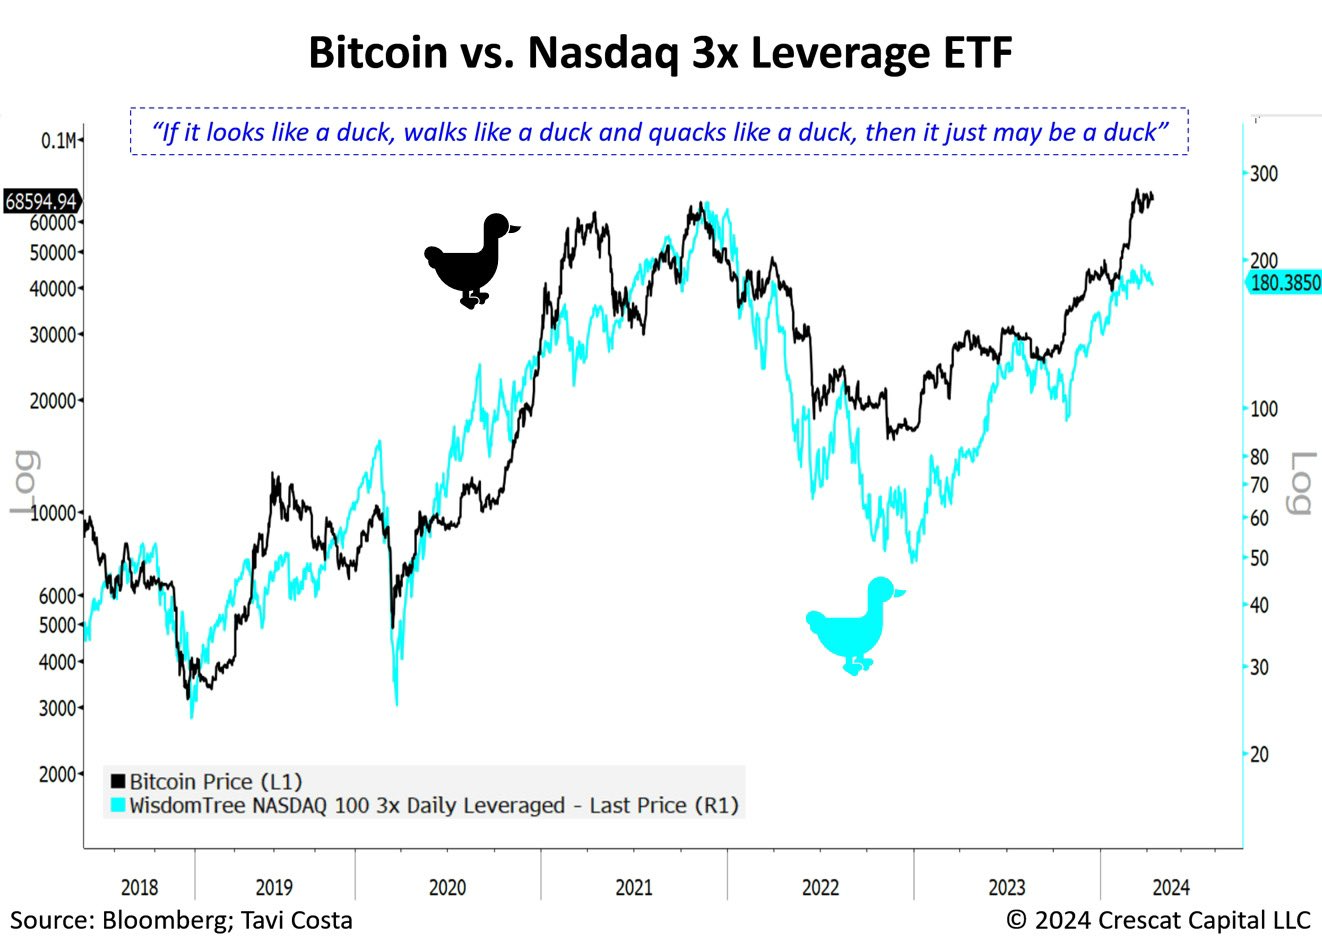
Next, we look at bitcoin. This chart from Tavi Costa probably tells you everything you need to know. And this analysis I did comparing TQQQ to BTC takes the same analysis in a more quantitative direction.
But just to confirm, here’s the chart of what bitcoin does when the NASDAQ is up or down more than one standard deviation.
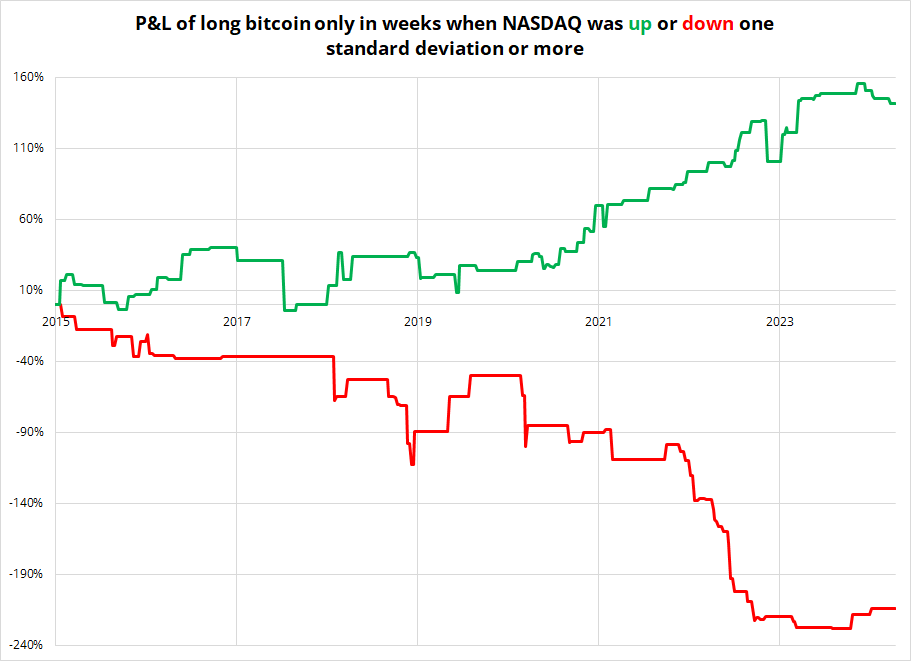
This confirms the idea that big down moves in NASDAQ tend to see big down moves in bitcoin at the same time, and vice versa. That said, bitcoin did show some independence through the ETF announcement and launch period as down moves in NASDAQ were absorbed by pre-ETF and post-ETF launch buyers. That does not change my overall impression that bitcoin is a risky asset, but it does show that idiosyncratic flows matter. Verdict: Bitcoin is a hedge against loose monetary policy, and a risky asset.
And finally, what about the USD? It’s a good safe haven, generally.
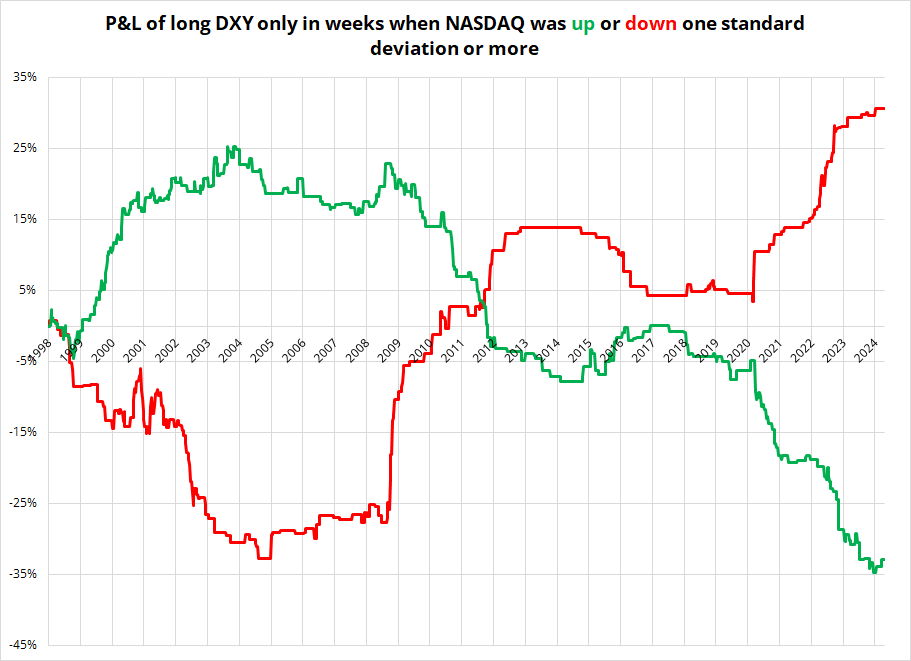
You can see that during dotcom, the USD was not a good safe haven as the tech bubble flows were a big driver of the dollar in both directions. Then, in 2008, the USD was a great safe haven. It lost that role once the eurozone crisis ended but reaffirmed it in COVID. There is no guarantee that the USD will be a safe haven in the next recession. Debts and deficits are huge and the tech inflows and vibes this cycle are similar to 1999/2000. This cycle, like then, there was no alternative to US assets. Until everyone wanted out, then there was.
Conclusion
The biggest takeaway here is that there are not many good liquid safe havens in a time of rising inflation. Bonds don’t work, JPY and CHF don’t work, and risky assets like silver and bitcoin obviously don’t work. If you are worried about a lower stock market, the best hedge is cash. Especially when T-bills are yielding north of 5.3%.
Final Thoughts
A study of safe haven performance during pandemics.
The COVID-19 pandemic raised whether Gold and sovereign bonds are a safe haven during epidemics. We study the effectiveness as safe haven during the epidemics caused by SARS, Ebola, Zika, Swine Flu, and COVID-19. To this end, this study employs a DCC-GARCH model to analyze the conditional correlations between daily returns of S&P 500 and MSCI Emerging Markets Index with Gold and the major sovereign bonds. Our results show that Gold is a weak safe haven for stock market investors during the epidemics, and U.S. treasuries are the safest option, followed by Japanese sovereign bonds.
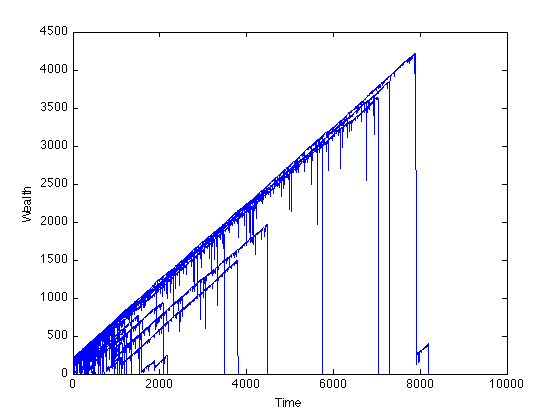
And finally, here is a cool simulation of 100 people using a martingale strategy, starting with $100 each. Hope you get out of your trades at the perfect time today.

https://math.stackexchange.com/questions/83904/on-martingale-betting-system
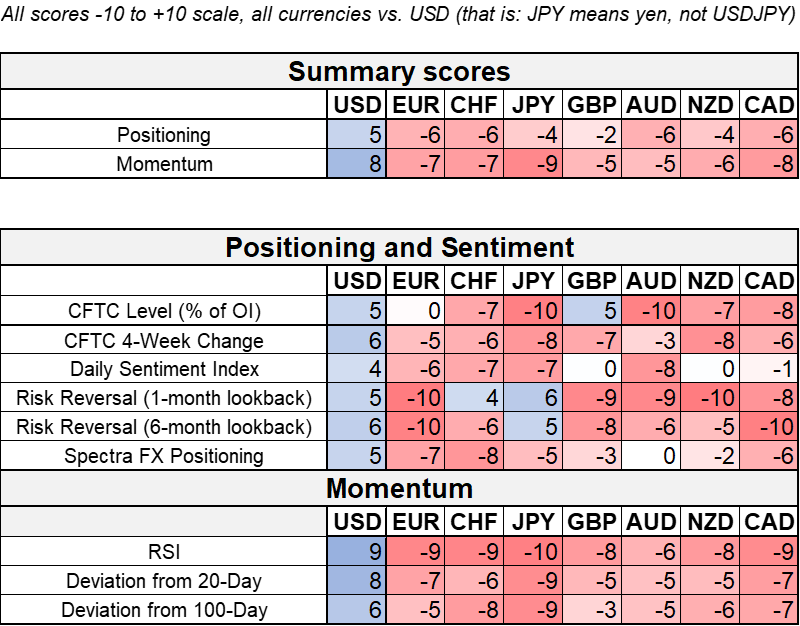
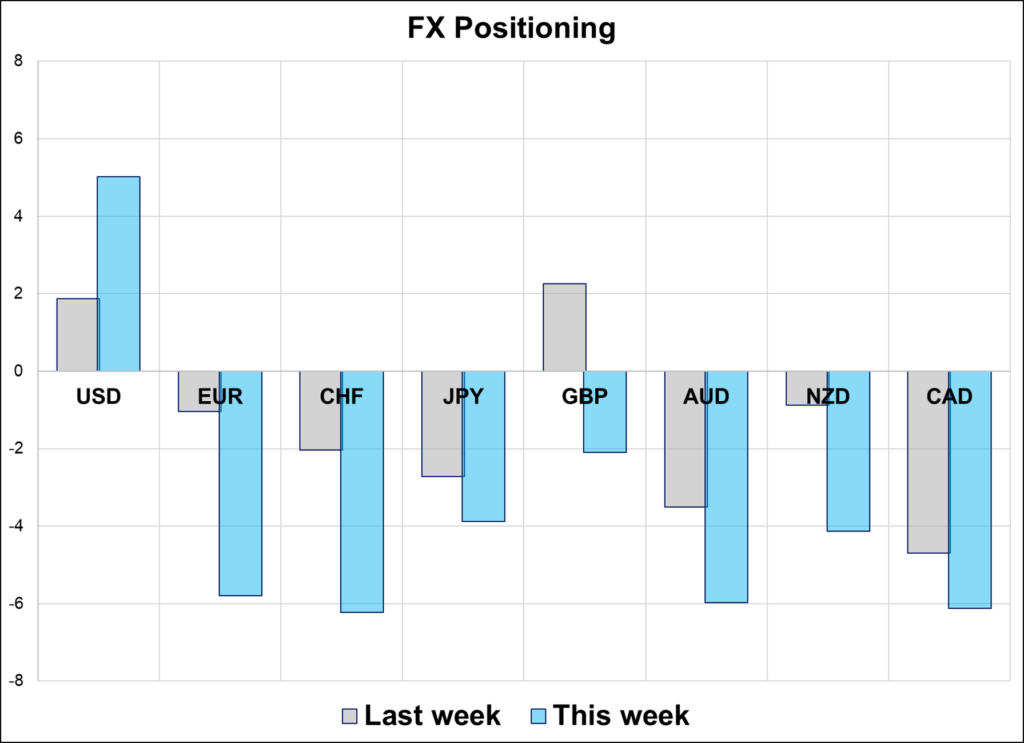
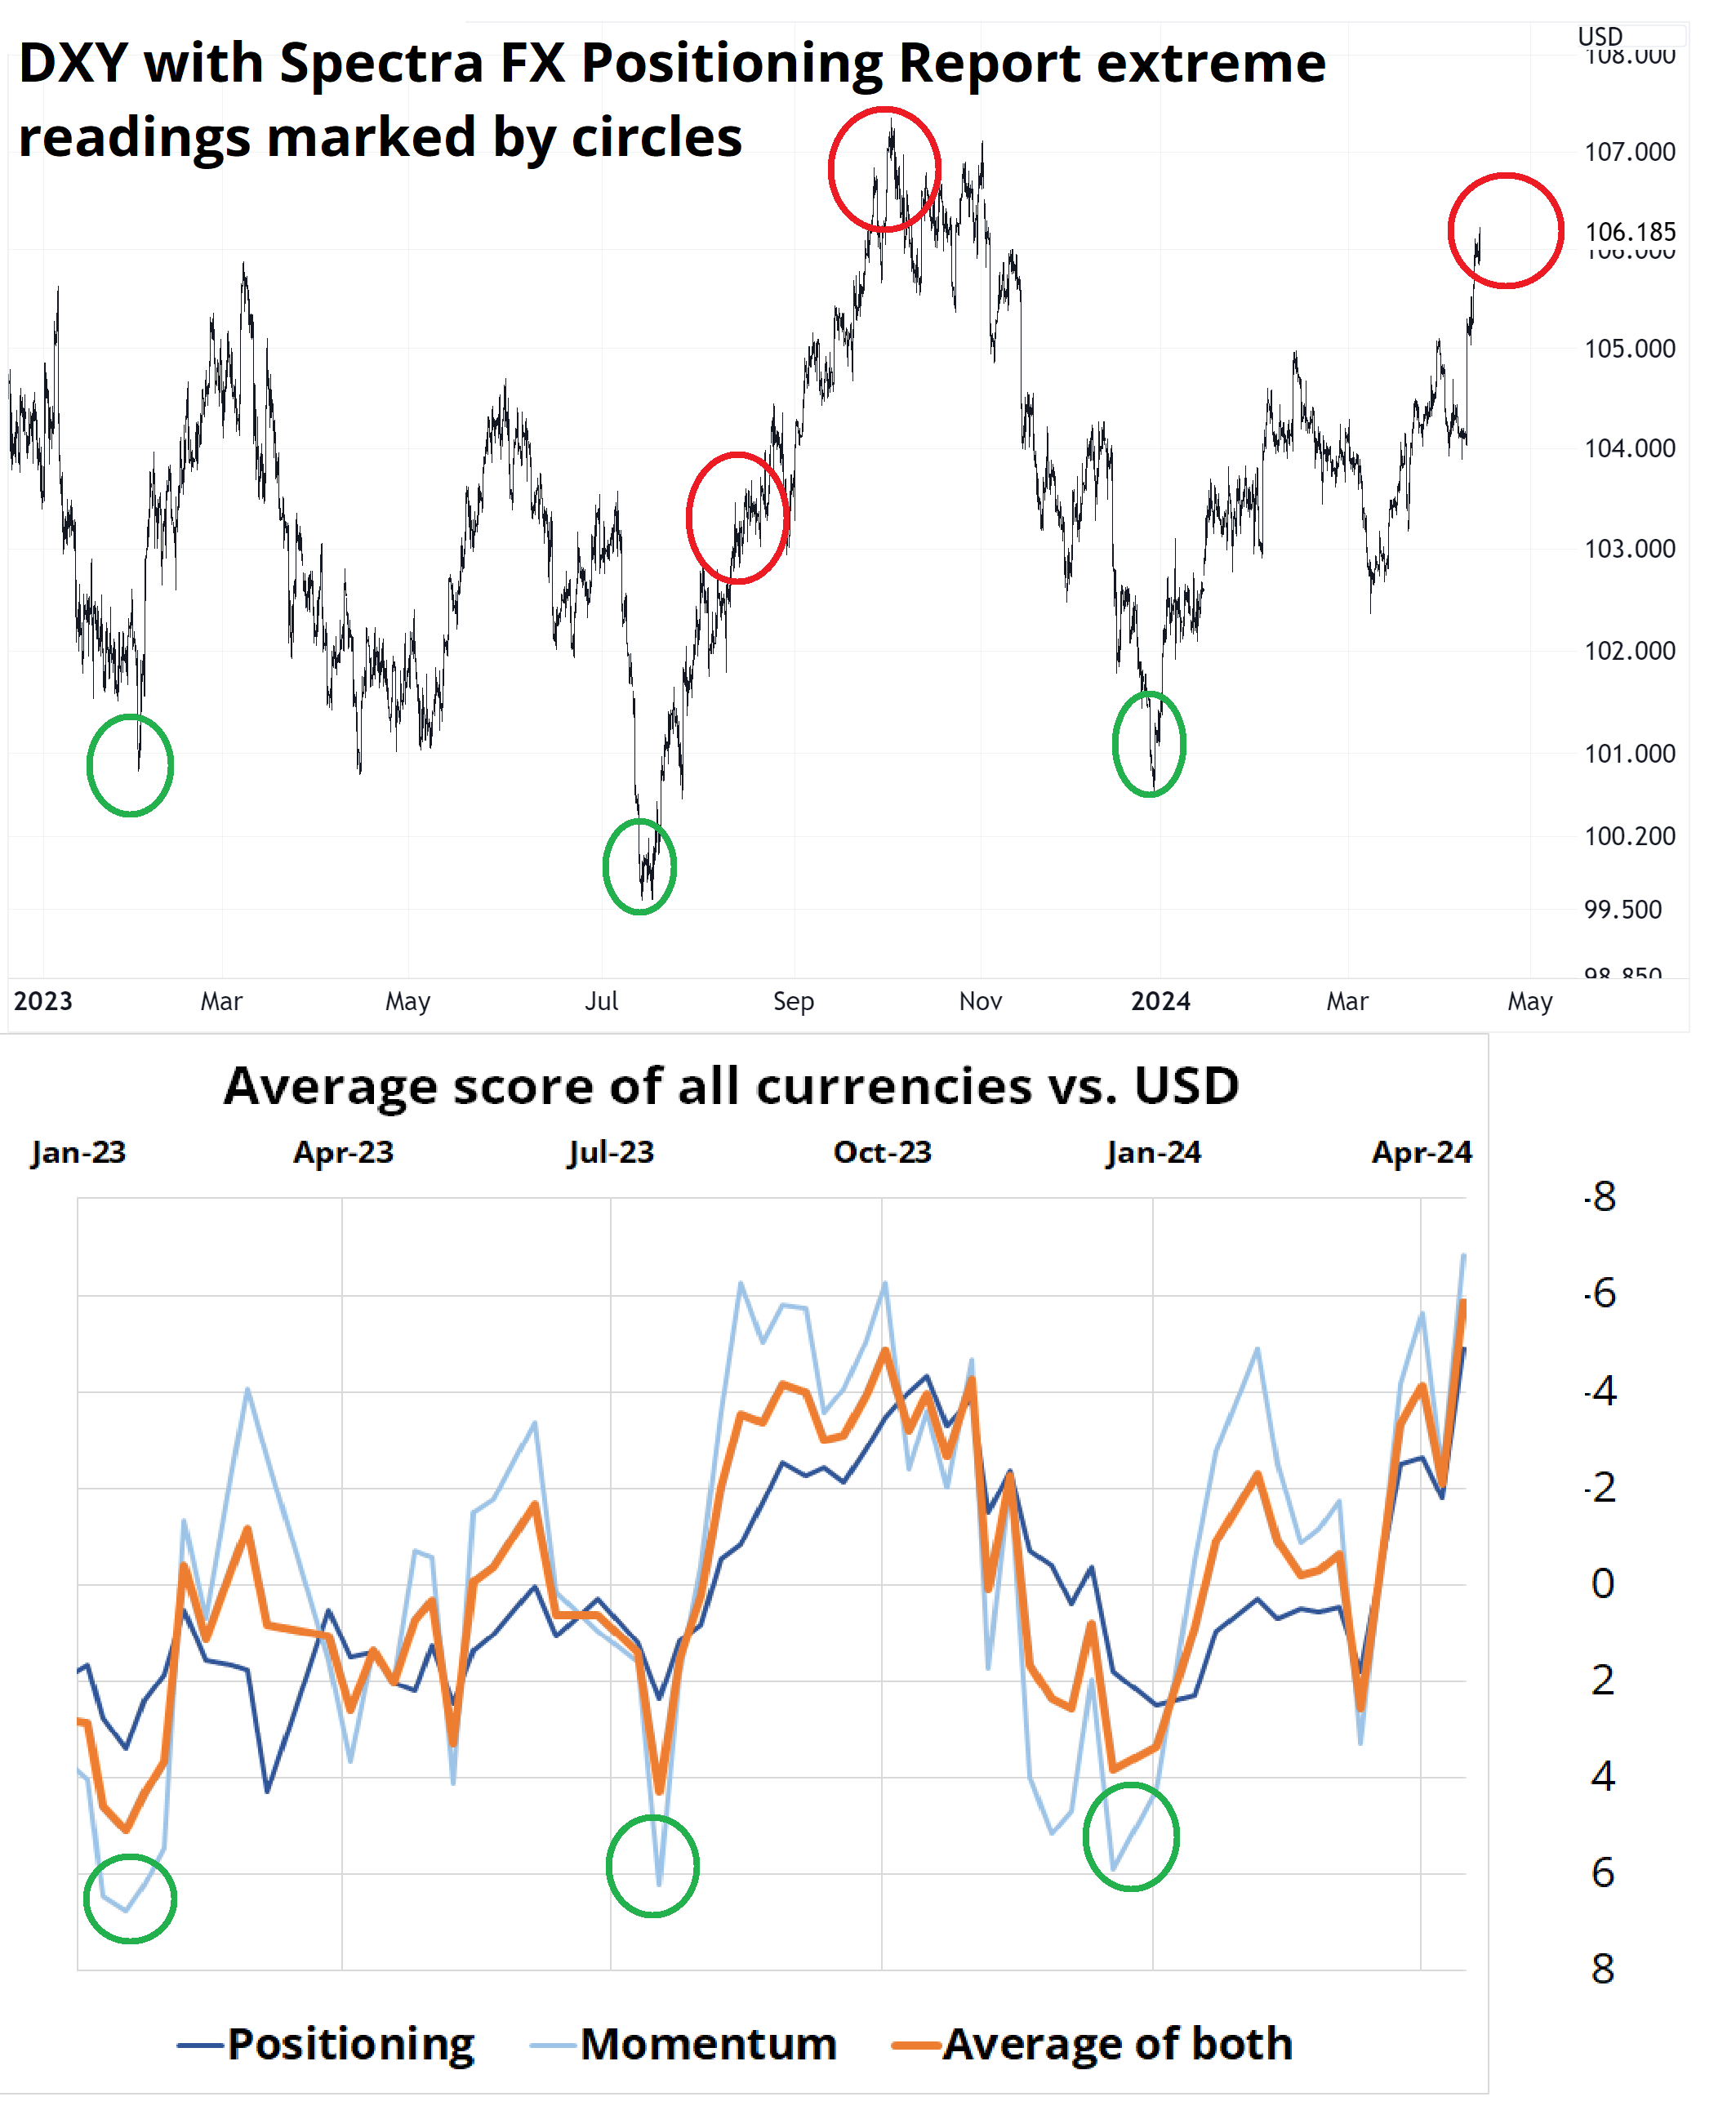
The Spectra FX Positioning and Momentum Report
USD longs and momentum hit a new record high (series started in October 2022)
Hi. Welcome to this week’s report. We have been running this thing since October 2022 and the readings this week are the most extreme so far. Both long USD momentum and long USD positioning have touched never-before-seen levels. This touching of the extreme does not have a perfect record in forecasting USD turns, but it’s pretty close as it’s identified an important turning point four out of five times. That said, the DXY has been in a range the whole time so that could be overstating this indicator’s ability to pick the turns because mean reversion signals work best in rangebound, not trending markets.
At Lehman Brothers, we got a report showing the total dollar position for the firm, and it looked identical to the bottom panel and had similar predictive power. Whenever the firm’s position exceeded $2 billion long or short, the dollar would turn shortly after. If Lehman was around today, the USD position would probably be around long 2B.
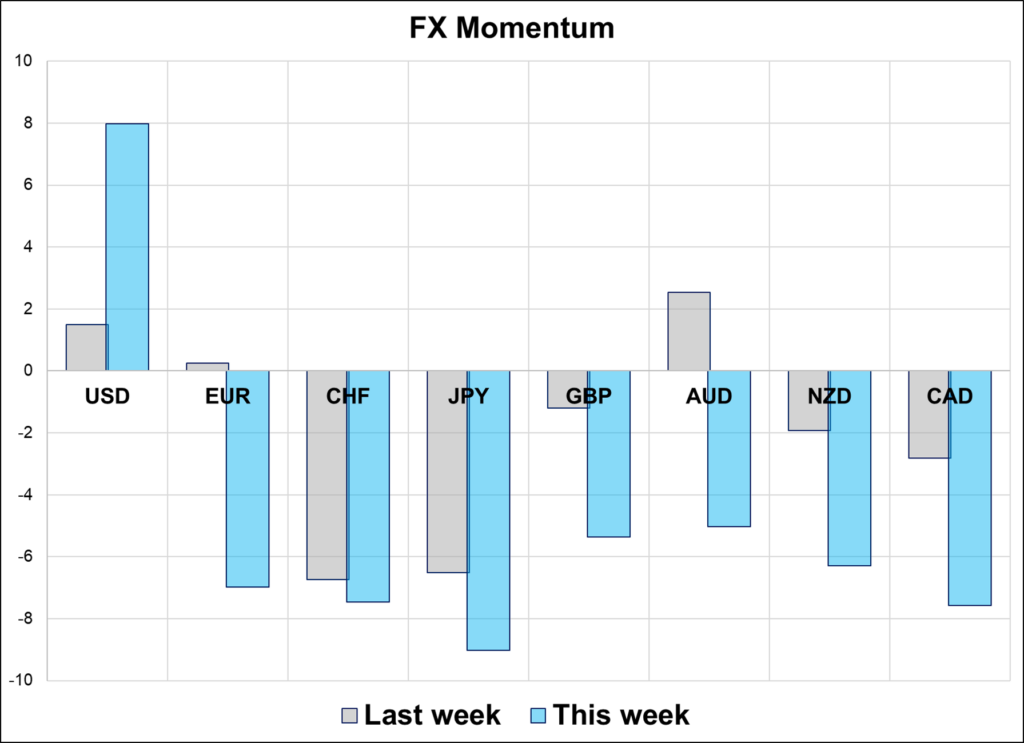
If you look at the grid below, you can see that the most extreme USD pairs are EURUSD, USDCHF, AUDUSD, and USDCAD. So, if you’re looking for a reversal, those are the places to look. USDJPY and NZDUSD too, I suppose. Anything but GBPUSD, where the CFTC remains long and the DSI (Daily Sentiment Index) hasn’t turned at all.
When I studied the DSI in the past, readings above 90 and below 10 (out of 100) have been good contrarian signals. Currencies that meet that criterion now are DXY (91) and CAD (10). EUR is 22, and JPY is 13.
Thanks for reading. And thx JR for the data and the lurvly chart.