Welcome to Bella's Blue Cable Thread.
I started this thread to post my analysis and real time trades as it happens. I used to post my analysis and trades in Cable Update Thread and now decided to move to a new section due to having a hard time referencing and locating my previous charts.
History as a Trader: I started trading in September end 2022 so basically i am still under 1 year of my trading career. I trade only GBPUSD and will stick to this pair for personal preferences and reasons trying to be a professional in this pair.
Course Books used for Skills Development
1. The Wave Principal ( Prechter )
2. The Pivot Boss ( Franklin O.Ochoa)
3. Gann Square of 9 ( Mikula )
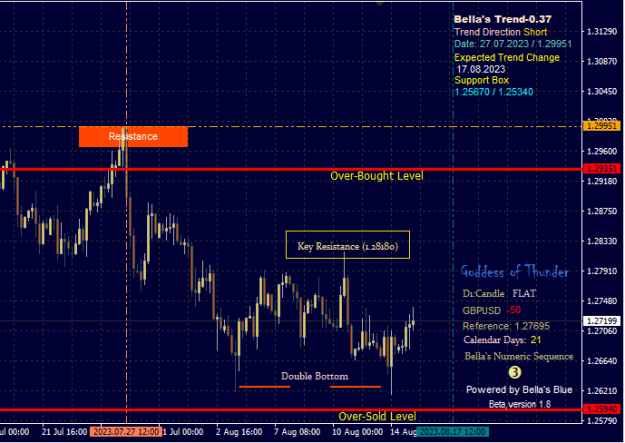
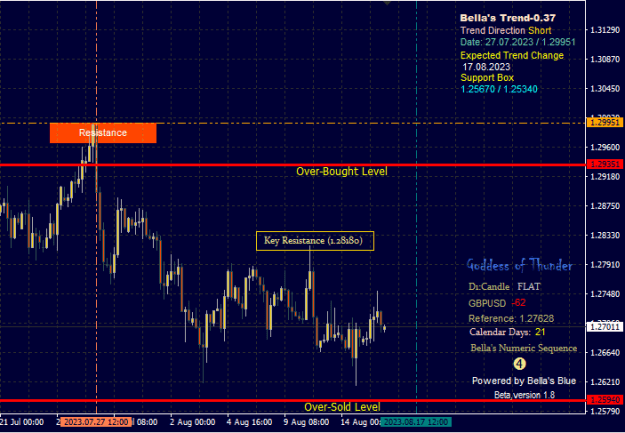
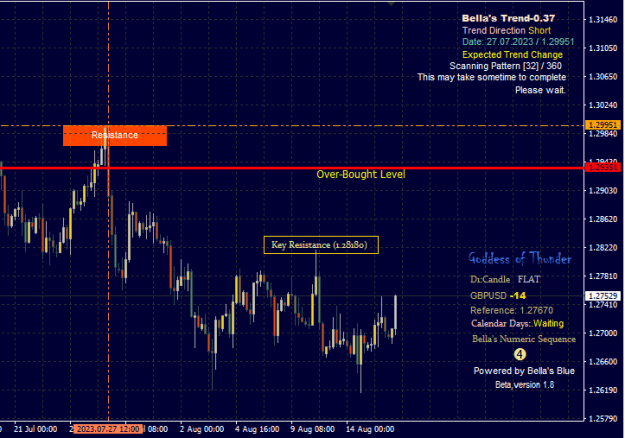
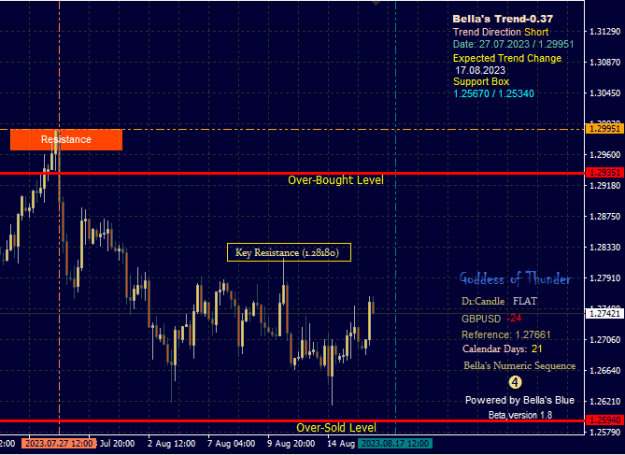
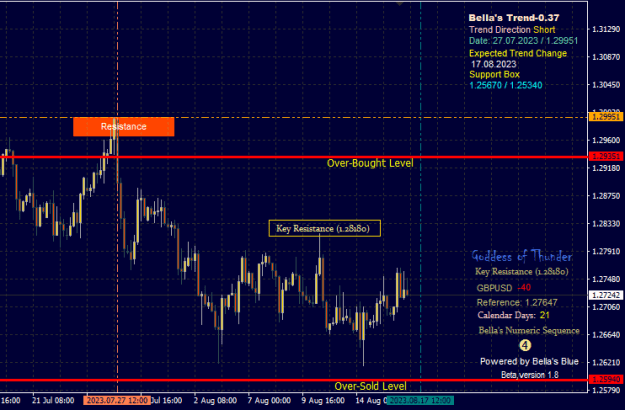
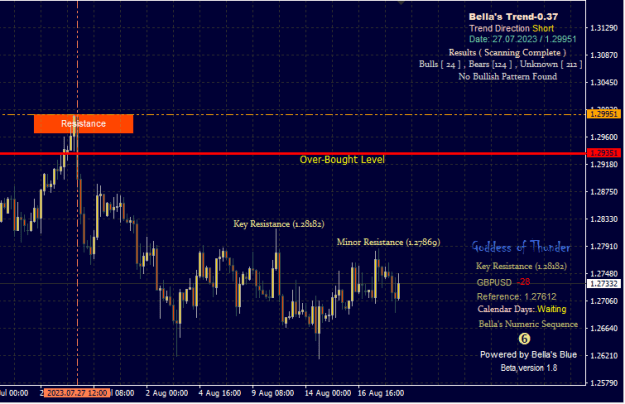
Bella's 0.37 (Swing High and Lows )
This technical indicator predicts swing turning points
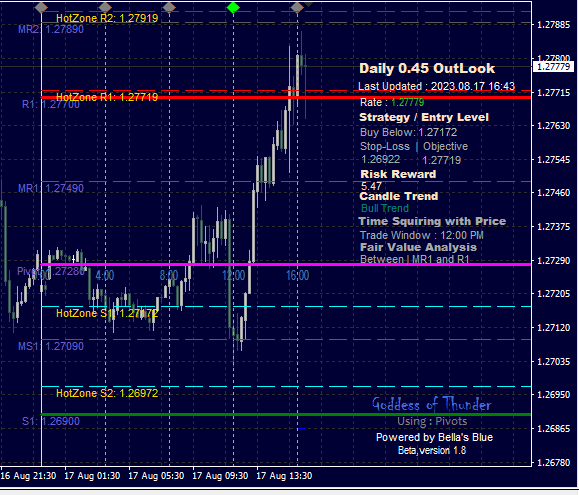
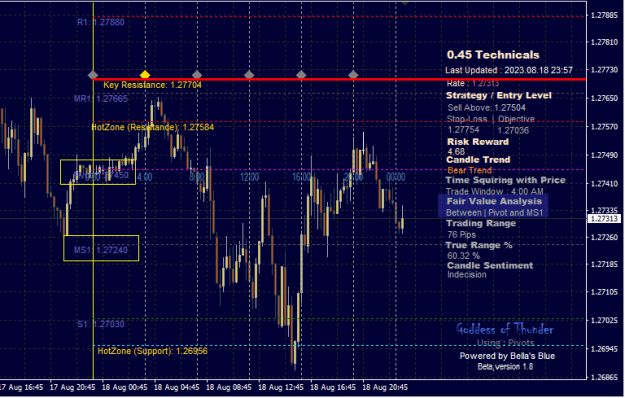
Trend-0.45 (Technicals)
coming soon....
Trend-0.25 (Currency )
This is a special trend that works with currency pair such as GBPUSD. The trend is not depended on time frame such as Daily or Monthly but on Currency as a whole. This trend provides unique / static support and resistance and trend direction is all time frames/
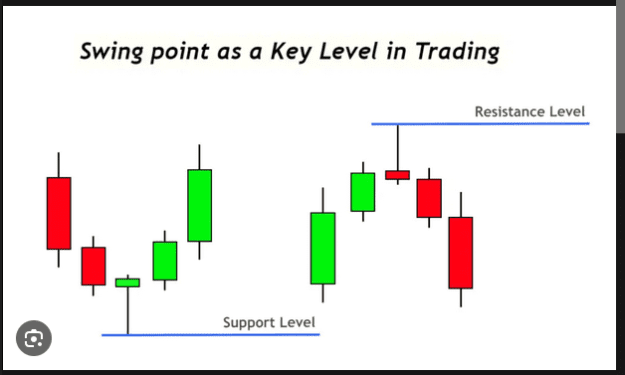
Swing High and Swing Lows
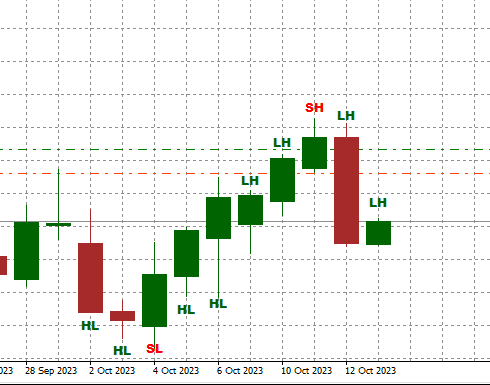
Swing High and Lows
A swing high is simply any turning point where rising prices changes to falling prices . I define a swing high (SH) as a price bar high , preceded by two lower highs (LH) and followed by two lower highs (LH) . ( Diagram Above ).
Likewise a swing low is simply any turning point where falling prices changes to rising prices. I define a swing low (SL) as a price bar low , preceded by two higher lows (HL ) and followed by two higher lows (HL) (Diagram Above ).
Many Traders like my self try to trade these SH and SL what they call in trading community "Picking Tops and Bottoms". This could be very nice strategy if you exercise stop loss with it .
( Note: there is no trading without stop loss - if they tell you something else just visit their home to see what they earn through trading also no hedging or averaging ) reason is? you are not actually forecasting anything period. Preferably your R/R should be on average > 2.0. ( It is another topic how to understand an effective trading strategy or write one ) .
Other usages of Swing High and Swing Lows
1. These areas will also produce key support and key resistance areas which can be used while the pair is retracing or trending
2. Multi time frame analysis : It can help to see a Bigger Picture in context of higher time frame action. ( you could trade 15 min by looking at higher time frame structure say 60 min ).
3. Used to Create trends ( effective but depends on trader analysis ) one example is Bella's Price Action Analysis.
Technical Indicators (D1)
1. MACD : MACD is a Trend following momentum indicator that shows the relationship between 2 Exponential moving Averages namely 8 and 17 (Subtracting 17 period EMA from 8 period EMA ).
2. STOC : STOC is a momentum indicator comparing a particular closing price ( 8 Period ) of a security to range of it's prices over certain period of time (0-100).
3. EMA : Trend Following EMA (24 Period ) a commonly used technical analysis indicator it helps to smooth out the price and to see the average price of the instrument ( Mean value )
Why Use these Indicators:
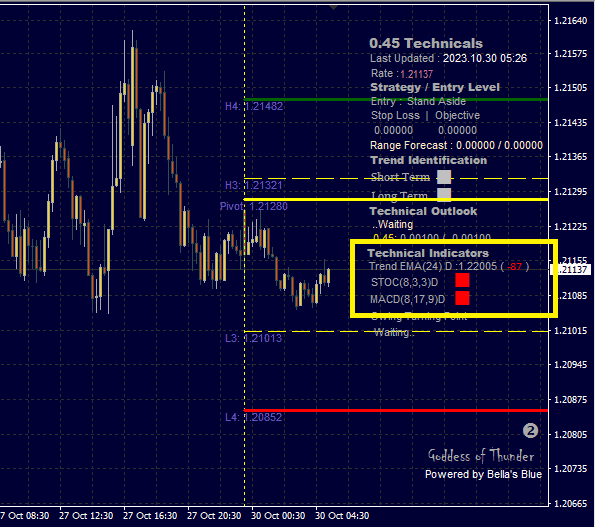
I don't use these indicators to generate signals of buy or sell . These indicators are used for gathering statistics of current market analysis.
by looking at the figures below in the image ( Live Example ).
Data is :EMA is : 1.22005 , MACD is Short and STOC is Short
I read it as : The current statistics of last 8 Days is Bearish and the mean is 1.22005 for 30.10.2023.
STATS
Posting Rules on the Thread:
Only GBPUSD Charts and Trades are allowed to be posted on this thread. ( Note : Don't Post any charts which are against my trades )
Bella ( Goddess of Thunder )
I started this thread to post my analysis and real time trades as it happens. I used to post my analysis and trades in Cable Update Thread and now decided to move to a new section due to having a hard time referencing and locating my previous charts.
History as a Trader: I started trading in September end 2022 so basically i am still under 1 year of my trading career. I trade only GBPUSD and will stick to this pair for personal preferences and reasons trying to be a professional in this pair.
Course Books used for Skills Development
1. The Wave Principal ( Prechter )
2. The Pivot Boss ( Franklin O.Ochoa)
3. Gann Square of 9 ( Mikula )
Bella's 0.37 (Swing High and Lows )
Attached Image (click to enlarge)
This technical indicator predicts swing turning points
Trend-0.45 (Technicals)
coming soon....
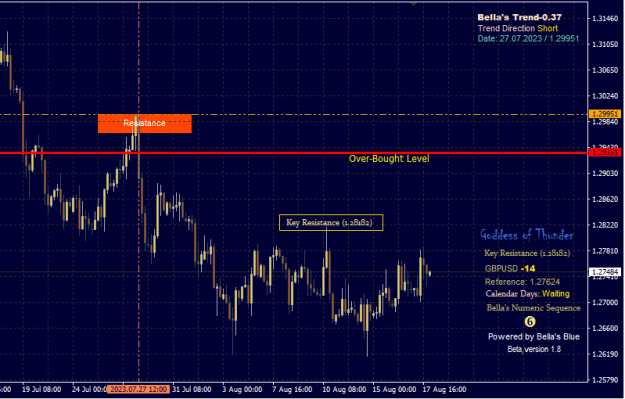
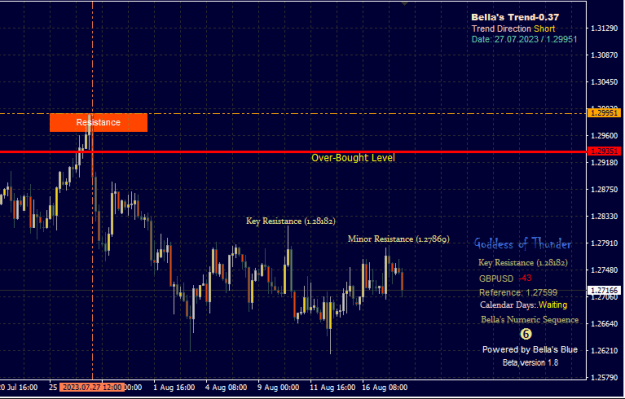
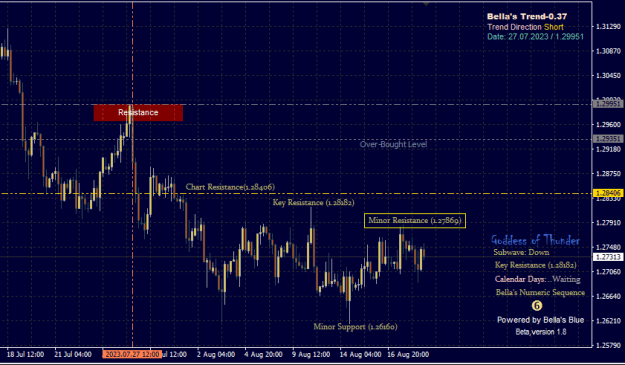
Trend-0.25 (Currency )
This is a special trend that works with currency pair such as GBPUSD. The trend is not depended on time frame such as Daily or Monthly but on Currency as a whole. This trend provides unique / static support and resistance and trend direction is all time frames/
Swing High and Swing Lows
Attached Image (click to enlarge)
Swing High and Lows
A swing high is simply any turning point where rising prices changes to falling prices . I define a swing high (SH) as a price bar high , preceded by two lower highs (LH) and followed by two lower highs (LH) . ( Diagram Above ).
Likewise a swing low is simply any turning point where falling prices changes to rising prices. I define a swing low (SL) as a price bar low , preceded by two higher lows (HL ) and followed by two higher lows (HL) (Diagram Above ).
Many Traders like my self try to trade these SH and SL what they call in trading community "Picking Tops and Bottoms". This could be very nice strategy if you exercise stop loss with it .
( Note: there is no trading without stop loss - if they tell you something else just visit their home to see what they earn through trading also no hedging or averaging ) reason is? you are not actually forecasting anything period. Preferably your R/R should be on average > 2.0. ( It is another topic how to understand an effective trading strategy or write one ) .
Other usages of Swing High and Swing Lows
1. These areas will also produce key support and key resistance areas which can be used while the pair is retracing or trending
2. Multi time frame analysis : It can help to see a Bigger Picture in context of higher time frame action. ( you could trade 15 min by looking at higher time frame structure say 60 min ).
3. Used to Create trends ( effective but depends on trader analysis ) one example is Bella's Price Action Analysis.
Technical Indicators (D1)
1. MACD : MACD is a Trend following momentum indicator that shows the relationship between 2 Exponential moving Averages namely 8 and 17 (Subtracting 17 period EMA from 8 period EMA ).
2. STOC : STOC is a momentum indicator comparing a particular closing price ( 8 Period ) of a security to range of it's prices over certain period of time (0-100).
3. EMA : Trend Following EMA (24 Period ) a commonly used technical analysis indicator it helps to smooth out the price and to see the average price of the instrument ( Mean value )
Why Use these Indicators:
I don't use these indicators to generate signals of buy or sell . These indicators are used for gathering statistics of current market analysis.
by looking at the figures below in the image ( Live Example ).
Data is :EMA is : 1.22005 , MACD is Short and STOC is Short
I read it as : The current statistics of last 8 Days is Bearish and the mean is 1.22005 for 30.10.2023.
STATS
Attached Image (click to enlarge)
Posting Rules on the Thread:
Only GBPUSD Charts and Trades are allowed to be posted on this thread. ( Note : Don't Post any charts which are against my trades )
Bella ( Goddess of Thunder )
Goddess of Thunder..