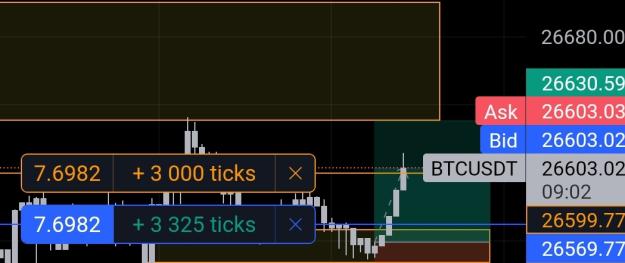
As a long time fan of mark douglas, I am curious of creating a model based on what he said which is daily bias and 30 min support and resistance bounce.
I feel this model is the nearest I've come up with. The methods are not original as it is simply basic tech analysis and using confirmed orderblocks as highs x low where current price may go to or bounce from.
The idea therefore is if bias is short, only sell upon 30m bounce to the short.
Id the daily bias is long, only long orders upon the 30m bounce.
Daily time frame old school higher high lower high for longs and lower low higher low for shorts.
And these models must be before the current daily price.
Example.
https://www.tradingview.com/x/3nVwCskE
Now 30m only buy orders
https://www.tradingview.com/x/JPSvJeJx
So in a way a bounce on the confirmed lows was a safe choice reducing the risk.
This is a very basic and nice model. Using his words of daily trend or bias.
I can say and improve it via using the orb and using the daily bar's opening price where if price is going long or away from opening to the long side, buy only, and if price is below the opening, simply aim to sell.
You can also observe here there's a lot of fvg one may use. I personally love the orderblocks as ceiling and floors because rhey show range and are fat.
I believe this basic methodology is very important to the trader who uses tech analysis.
Application.
Watching mark douglas vids, daily and 30 mins is the only sample i saw.
But it could be other timeframes too.
Daily, 15m, 5m, 1m, 30m, 1h, 2h, 3h, 4h.
Weelly, daily
Monthly, weekly.
Summary.
Plot the daily bias via the higher high lower high or lower low higher low model or. Price respective to the opening price of the day.
Then choose a time frame for your floor and ceiling that should be before the current price.
Applying mark douglas experiment. Each trade's risk must at most be 5% of the capital. As there are 20 trading days in a month, one therefore must not make more than 5% capital loss in a day. So you can have multiple trades. Just not more than 5%. (Also every daily draw down rule of prop firms).
Your tp is up to you. 1 to 1, 1 to 2, or based on the market structure (the range of the confirmed high and confirmed low).
Of course, this is probably not how mark douglas trades as the range i use here is simply my own interpretation of how one ought to view the range. Of course others can use other ways.
Let me know what you think?
https://www.tradingview.com/x/2p3S0p1q
Today, example.
Btc usd. Daily higher high lower high.
30 m support and resist.
https://www.tradingview.com/x/2p3S0p1q
Model entry inside bar. To the north.
8am +8gmt for me onwards is the ideal time to find an entry.
https://www.tradingview.com/x/AQcdurcM/
Target acquired
Trading is gambling. So gamble responsibly.
