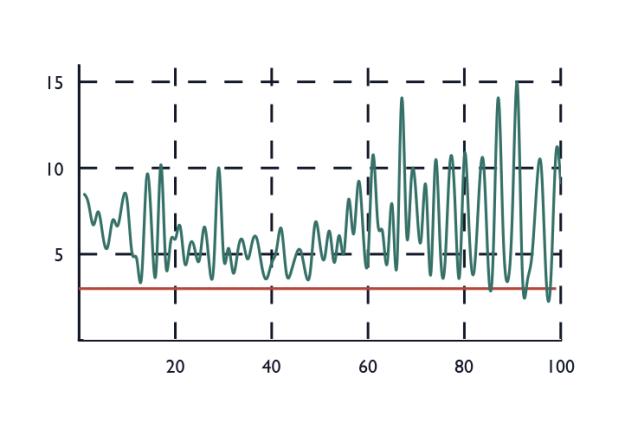
Disliked{quote} Allow me to complement this. Under the assumption of a random walk market I wanted to know which kind of candlesticks I can expect on average. Thus, I considered a random walk with (-1, +1) increments and generated 10000 candlesticks with 10000 steps. Here are the results: {image} On the x axis you can see the probability for getting a +1 in any of the 10k step. The top panel shows the average bull bars that can be expected for every probability, the middle panel the average bear bars that have shown up in my simulation and in the bottom...Ignored
I think the pressure is always essentially “equal”.
with this simulation, I am assuming the outcomes produce a normal distribution with 3 kurtosis?
can you run the simulation, and with a kurtosis of 4-5 to see how that changes the candles? I imagine it will make them more unstable, with much more overlap.
ri · skuht