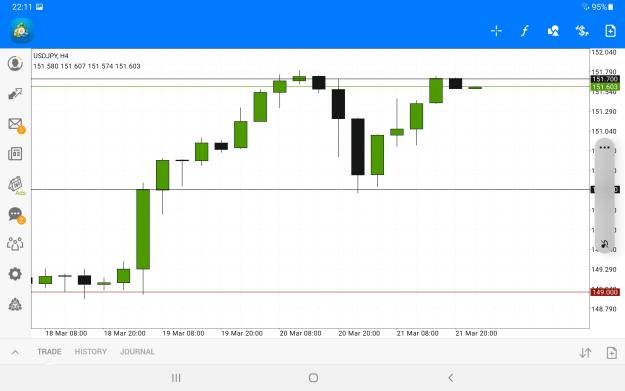
Can you see the big green candle 19/03 @04:00 the close price was 1.5030
Also the next candle where the open price was 1.5030
Once you see open = Close it means it's a zone level (support &resistance level at the same time )
Also the candle after it 19/03 @ 12:00 finished above the 1.5030 level by few points which means there is liquidity
And the algorithm needs to attack the buying stops below that level.
So the big black candle on 21/03 where the day started it hits the 1.5030 level clearing all the liquidity there and after
That we headed upwards to the 1.5170
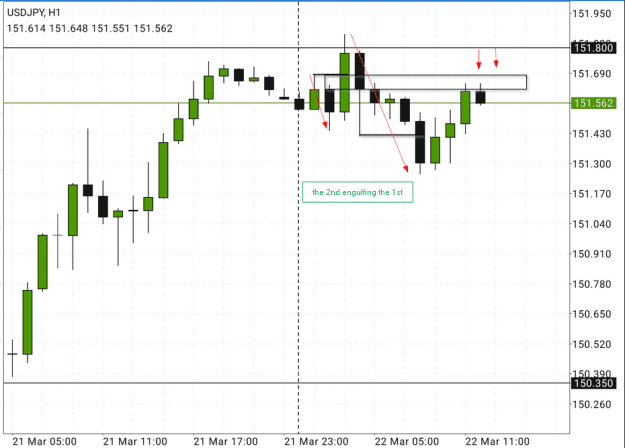
Sure As you know the day finished with low of 1.5030 and high of 1.5170 So the daily range was around 140 points plus minus. Danger-Mouse asked very serious question which h everyone should ask . What's so special about the 1.3000 level that we rocketed 140 plus points As well as 1.5170 that we are reversing. Let me give you a tip 1.5170 is the high of the day and the high of the week .
Ignored
Hmm..I'm guessing this has something to do with using ADRs.
Well...Wednesday was actually the high of the week at 151.82ish. Wait a minute...are u talking about 3 bar fractals?
Tomorrow I hope I will have some time to give you fact no2 which will help you in your trading journey
If you attach it to fact no 1 you will understand where every candle is heading and why.
Wish everyone profitable trading
Can you see the big green candle 19/03 @04:00 the close price was 1.5030 Also the next candle where the open price was 1.5030 Once you see open = Close it means it's a zone level (support &resistance level at the same time ) Also the candle after it 19/03 @ 12:00 finished above the 1.5030 level by few points which means there is liquidity And the algorithm needs to attack the buying stops below that level. So the big black candle on 21/03 where the day started it hits the 1.5030 level clearing all the liquidity there and after That we headed upwards...
Ignored
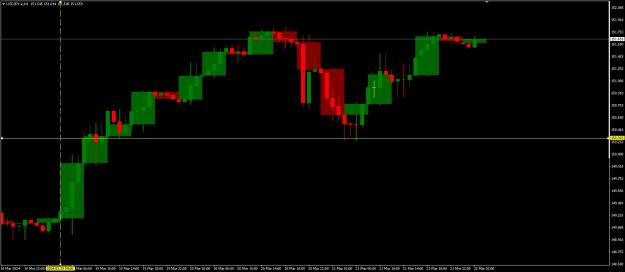
Ok..I'm off for some sleep, but I'll leave this and see what u suggest as it's one of my pet hates with charts over 1hr timeframe.
It's bad enough at this time of year with the stupid daylight saving switchover all out of sync between countries, but I've overlaid H4 candles on my H1 chart. Can you see that my "4am" candle actually ends an hour before your 4H does? Therefore the open and close of these H4 candles are going to be different from yours.
Can you see the big green candle 19/03 @04:00 the close price was 1.5030 Also the next candle where the open price was 1.5030 Once you see open = Close it means it's a zone level (support &resistance level at the same time ) Also the candle after it 19/03 @ 12:00 finished above the 1.5030 level by few points which means there is liquidity And the algorithm needs to attack the buying stops below that level. So the big black candle on 21/03 where the day started it hits the 1.5030 level clearing all the liquidity there and after That we headed upwards...
Ignored
how about for other brokers, sometimes open and close prices are different from one broker to another, isnt? Thanks
Can you see the big green candle 19/03 @04:00 the close price was 1.5030 Also the next candle where the open price was 1.5030 Once you see open = Close it means it's a zone level (support &resistance level at the same time ) Also the candle after it 19/03 @ 12:00 finished above the 1.5030 level by few points which means there is liquidity And the algorithm needs to attack the buying stops below that level. So the big black candle on 21/03 where the day started it hits the 1.5030 level clearing all the liquidity there and after That we headed upwards...
Ignored
I don't quite follow...
There's almost never a gap between the close of a bar and the open of the next in FX.
(except in weekends or red news)
As we grow we begin to understand some facts that must must must happen every single day. Pay attention to the word must. These facts we can not change them or bypass them ie every day we must have sunrise and sunset. IN TRADING THERE ARE SOME FACTS EVERYONE NEEDS TO KNOW ABOUT THEM
Ignored
Does it have something to do with "rebalancing" - action always followed by an (equal) reaction?
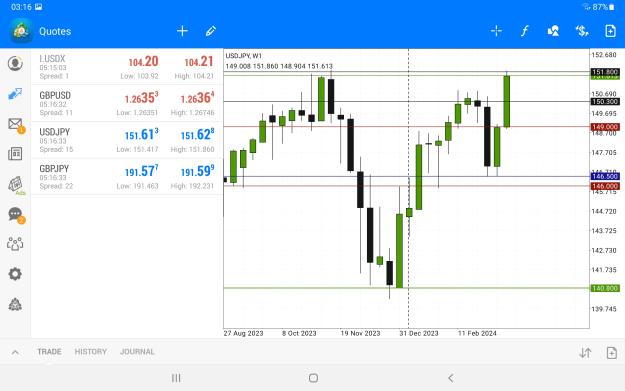
Yesterday I made a mistake when I said 1.5170 is the high of the week It was the high of the day I need anyone to tell me why I was wrong just by looking at the candles. The answer is in front of you try to figure it out .
{quote} Hmm..I'm guessing this has something to do with using ADRs. Well...Wednesday was actually the high of the week at 151.82ish. Wait a minute...are u talking about 3 bar fractals?
Ignored
Because Wed was still high of the week at that point