{quote} I want a retrace back into my fib retracement, or I'm not getting in it I am short on usdcad, though. Don't look at too many pairs or else you risk becoming overwhelmed. {quote} I mean reversed the rally and dropped.
{quote} This is my try: On the Daily: SUPPLY started at 24/06, very big red candle. http://prntscr.com/cpme5r On 4H we can zoom in a bit, we see that supply entered the market at 1.1350, see the turquoise line, on the 18/08 it entered this zone and topped at 1.1368 http://prntscr.com/cpmgql
{quote} How did you place your FIB on the EUR/USD pair?
Ignored
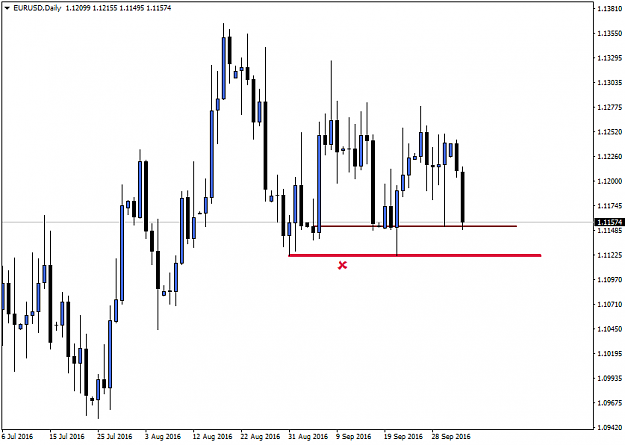
By going on a smaller timeframe, it's hindsight now, but expect it to hit back 1.1164. This is what I meant, when I said it's risky to buy too low below the daily open.
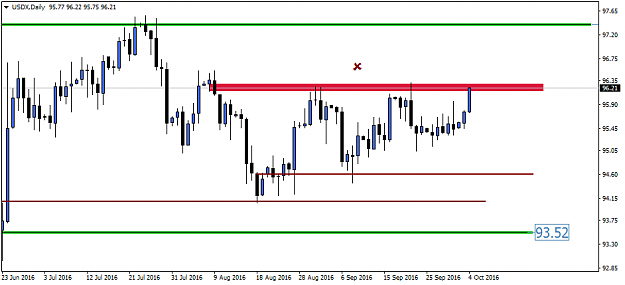
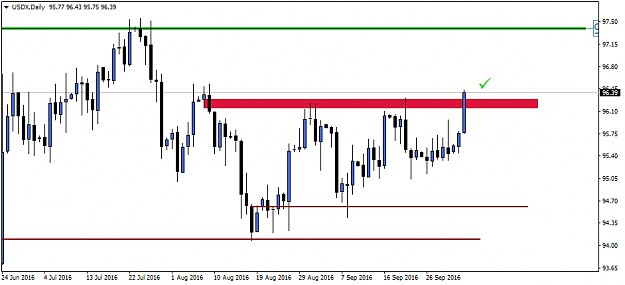
In order to make sense of what's going on, we take to the USDx chart. Now I'm not saying it will, but there are strong chances dollar pops above those highs.
Looking at a daily EU chart, 1.1150 was tested. It's an important level because it doubles as a psych number and demand. I would rather not take any longs today, because any rally would be shortlived.
{quote} Thx, would be curious to know the reasons you took the trade, from long term and short term perspective.
Ignored
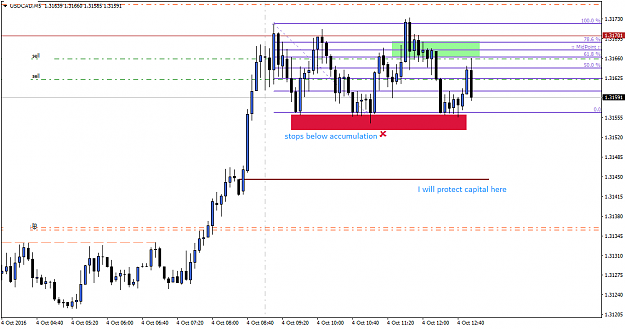
The answer is within this recent price action. Markets are like a pendulum. They oscillate and you know, what goes up has got to fall
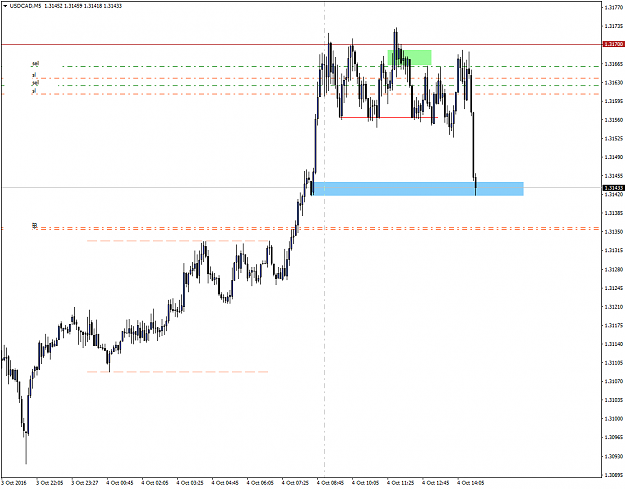
The way I see it, price declined from 1.3170 and then rallied back to complete the range. It then proceeded to consolidate and this morning I woke up to see accumulation right below the level. I looked for an entry inside the range.
What worries me is the dollar strength as demonstrated on the USDx chart I posted earlier... In case it manages to go beyond 96.32 it's bad news for my shorts as well as any EU longs..
{quote} The answer is within this recent price action. Markets are like a pendulum. They oscillate and you know, what goes up has got to fall The way I see it, price declined from 1.3170 and then rallied back to complete the range. It then proceeded to consolidate and this morning I woke up to see accumulation right below the level. I looked for an entry inside the range. What worries me is the dollar strength as demonstrated on the USDx chart I posted earlier... In case it manages to go beyond 96.32 it's bad news for my...
Ignored
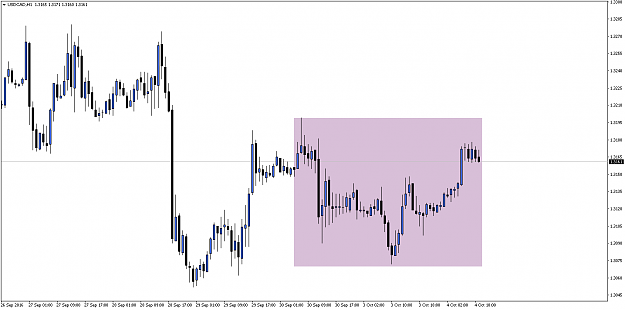
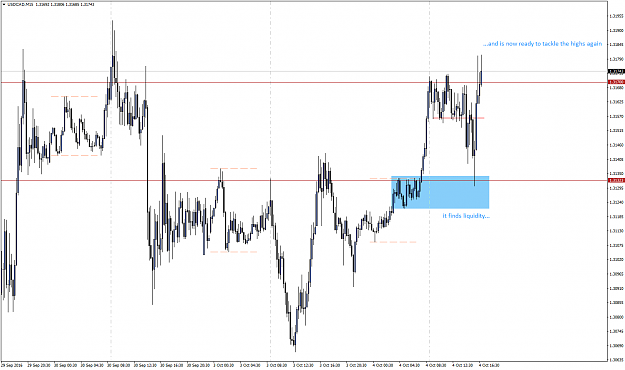
This is what I meant when I said it completed the range and needs new fuel to keep moving. Dipped to the asian session accumulation, straight into demand (and more importantly - liquidity) and took off. Also have a look at the dollar index, it busted the highs.
{quote} This is what I meant when I said it completed the range and needs new fuel to keep moving. Dipped to the asian session accumulation, straight into demand (and more importantly - liquidity) and took off. Also have a look at the dollar index, it busted the highs. {image} {image}
Ignored
I modified my TP to yours at 1.3136 on the USD/CAD and it was almost the low...so thx for that, good trade for me
On the other hand, I was stopped out on my EUR/USD trade , 10 pips lower it reversed, the problem with 2 demand zones on top of eachother, you don't know where to place your stop. Still learning, I will get better at this in the coming weeks
{quote} I modified my TP to yours at 1.3136 on the USD/CAD and it was almost the low...so thx for that, good trade for me On the other hand, I was stopped out on my EUR/USD trade , 10 pips lower it reversed, the problem with 2 demand zones on top of eachother, you don't know where to place your stop. Still learning, I will get better at this in the coming weeks http://prntscr.com/cpufzn
Ignored
Glad to hear it Careful though, sometimes I can get it wrong. As for EU, like I said - too far down below the daily open. Rallies were tiny up until that huge jump up at london close.
It would appear you enter your trades using a H4 chart. What I'm trying to explain is how to use our higher timeframe analysis to capitalise in a short-term to intraday session. We use D1 and H4 for the purposes of our analysis, but we execute trades on one of the intraday TFs, m5, m15 even m30. There is too much information and lots of clues on m15 charts, we cannot neglect them!
As far as stops go, work on getting direction right, look at the entries I've shown. Try using a 20-25 pip stop at first, with some practice, you'll narrow your stop down to as much as 7-8 pips. The beauty of this system is that at one point, you start expecting what to see and moments later see it unfold. We can predict price action with the right knowledge and some practice
Thx for the good feed-back. Beeing able to work with stops of 7 to 8 pips would really require a good mastering of S&D. But it is also my aim. What are you looking at today? I have a supply zone marked out on the NZD/USD 30 min chart: http://prnt.sc/cq16mg On the EUR AUD I see a supply zone on the 1H, start marked by Turquoise line: http://prntscr.com/cq1b9b On the EUR CHF I took a short, too early it seems, because the candle will not close as a bearish engulfing: http://prntscr.com/cq1bxd Another one that looks...
Ignored
You're welcome for the feedback. It's nice that you are training your eyes to spot areas of supply and demand. Keep it up, and it will become second nature to you.
However, don't forget that we don't just buy or sell when price gets near or inside an area of liquidity. We have to put as many odds as we can behind us, time our entry neatly, place a tight stop and reach high R:R. We start by denoting areas of sup/dem. We look for historical highs and lows that may affect in some way our bias. We look at recent price action, and by that I don't mean price action candles. The truth is PA candles on their own don't work. You can have a bearish engulfing candle and a rally within the following 2 candles. They can be a trigger to enter a position, but honestly, when we're done here, you won't need it.
What we're trying to learn here is that no matter what "system" we trade, markets will always be the same. Systems, in the forexfactory sense, are synonymous to "signals", what signal we use to enter our trades is not at all important. What we want is to be able to tell where price is and where it's trying to go. We want to acquire the practice and training to know when we can enter a trade and when we'll end up losing if we do.
All of that can only be done by building a proper background, using all the tools mentioned in the first post, on a higher timeframe no smaller than H4. Daily charts is where it all happens, and by that I mean where "macrotrends" are formed. The people in charge of creating trends and making price move do not care about lower timeframe noise. However we think of lower timeframes as "broken down price action", as if we zoom in to see better what goes on during the day. That way we may get a better entry on our trades, on an intraday basis... And tight stops, don't forget the tight stops
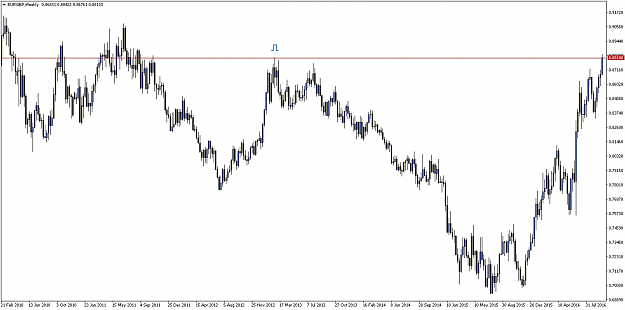
The problem with EURGBP is that its main driver right now is GBP weakness. Cable is making record lows, and we're not sure when it will stop. We can only guess psych levels like 1.2750 or 1.2700 will hold it. It's a matter of pricing brexit in.
If we go to a weekly chart, where we can see price action at those levels clearly, EURGBP is tackling the 0.8810 highs from february 2013. There are strong chances it rallies above those highs, reaching into an area of liquidty around 80 pips higher. Even then, there's no guarantee it will stop because of the aforementioned cable weakness. Throw in a "Draghi bomb" about tapering QE sooner and it will shoot up to the 2011 highs at 0.90.
So 1) it's not a pair I'd risk exposure on 2) even if I would it would be after I've seen confirmation of an exhausted rally (consolidation, new accumulation) 3) I would only hope to see very shortlived declines => it is safer to buy the dips.
Once again, trends are built on higher timeframe charts - H4, daily, weekly and monthly.
{quote} The problem with EURGBP is that its main driver right now is GBP weakness. Cable is making record lows, and we're not sure when it will stop. We can only guess psych levels like 1.2750 or 1.2700 will hold it. It's a matter of pricing brexit in. If we go to a weekly chart, where we can see price action at those levels clearly, EURGBP is tackling the 0.8810 highs from february 2013. There are strong chances it rallies above those highs, reaching into an area of liquidty around 80 pips higher. Even then, there's no guarantee it will stop because...
{quote} The problem with EURGBP is that its main driver right now is GBP weakness. Cable is making record lows, and we're not sure when it will stop. We can only guess psych levels like 1.2750 or 1.2700 will hold it. It's a matter of pricing brexit in. If we go to a weekly chart, where we can see price action at those levels clearly, EURGBP is tackling the 0.8810 highs from february 2013. There are strong chances it rallies above those highs, reaching into an area of liquidty around 80 pips higher. Even then, there's no guarantee it will stop because...
Ignored
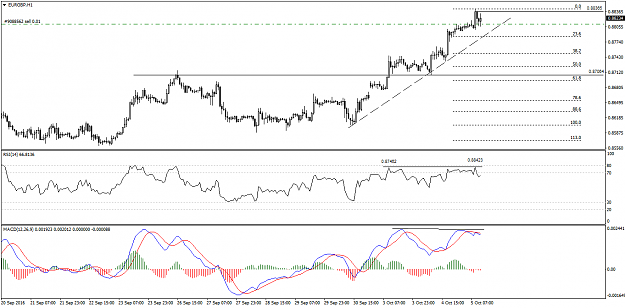
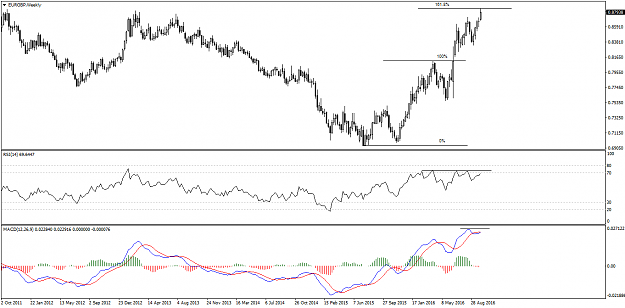
True, shorting the EURGBP makes me nervous, closed short for +21 pips, but looking at the week chart:
1. Fib 161.8
2. RSI divergence + MACD divergence
Hello Wdays, it is very true I tend to watch for a level/zone and step in without consideration for whats happening with the pair...shoot in all directions and take a lot of lesser quality trades. I need to improve
Below a GBP JPY short opportunity with good RR and with overal trend, this is a 1H chart, but the supply zone was marked on a 4H chart, the turquise line marks the beginning of the 1H supply zone.
Downsides on this trade: we are entering asian trading hours and the zone was tested twice before...
I want a retrace back into my fib retracement, or I'm not getting in it
I am short on usdcad, though. Don't look at too many pairs or else you risk becoming overwhelmed. {quote} I mean reversed the rally and dropped.
Ignored