Thanks for the great info in this thread and for all your efforts.
I have a question regarding how to draw supply and demand zones. You have shown in one chart of the first page that these zones should be drawn along the last opposite candle of a reversal. Later I see you draw them from close to high (demand) and in page 5 from wick (low) to open (supply). Please could you clarify?
{quote} Hey I'm Alex. It's possible, a lot of people trade the core of what I do, but you'll find this method is different in a lot of ways. Like for instance, our ability to predict future PA To answer your questions, I will refer you back to my first post. We start by marking out areas of interest on our charts. Starting with the historical levels, because they are the easiest to spot. Have a look at any daily chart, and note the key reversal points (levels, at which price stopped in its tracks and turned the other...
Ignored
Firstly, I wanted to thank you for your time to explain that, I must say thats a real essey... so the real SR must be on daily chart for the start. How far do you search for such level in the past?
Regarding test of that highest/lowest candle before move. I understand your meaning the firstly you wait for candle to test that level. Which is the signal ? the candle wick touch and didnt close above or...?
Thank you again in advance Alex, nice to know you I am Mike
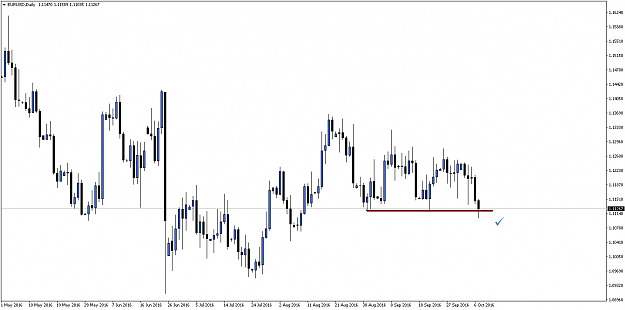
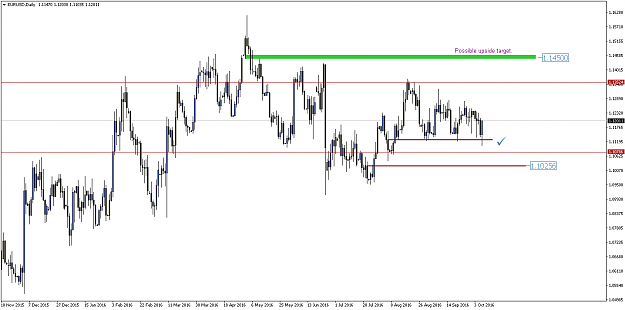
Looking at a daily EU chart, 1.1150 was tested. It's an important level because it doubles as a psych number and demand. I would rather not take any longs today, because any rally would be shortlived. {image}
Ignored
Remember what we said about those clean daily lows?
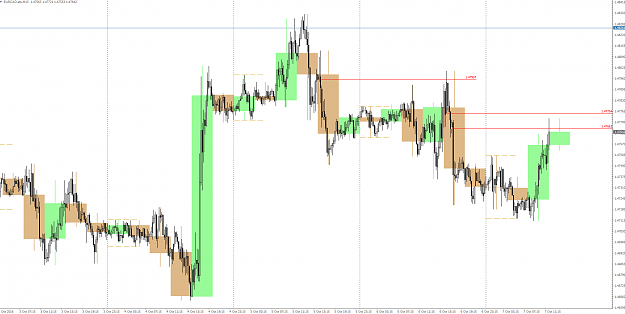
{quote} Perfect! You're getting the hangs of it ) Just one thing, that area you marked as supply on your H4 chart is not necessarily supply. This is what it should look like. And be careful, on USDCAD supply levels come from a daily chart on two occasions. What's more, CAD is very much correlated with Oil. So often times you'll see it behaving in a more specific way in terms of breaking out, because of that correlation. {image} {image}
Ignored
One last thing about this trade, I looked indeed at the correlation between Oil and USD CAD, USD CAD was rallying while oil was up strong on the day, normally the correlation works the other way, so I was thinking if OIL goes up this is positive for CAD and USD CAD should go down, meaning the forces after the USD CAD bull rally were very strong...
Could you explain on higher time frames how you spot your supply and demand zones? It seems there are different ways to do it...I took my method from the following site http://www.forexmentoronline.com/the...trading-guide/, this is someone that was taught by Sam Seiden, so I think this is more the Sam Seiden way of doing it (although I never went on his website)
It would be great to have some more examples from your charts to learn your way of spotting supply and demand, many thanks.
+60 for the day over two positions, it's as simple as that. So far, we've seen two types of entries. First one was the entry during consolidation with a bias based on sound analysis of the market. The second one was in a more dynamic market environment, when there is increased volatility, and consolidations don't last as long, where price will most often dip back into an area of supply or demand before resuming on its way. A few more left, hopefully we will see examples in the near future. {image}
Ignored
Was this EUR/USD trade the one you opened yesterday?
Hi Alex, Thanks for the great info in this thread and for all your efforts. I have a question regarding how to draw supply and demand zones. You have shown in one chart of the first page that these zones should be drawn along the last opposite candle of a reversal. Later I see you draw them from close to high (demand) and in page 5 from wick (low) to open (supply). Please could you clarify? Mostafa
Ignored
I started off drawing everybody's attention to the last candle of opposite color before a rally or decline, which is a good start. We want as much precision as possible, so I am now narrowing down the sensitive area to the wick to body zone of that same candle. 99% of the time it will be the body, but there will be occasions where price will just tag the wick and turn around. It will eventually drop back down to the body, though. When we are in a trade, since we want to preserve our profits, we will target whatever comes first as a possible sup/dem area, so the wick. That way we can't mess up and miss taking profit.
{quote} Firstly, I wanted to thank you for your time to explain that, I must say thats a real essey... so the real SR must be on daily chart for the start. How far do you search for such level in the past? Regarding test of that highest/lowest candle before move. I understand your meaning the firstly you wait for candle to test that level. Which is the signal ? the candle wick touch and didnt close above or...? Thank you again in advance Alex, nice to know you I am Mike
Ignored
There are SR on every single tf. We will, on occasion use an hourly KSR. The idea is to just note the levels that stick out.
As far as entries go, I will usually enter on the touch of a level, so no candlestick confirmation at all. It's the level that counts!
Hallo Alex,
a very good thread. I've worked through the tutorial videos of ICT, they're good, but for me it was hard to extract the really important informations. They are usually very long and detailed. I thank you for your work here. I will follow your contributions to my great interest.
{quote} I started off drawing everybody's attention to the last candle of opposite color before a rally or decline, which is a good start. We want as much precision as possible, so I am now narrowing down the sensitive area to the wick to body zone of that same candle. 99% of the time it will be the body, but there will be occasions where price will just tag the wick and turn around. It will eventually drop back down to the body, though. When we are in a trade, since we want to preserve our profits, we will target whatever comes first as a possible...
Ignored
Am I right?
Attached Image (click to enlarge)
It is EURCAD different pair but the idea should be same (now blowed out up)
Since there are US payrolls in about an hour, we don't want to have any exposure going. Sometimes we can use NFP as a driver for our positions, but most of the time it's a gamble.
I STRONGLY ADVISE WE STAY FLAT DURING THE PAYROLLS.
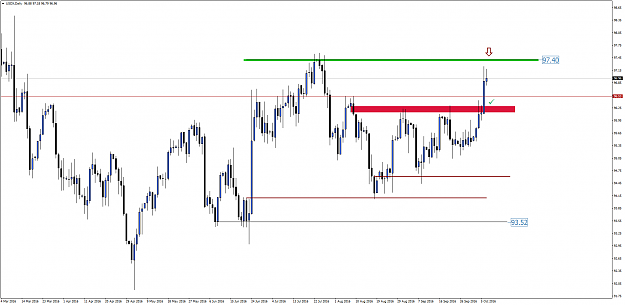
However, since the dollar is rallying, I will suppose that it is reaching for the 97.40 range completion. On euro, this relates as 1.1080. My "bet" is, NFPs will bring the euro down to 1.1080... Please, do not consider this as trading advice, do not enter any EU shorts based on this. It is simply for fun.
I will also narrow it down and say it will whipsaw into a quick jab to 1.1150 before it goes down.
I started off drawing everybody's attention to the last candle of opposite color before a rally or decline, which is a good start. We want as much precision as possible, so I am now narrowing down the sensitive area to the wick to body zone of that same candle. 99% of the time it will be the body, but there will be occasions where price will just tag the wick and turn around. It will eventually drop back down to the body, though. When we are in a trade, since we want to preserve our profits, we will target whatever comes first as a possible sup/dem...
{quote} So you would enter blindly at such level at the point? or wait there and see the PA?
Ignored
Yes, sometimes I'll use limit orders, sometimes I'll just wait for price to reach these levels and act on market price. I don't have any specific signal to tell me to buy or sell. Don't really need one, when you're picking highs and lows.
Hi I've been trading just a few months now, and I think your system is how I've basically been approaching trading, though I haven't been able to clarify it as clearly. Nonetheless I'd appreciate you reviewing my analysis to see if I'm interpreting the price action according to your system.
1. Lower supply area identified as 93.00-93.48
2. Upper demand area identified as 96.90-97.54
3. Price making higher lows and just broke through a resistance line. Bullish bias
4. Fib retracement between 93.00 and 97.54 drawn. Noteworthy price between 78.6% and 61% is 96.25.
So I'm expecting the US Dollar Price is to fall slightly before rebounding up.
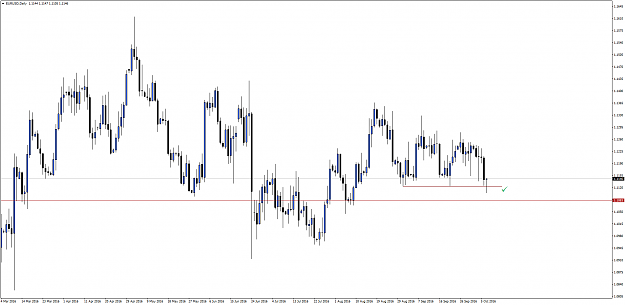
So my bias on the EURUSD is bullish. From the daily chart of the EURUSD:
1. Lower supply zone identified as 1.0950-1.1143
2. Upper demand zone identified as 1.1283-1.1362
3. Price been forming lower highs while bouncing off a resistance line, suggesting bearish trend
4. Fib retracement between 1.0950 and 1.1362 drawn. Noteworthy price between 78.6% and 61% is 1.1215.
So I'm expected the EURUSD to rise before continuing downwards
My Trade plan for next week Pair: EURUSD Entry: 1.1215 Stop: 1.1235 Limit:1. 1185
Hi I've been trading just a few months now, and I think your system is how I've basically been approaching trading, though I haven't been able to clarify it as clearly. Nonetheless I'd appreciate you reviewing my analysis to see if I'm interpreting the price action according to your system. Starting with a daily chart of the dollar index https://www.tradingview.com/x/BGfpqp7u/ 1. Lower supply area identified as 93.00-93.48 2. Upper demand area identified as 96.90-97.54 3. Price making higher lows and just broke through a resistance line....
Ignored
Good job on the thorough analysis! )
I explained in a previous post why EU made a lower low. I was expecting it to drop straight down to 1.1080, but it seems there's still some bullishness. What's more, those payroll numbers surprised me, since I was expecting better results pre-election.
USDx and EU found supply and demand respectively inside an H4 area, never reached the top /bottom/ of the range. I agree with you, that the rally would be rather short and sweet, and price would resume its downtrend.
As for the entry, it's nice to have a trade idea built during the weekend, however a lot can change between sunday open and Tuesday open.
On a higher Time frame I see the ranges getting smaller, at some point it will break out of the wedge that is forming. I would also be carefull with short because on the daily you can see a big bullish candle from support.