- Silver prices extend recovery to reach levels beyond $19.00.
- The US dollar dives on Fed easing speculation.
- XAG/USD is now at a key resistance area of $19.30.
Silver prices have extended Thursday’s rebound from $18.30 lows on Friday, breaking beyond $19.00 and reaching one-week highs at $19.30 so far. The precious metal appreciates more than 3% on the day, retracing half of the ground lost on the previous week’s sell-off.
Precious metals appreciate against a softer USD
A news report by the Wall Street Journal has suggested Federal Reserve officials are open to debate on how to signal a smaller rate hike in December. This has offset the positive impact of the bank’s representative’s hawkish rhetoric and sent the US dollar tumbling across the board.
Furthermore, an alleged intervention by the Bank of Japan and the Japanese Finance Ministry has sent the yen surging across the board. The USD/JPY plunged more than 2.5%, as a consequence, and weighed the US dollar across the board.
XAG/USD pushing against key resistance at $19.30
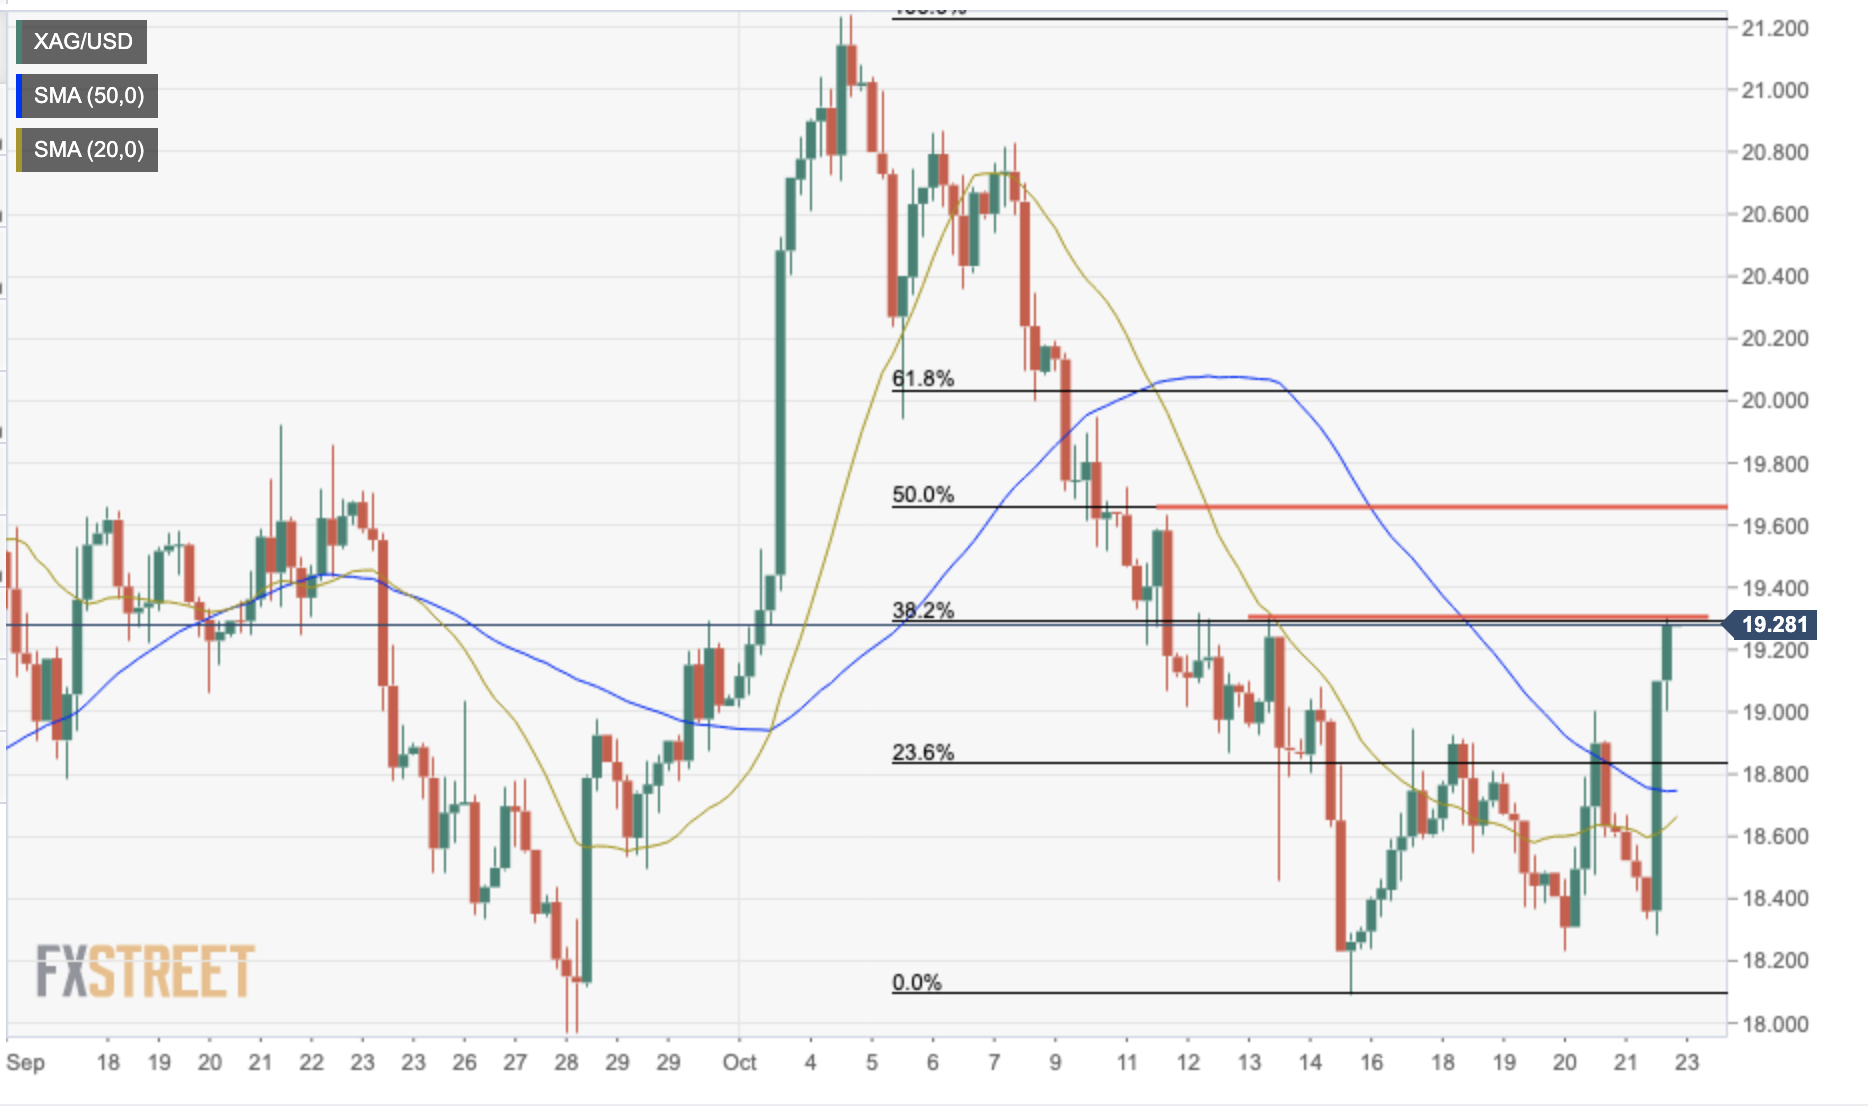
From a technical perspective, the pair is now testing the resistance area at $19.30 (Oct. 13 high and the 38.7% Fib. Retracement of the October 4-10 decline). Above here, the next potential targets are $19.65 (50% retracement and Oct. 11 high) and the $20.00 level.
On the downside, below the $19.00 previous resistance area, the next potential targets could be the 20-period SMA in the 4-hour chart, now at $18.60, and October 14 low at $18.08.
XAG/USD 4-hour chart
Technical levels to watch
Information on these pages contains forward-looking statements that involve risks and uncertainties. Markets and instruments profiled on this page are for informational purposes only and should not in any way come across as a recommendation to buy or sell in these assets. You should do your own thorough research before making any investment decisions. FXStreet does not in any way guarantee that this information is free from mistakes, errors, or material misstatements. It also does not guarantee that this information is of a timely nature. Investing in Open Markets involves a great deal of risk, including the loss of all or a portion of your investment, as well as emotional distress. All risks, losses and costs associated with investing, including total loss of principal, are your responsibility. The views and opinions expressed in this article are those of the authors and do not necessarily reflect the official policy or position of FXStreet nor its advertisers. The author will not be held responsible for information that is found at the end of links posted on this page.
If not otherwise explicitly mentioned in the body of the article, at the time of writing, the author has no position in any stock mentioned in this article and no business relationship with any company mentioned. The author has not received compensation for writing this article, other than from FXStreet.
FXStreet and the author do not provide personalized recommendations. The author makes no representations as to the accuracy, completeness, or suitability of this information. FXStreet and the author will not be liable for any errors, omissions or any losses, injuries or damages arising from this information and its display or use. Errors and omissions excepted.
The author and FXStreet are not registered investment advisors and nothing in this article is intended to be investment advice.
Recommended content
Editors’ Picks
EUR/USD retreats toward 1.0850 on modest USD recovery

EUR/USD stays under modest bearish pressure and trades in negative territory at around 1.0850 after closing modestly lower on Thursday. In the absence of macroeconomic data releases, investors will continue to pay close attention to comments from Federal Reserve officials.
GBP/USD holds above 1.2650 following earlier decline

GBP/USD edges higher after falling to a daily low below 1.2650 in the European session on Friday. The US Dollar holds its ground following the selloff seen after April inflation data and makes it difficult for the pair to extend its rebound. Fed policymakers are scheduled to speak later in the day.
Gold climbs to multi-week highs above $2,400

Gold gathered bullish momentum and touched its highest level in nearly a month above $2,400. Although the benchmark 10-year US yield holds steady at around 4.4%, the cautious market stance supports XAU/USD heading into the weekend.
Chainlink social dominance hits six-month peak as LINK extends gains
-637336005550289133_XtraSmall.jpg)
Chainlink (LINK) social dominance increased sharply on Friday, exceeding levels seen in the past six months, along with the token’s price rally that started on Wednesday.
Week ahead: Flash PMIs, UK and Japan CPIs in focus – RBNZ to hold rates

After cool US CPI, attention shifts to UK and Japanese inflation. Flash PMIs will be watched too amid signs of a rebound in Europe. Fed to stay in the spotlight as plethora of speakers, minutes on tap.