
Golden days ahead: Silver and copper to soar alongside Saxo's positive outlook for metals
Fri 17 May 24, 11:07am (AEST)

Bad news mortgage holders – just when you thought interest rate hikes were out, we’ve all been pulled back into the possibility of one more.
The culprit was the worse than expected March CPI data released last week which showed Australian consumer prices rose at 3.8% year-over-year based upon the RBA’s preferred trimmed mean measure. It was a decline from the December quarter’s 4.1% year-over-year print, but it was well above economists’ forecast of 3.6%.
The reaction from participants in the interest rate futures market has been swift. They’re now pricing in a 40% chance the RBA will hike its official cash rate by November. Yes, the dreaded “hike” word, not spoken about for many months now, has reared its ugly head again!
Up until the March CPI data, the general consensus among investors was the next move in Australian interest rates would be down. It still could be. After all, a 40% probability of a hike is hardly what you’d call a lock. But even if the next move is down, market pricing has shifted the timing of the first rate cut well into the future, and this means the strain on Aussie households isn’t about to let up.
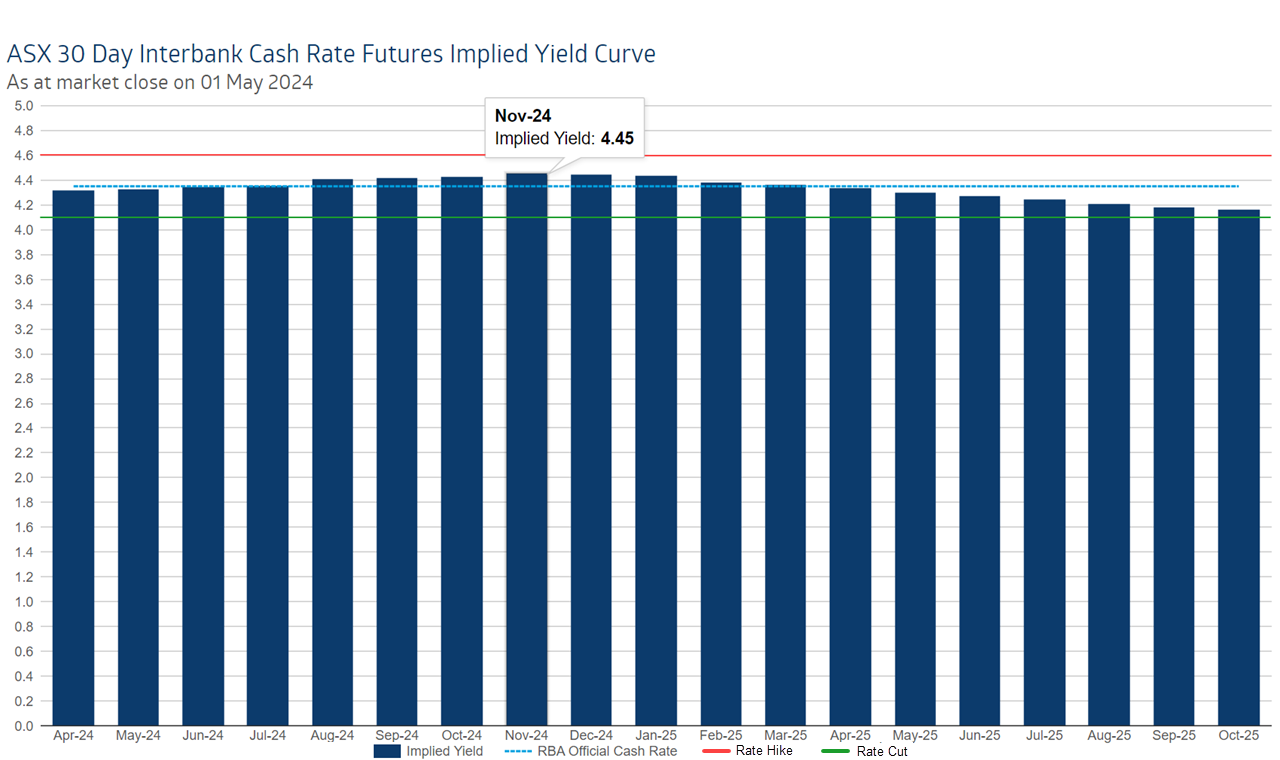
The above illustration shows the ASX 30 Day Interbank Cash Rate Futures Implied Yield Curve, or just RBA yield curve, for short. It represents the market’s prediction of where the RBA’s cash rate is going to be at each month based upon the pricing of interest rate futures.
Keep in mind when looking at this table and the ones below, that the current RBA cash rate is 4.35%. Note in the RBA yield curve above, the peak in the cash rate is 4.45% in November, i.e., 0.10% above its current level. To calculate the probability of a 0.25% hike by November, we simply divide 0.10% by 0.25%, which is 40%.
If the dark blue bars touch 4.60%, i.e., 4.35% plus 0.25%, you’ve got yourself a full interest rate hike. Fortunately, this isn’t indicated in the RBA yield curve, with the bars steadily dropping from November’s peak to a low of 4.16% by October 2025.
Doing the maths, here are the key observations from the RBA implied yield curve:
April 2025 is the first month where the market begins to price in a rate cut (i.e., its blue bar is the first to dip below 4.35%)
The first rate cut only becomes a better than a 50-50 proposition from August 2025 (i.e., a blue bar 0.125% or more below 4.35%)
No month in the look-forward period displayed has 100% rate cut probability (i.e., a blue bar 0.25% or move below 4.35%)
In the last bar, October 2025 (4.16% implied yield), indicates a 76% chance of a cut by that month
In short, a rate cut in 2024 appears an impossibility at this stage. To get an idea of just how much the interest rate outlook has changed after last week’s CPI data, take a look at the RBA yield curve from the day before its release on April 23, shown below.
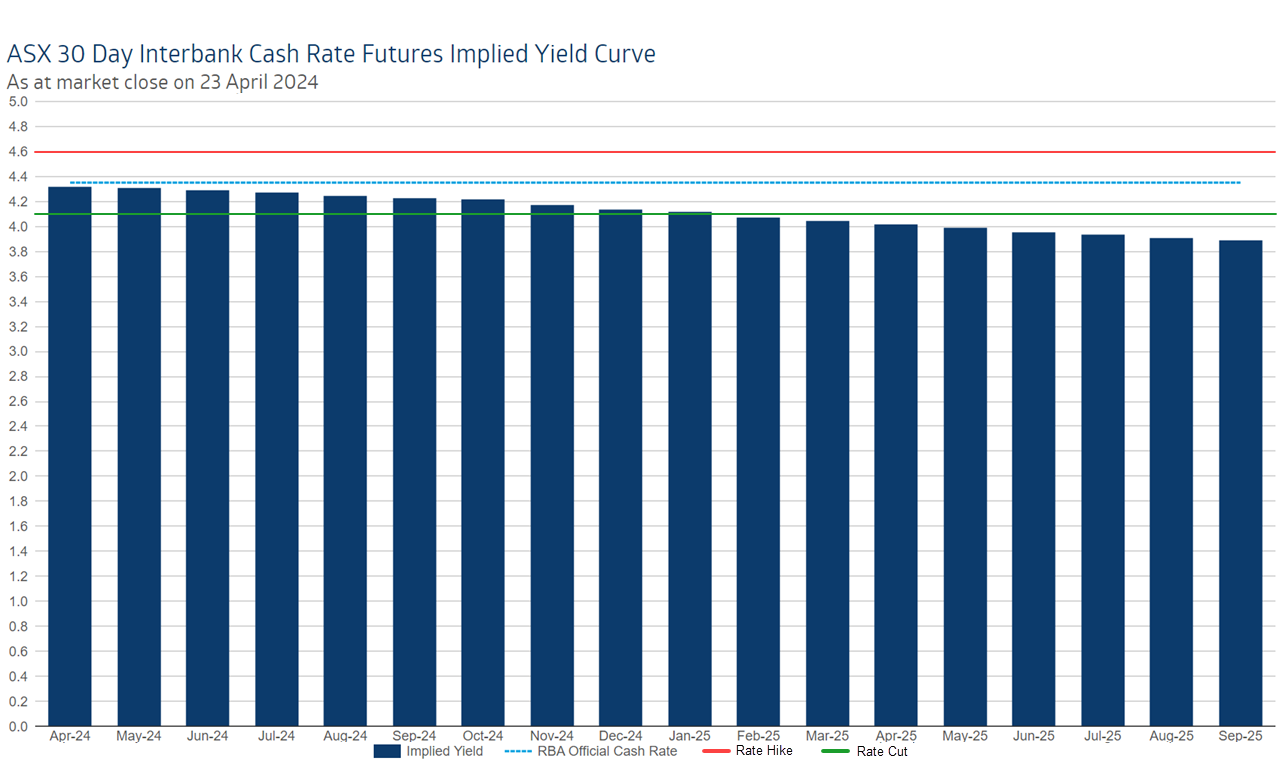
Firstly, you’ll notice that none of the blue bars are above the current 4.35% cash rate level. This means an interest rate cut is a possibility in the entire sample. Also note, it’s a better than 50-50 chance from September, and it’s a lock from February 2025. The table below summarises the changes to the RBA yield curve before and after the CPI shock.
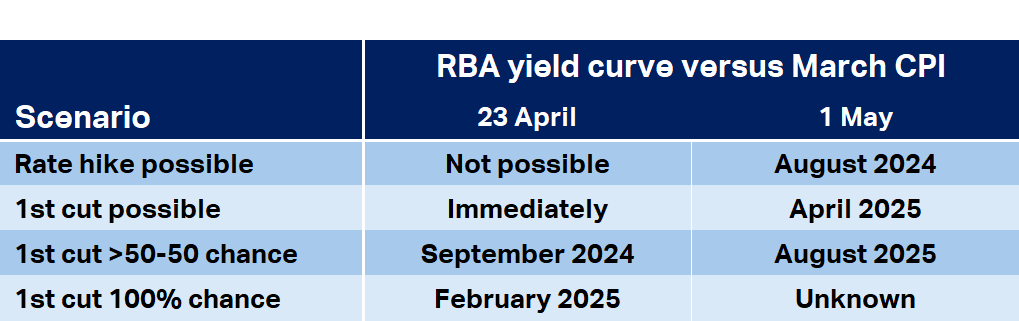
There’s plenty of the rationale behind why Australian stocks have had such a tough time over the last couple of weeks in this table. It’s all about interest rates. To be fair, it usually is!
The situation in the USA was heading in the same direction – i.e., rate cuts were getting pushed into the future and the prospect of rate hikes (however miniscule as you’ll see below), were being put back on the table.
Fortunately for investors there, and by extension here, the situation has moderated somewhat after Wednesday's FOMC meeting. As anticipated, the Federal Reserve voted to leave the official cash rate unchanged at 5.25%-5.50%. Market sentiment was aided, however, by comments made by Federal Reserve Chairman Jerome Powell.
In his post meeting press conference, Mr. Powell noted it may take longer than previously expected for the Fed to achieve sufficient confidence inflation is falling fast enough towards its 2% target, therefore allowing it to begin cutting rates. "I don't know how long it will take", he remarked, noting it might not even occur in 2024.
Markets took heart, however, in comments in which Mr. Powell appeared to rule out rate hikes, even if the inflation picture doesn’t improve. Markets hate uncertainty, and this eliminates one important source of it.
Importantly, Powell left the door open for faster action on rates relief should inflation data surprise to the downside or if the labour market weakened significantly. The linking of rate cuts to economic performance appeared to calm investors’ nerves that the Fed is oblivious to what’s happening in the US economy while their fight to tame inflation continues.
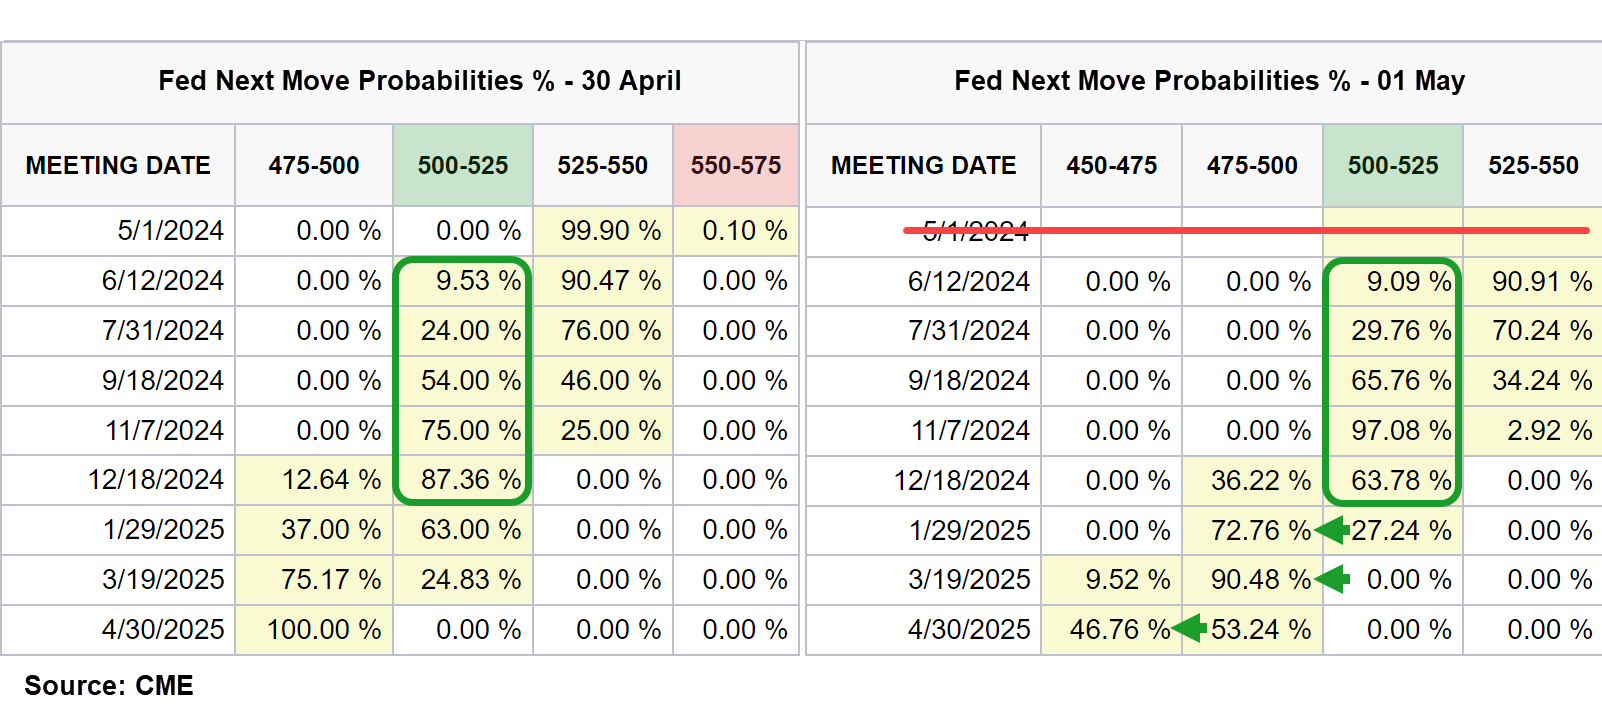
The tables above show how the US implied yield curve has shifted before and after the May FOMC meeting. First cut probabilities (i.e. a move to 5.00%-5.25%) increased modestly across the board, and there were significant improvements in the timing of a second cut – now firming for January.
Get the latest news and insights direct to your inbox