


How much impact have price markups for goods and services had on the recent surge and the subsequent decline of inflation? Since 2021, markups have risen substantially in a few industries such as motor vehicles and petroleum. However, aggregate markups—which are more relevant for overall inflation—have generally remained flat, in line with previous economic recoveries over the past three decades. These patterns suggest that markup fluctuations have not been a main driver of the ups and downs of inflation during the post-pandemic recovery.
In the recovery from the pandemic, U.S. inflation surged to a peak of over 7% in June 2022 and has since declined to 2.7% in March 2024, as measured by the 12-month change in the personal consumption expenditures (PCE) price index. What factors have been driving the ups and downs of inflation? Production costs are traditionally considered a main contributor, particularly costs stemming from fluctuations in demand for and supply of goods and services. As demand for their products rises, companies need to hire more workers and buy more intermediate goods, pushing up production costs. Supply chain disruptions can also push up the cost of production. Firms may pass on all or part of the cost increases to consumers by raising prices. Thus, an important theoretical linkage runs from cost increases to inflation. Likewise, decreases in costs should lead to disinflation.
Labor costs are an important factor of production costs and are often useful for gauging inflationary pressures. However, during the post-pandemic surge in inflation, nominal wages rose more slowly than prices, such that real labor costs were falling until early 2023. By contrast, disruptions to global supply chains pushed up intermediate goods costs, contributing to the surge in inflation (see, for example, Liu and Nguyen 2023). However, supply chains have more direct impacts on goods inflation than on services inflation, which also rose substantially.
In this Economic Letter, we consider another factor that might drive inflation fluctuations: changes in firms’ pricing power and markups. An increase in pricing power would be reflected in price-cost markups, leading to higher inflation; likewise, a decline in pricing power and markups could alleviate inflation pressures. We use industry-level measures of markups to trace their evolving impact on inflation during the current expansion. We find that markups rose substantially in some sectors, such as the motor vehicles industry. However, the aggregate markup across all sectors of the economy, which is more relevant for inflation, has stayed essentially flat during the post-pandemic recovery. This is broadly in line with patterns during previous business cycle recoveries. Overall, our analysis suggests that fluctuations in markups were not a main driver of the post-pandemic surge in inflation, nor of the recent disinflation that started in mid-2022.
Potential drivers of inflation: Production costs and markups
To support households and businesses during the pandemic, the Federal Reserve lowered the federal funds rate target to essentially zero, and the federal government provided large fiscal transfers and increased unemployment benefits. These policies boosted demand for goods and services, especially as the economy recovered from the depth of the pandemic.
The increase in overall demand, combined with supply shortages, boosted the costs of production, contributing to the surge in inflation during the post-pandemic recovery. Although labor costs account for a large part of firms’ total production costs, real labor costs were falling between early 2021 and mid-2022 such that the increases in prices outpaced those in nominal wages. This makes it unlikely that labor costs were driving the surge in inflation.
Instead, we focus on another potential alternative driver of inflation that resulted from firms’ ability to adjust prices, known as pricing power. As demand for goods surged early in the post-pandemic recovery, companies may have had a greater ability to raise their prices above their production costs, a gap known as markups. Following a sharp drop in spending at the height of the pandemic, people may have become eager to resume normal spending patterns and hence more tolerant to price increases than in the past. In fact, growth of nonfinancial corporate profits accelerated in the early part of the recovery (see Figure 1), suggesting that companies had increased pricing power. Some studies have pointed to the strong growth in nonfinancial corporate profits in 2021 as evidence that increased markups have contributed to inflation (see, for example, Weber and Wasmer 2023). However, the figure also shows that growth in corporate profits is typically volatile. Corporate profits tend to rise in the early stages of economic recoveries. Data for the current recovery show that the increase in corporate profits is not particularly pronounced compared with previous recoveries.
Figure 1
Profit growth for nonfinancial businesses
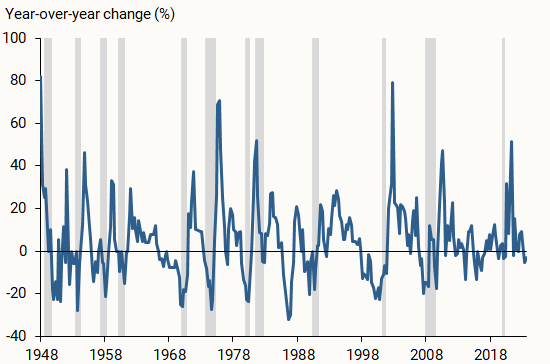
Source: Bureau of Economic Analysis
More importantly, corporate profits are an imperfect measure of a firm’s pricing power because several other factors can drive changes in profitability. For instance, much of the recent rise in corporate profits can be attributed to lower business taxes and higher subsidies from pandemic-related government support, as well as lower net interest payments due to monetary policy accommodation (Pallazzo 2023).
Instead of relying on profits as a measure of pricing power, we construct direct measures of markups based on standard economic models. Theory suggests that companies set prices as a markup over variable production costs, and that markup can be inferred from the share of a firm’s revenue spent on a given variable production factor, such as labor or intermediate goods. Over the period of data we use, we assume that the specific proportion of a company’s production costs going toward inputs does not change. If the share of a firm’s revenue used for inputs falls, it would imply a rise in the firm’s price-cost margin or markup. In our main analysis, we use industry-level data from the Bureau of Economic Analysis (BEA) to compute markups based on the share of revenue spent on intermediate inputs. Our results are similar if we instead use the share of revenue going toward labor costs.
We compare the evolution of markups to that of prices, as measured by the PCE price index, since the recovery from the pandemic. In constructing this price index, the BEA takes into account changes in product characteristics (for instance, size) that could otherwise bias the inflation measure by comparing the prices of inherently different products over time. Similarly, based upon standard economic theory, our markup measure implicitly captures changes in those characteristics (see, for example, Aghion et al. 2023).
The post-pandemic evolution of markups
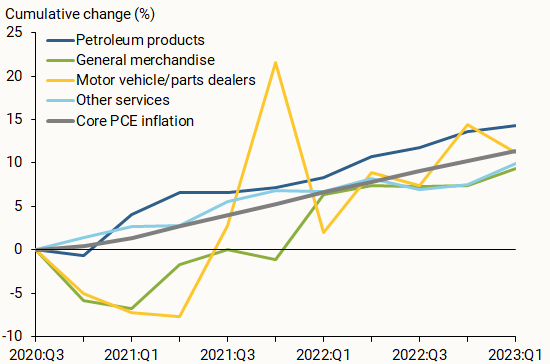
We examine the evolution of markups in each industry since the third quarter of 2020, the start of the post-pandemic recovery. Figure 2 shows that some sectors, such as the motor vehicles and petroleum industries, experienced large cumulative increases in markups during the recovery. Markups also rose substantially in general merchandise, such as department stores, and for other services, such as repair and maintenance, personal care, and laundry services. Since the start of the expansion, markups in those industries rose by over 10%—comparable in size to the cumulative increases over the same period in the core PCE price index, which excludes volatile food and energy components. However, the surge in inflation through June 2022 was broad based, with prices also rising substantially outside of these sectors. Thus, understanding the importance of markups for driving inflation requires a macroeconomic perspective that examines the evolution of aggregate markups across all sectors of the economy.
Figure 2
Cumulative changes in markups for salient industries
The role of aggregate markups in the economy
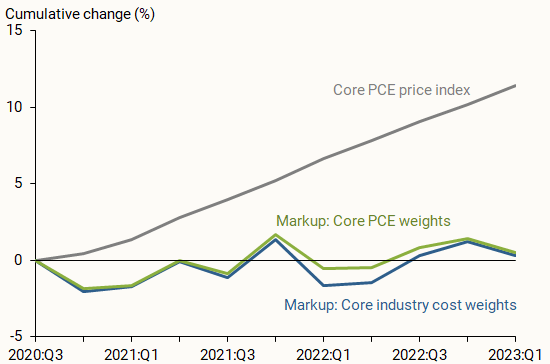
To assess how much markup changes contribute to movements in inflation more broadly, we use our industry-level measurements to calculate an aggregate markup at the macroeconomic level. We aggregate the cumulative changes in industry markups, applying two different weighting methods, as displayed in Figure 3. In the first method (green line), we match our industry categories to the spending categories in the core PCE price index for ease of comparison; we then use the PCE weights for each category to compute the aggregate markup. Alternatively, we use each industry’s cost weights to compute the aggregate markup (blue line). Regardless of the weighting method, Figure 3 shows that aggregate markups have stayed essentially flat since the start of the recovery, while the core PCE price index (gray line) rose by more than 10%. Thus, changes in markups are not likely to be the main driver of inflation during the recovery, which aligns with results from Glover, Mustre-del-Río, and von Ende-Becker (2023) and Hornstein (2023) using different methodologies or data. Markups also have not played much of a role in the slowing of inflation since the summer of 2022.
Figure 3
Cumulative changes in aggregate markups and prices
Moreover, the path of aggregate markups over the past three years is not unusual compared with previous recoveries. Figure 4 shows the cumulative changes in aggregate markups since the start of the current recovery (dark blue line), alongside aggregate markups following the 1991 (green line), 2001 (yellow line), and 2008 (light blue line) recessions. Aggregate markups have stayed roughly constant throughout all four recoveries.
Figure 4
Cumulative changes of aggregate markups in recoveries
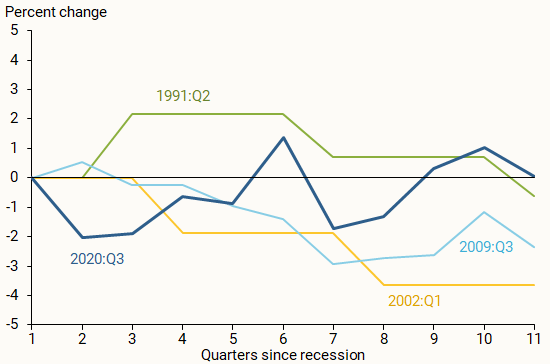
Source: Bureau of Economic Analysis.
Conclusion
Firms’ pricing power may change over time, resulting in markup fluctuations. In this Letter, we examine whether increases in markups played an important role during the inflation surge between early 2021 and mid-2022 and if declines in markups have contributed to disinflation since then. Using industry-level data, we show that markups did rise substantially in a few important sectors, such as motor vehicles and petroleum products. However, aggregate markups—the more relevant measure for overall inflation—have stayed essentially flat since the start of the recovery. As such, rising markups have not been a main driver of the recent surge and subsequent decline in inflation during the current recovery.
References
Aghion, Philippe, Antonin Bergeaud, Timo Boppart, Peter J. Klenow, and Huiyu Li. 2023. “A Theory of Falling Growth and Rising Rents.” Review of Economic Studies 90(6), pp.2,675-2,702.
Glover, Andrew, José Mustre-del-Río, and Alice von Ende-Becker. 2023. “How Much Have Record Corporate Profits Contributed to Recent Inflation?” FRB Kansas City Economic Review 108(1).
Hornstein, Andreas. 2023. “Profits and Inflation in the Time of Covid.” FRB Richmond Economic Brief 23-38 (November).
Liu, Zheng, and Thuy Lan Nguyen. 2023. “Global Supply Chain Pressures and U.S. Inflation.” FRBSF Economic Letter 2023-14 (June 20).
Palazzo, Berardino. 2023. “Corporate Profits in the Aftermath of COVID-19.” FEDS Notes, Federal Reserve Board of Governors, September 8.
Weber, Isabella M. and Evan Wasner. 2023. “Sellers’ Inflation, Profits and Conflict: Why Can Large Firms Hike Prices in an Emergency?” Review of Keynesian Economics 11(2), pp. 183-213.
Opinions expressed in FRBSF Economic Letter do not necessarily reflect the views of the management of the Federal Reserve Bank of San Francisco or of the Board of Governors of the Federal Reserve System. This publication is edited by Anita Todd and Karen Barnes. Permission to reprint portions of articles or whole articles must be obtained in writing. Please send editorial comments and requests for reprint permission to research.library@sf.frb.org