- Search Forex Factory
- 271 Results (1 Threads, 270 Replies)
-
 Almondeyed replied Oct 7, 2019
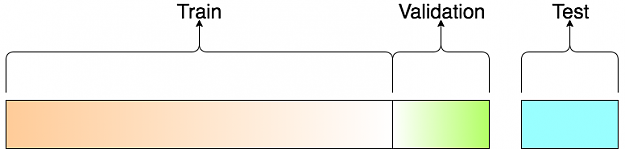
I mean, if you use Neural Network, it divides data in three parts. image Backtest results are not meaningful unless they show the results for "test phase"
Planetary Cycles Trading (EUR/USD)
- Almondeyed replied Jul 6, 2019
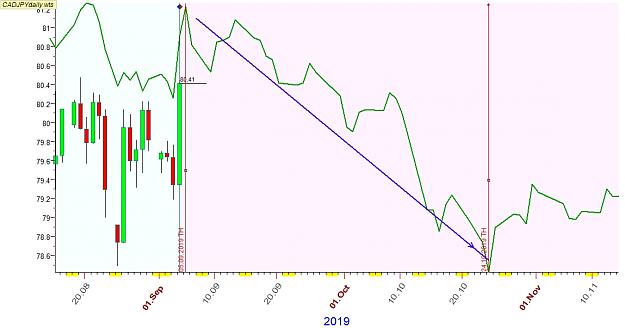
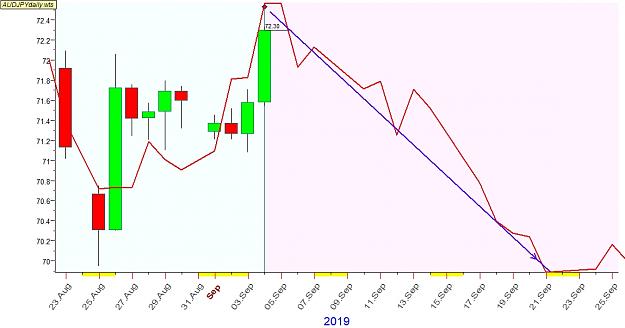
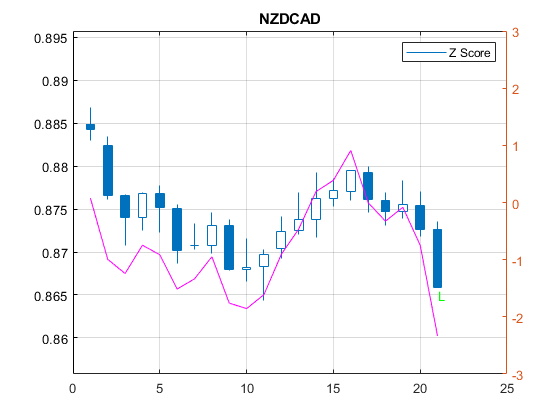
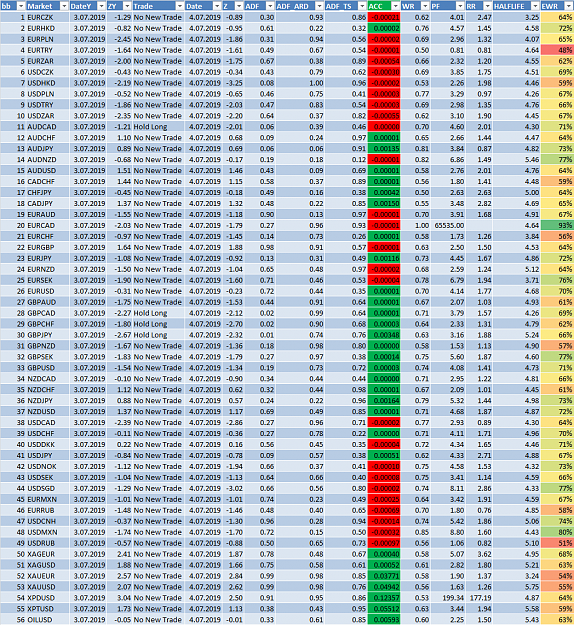
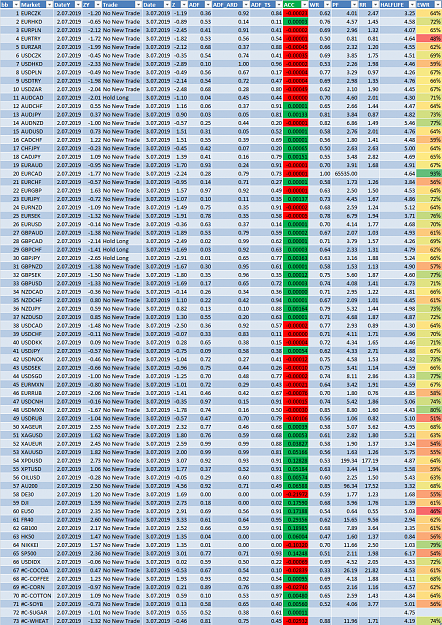
July 08, 2019 Hold Long GBPCAD Long NZDCAD
Forward test of my new mean reversion strategy
- Almondeyed replied Jul 4, 2019
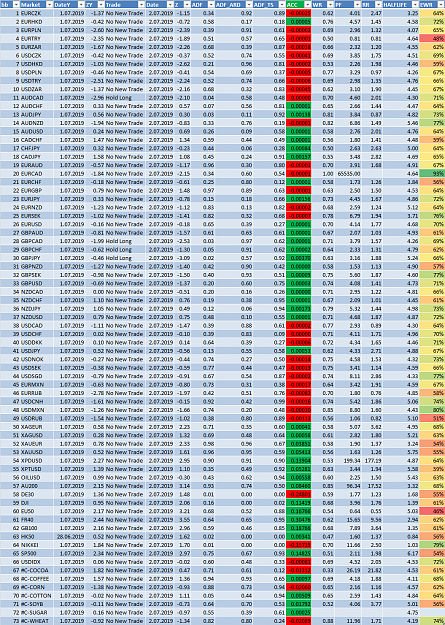
July 05, 2019 Hold Long GBPCAD No new trades
Forward test of my new mean reversion strategy
- Almondeyed replied Jul 4, 2019
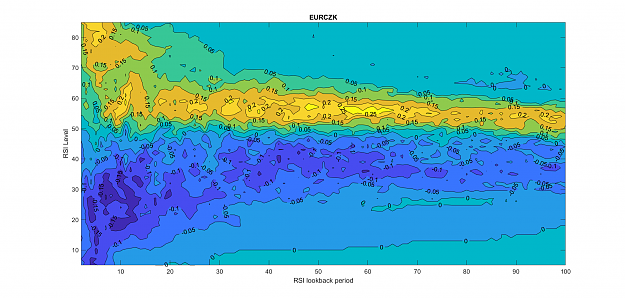
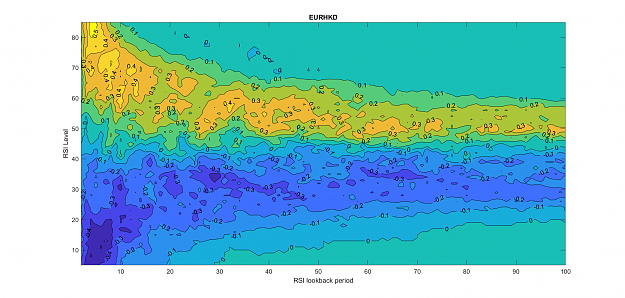
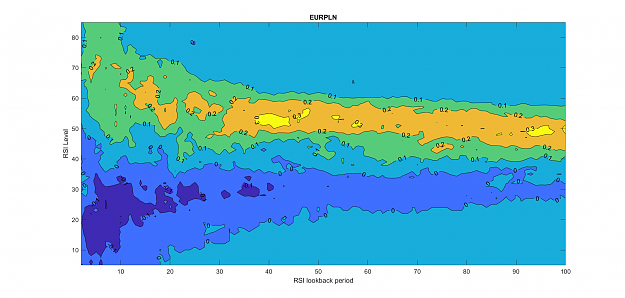
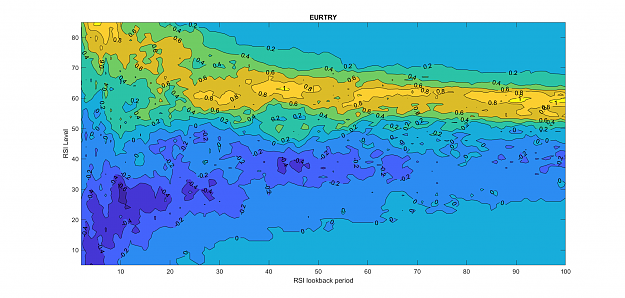
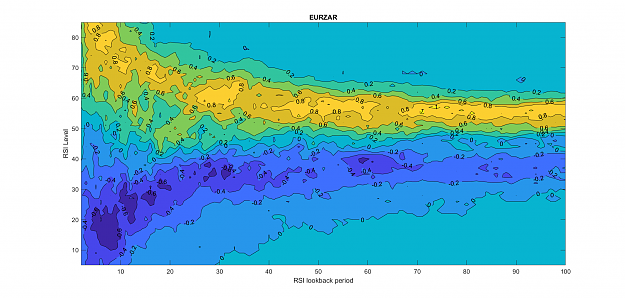
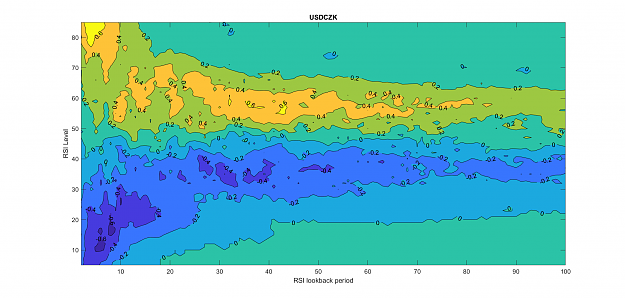
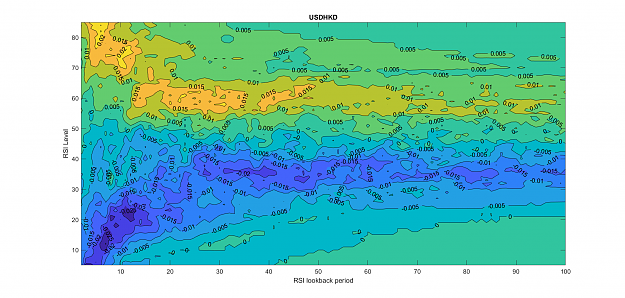
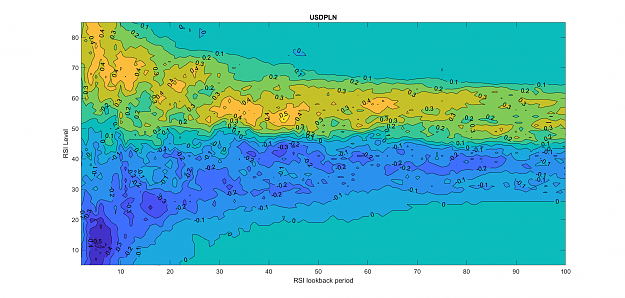
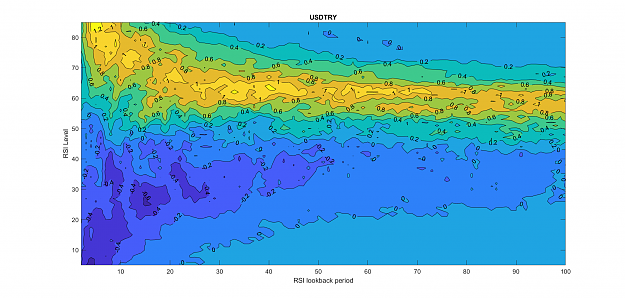
Some test of indicators. Indicator: RSI X Axis: RSI look back period Y Axis: RSI Level- Bottom RSI threshold level. (If RSI Level 10 it means total returns of next 5 days were calculated for RSI is between 10-20) Z Axis: Total t+5 return Data: End ...
Forward test of my new mean reversion strategy
- Almondeyed replied Jul 3, 2019
July 04, 2019 Hold Long GBPCAD Cancel Short NIKKEI --> Data feed error in most CFD markets.. (some unrealistic price values) I have to find another MT4 forex broker with better CFD data feed
Forward test of my new mean reversion strategy No new trades
- Almondeyed replied Jul 2, 2019
July 03, 2019 Hold Long GBPCAD Hold Short NIKKEI No new trades
Forward test of my new mean reversion strategy
- Almondeyed replied Jul 2, 2019
July 02, 2019 Hold Long GBPCAD Short NIKKEI
Forward test of my new mean reversion strategy
- Almondeyed replied Jun 28, 2019
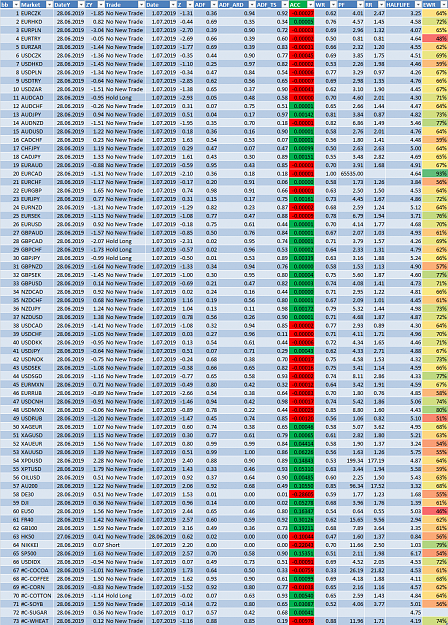
July 01, 2019 Hold Long GBPCAD No New Trades
Forward test of my new mean reversion strategy
- Almondeyed replied Jun 27, 2019
June 28, 2019 Hold Long GBPCAD No New Trades
Forward test of my new mean reversion strategy
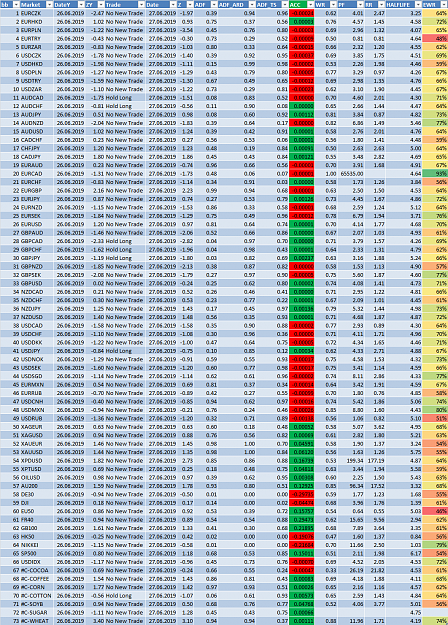
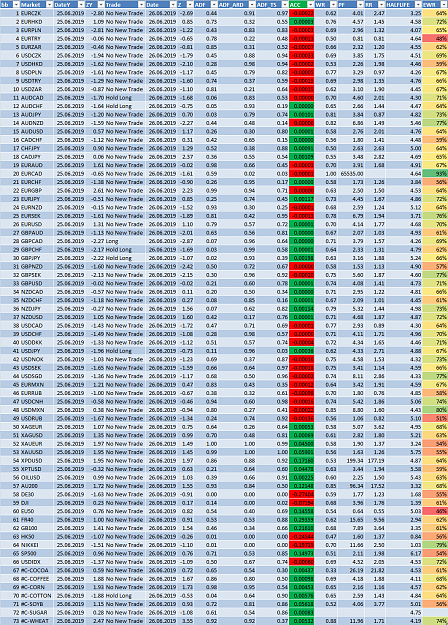
- Almondeyed replied Jun 26, 2019
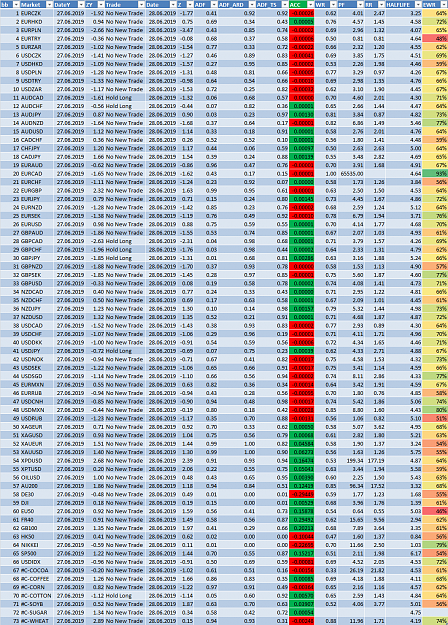
June 27, 2019 Long GBPCAD
Forward test of my new mean reversion strategy
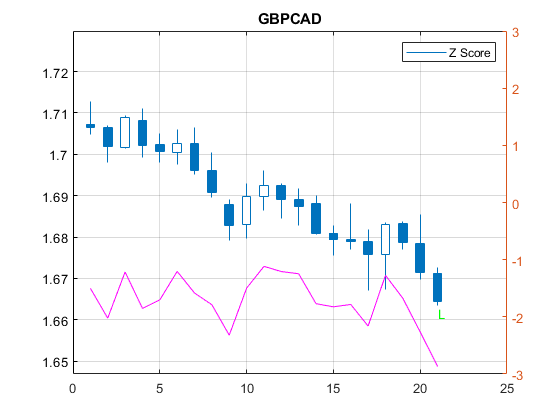
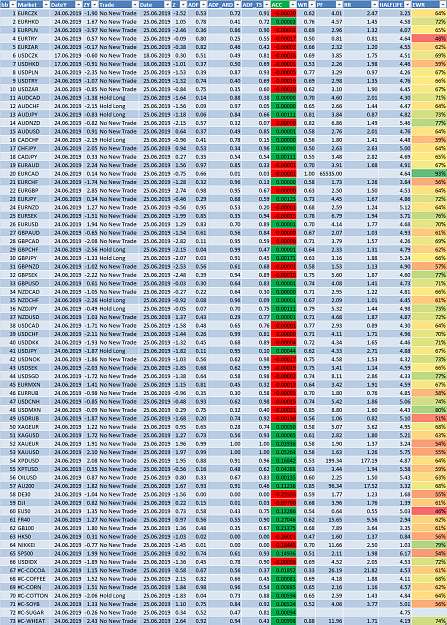
- Almondeyed replied Jun 25, 2019
No new trades for June 26
Forward test of my new mean reversion strategy By the way just noticed that the data was not updated for USDCZK and USDHKD but anyway, it is some late and better to go bad
- Almondeyed replied Aug 25, 2016
Engulfing Pattern Pattern Search: Bearish Engulfing Time Period: 1993 - 2016 (Data is not complete before 1999) Market: GBPUSD Time Frame: 1h Patterns Found: 5571 Average Next Bar Return: 0.33 pips Average 5 Bars Return: 0.75 pips Filters: If ...
My Notes, Observations & Some Trades


- Almondeyed replied Aug 24, 2016
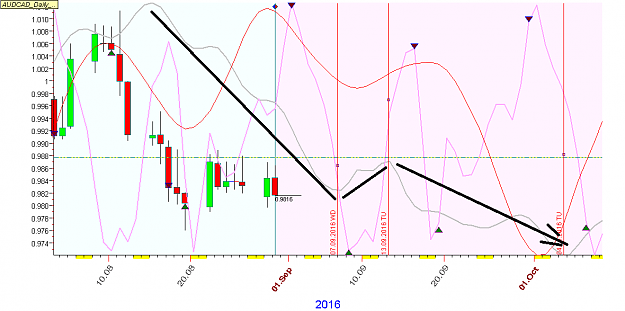
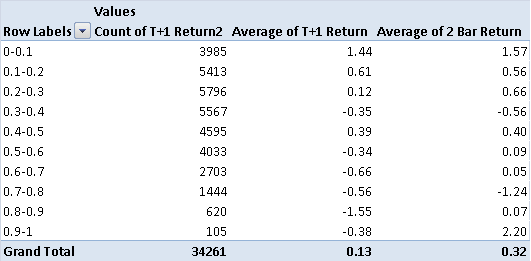
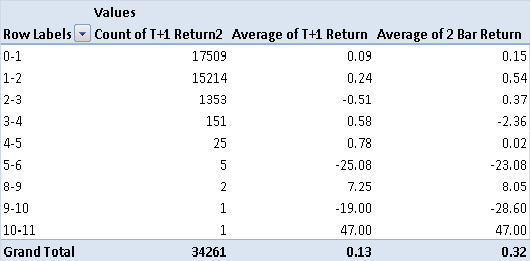
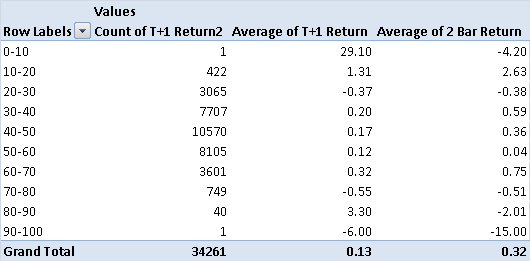
Yesterday I collected some statistics about trend bars. A bullish trend bar is simply a bar which has higher low and higher high with respect to previous bar. Bearish trend bar is just the opposite. After a bullish trend bar I expected to see a 1 or ...
My Notes, Observations & Some Trades

- Almondeyed replied Apr 2, 2016
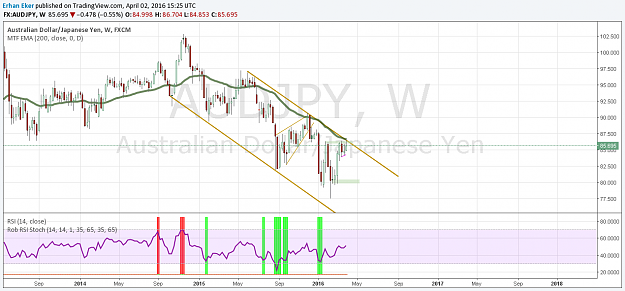
It is very unlikely that will go above the confluence zone around 86.5/87 before printing some weekly red candles as i see. image Jay, do you calculate an exact probability value/range for possible new highs/lows or you use your common sense for ...
Jay's High Probability Setups
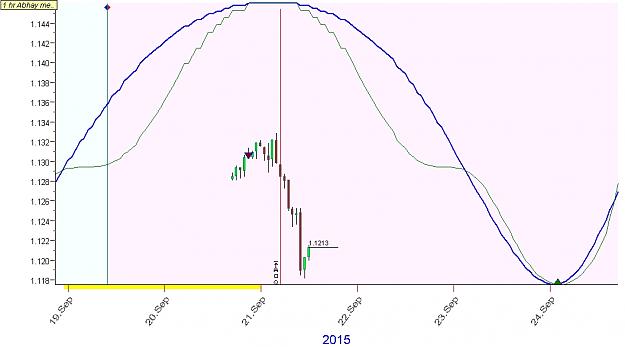
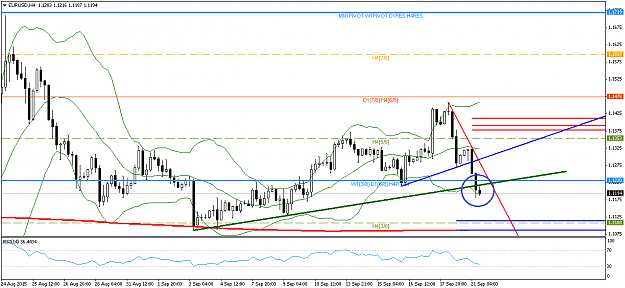
- Almondeyed replied Sep 21, 2015
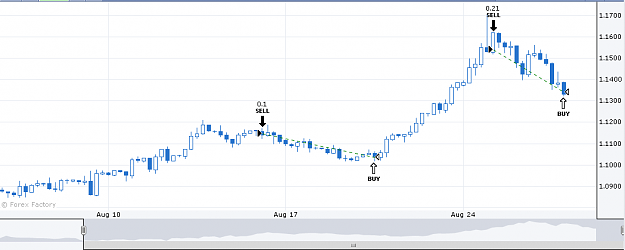
It looks we started new week with an inverted cycle. We have already broken rising TL and seen a pull back. Probably heading 200 D MA. image image
Planetary Cycles Trading (EUR/USD)
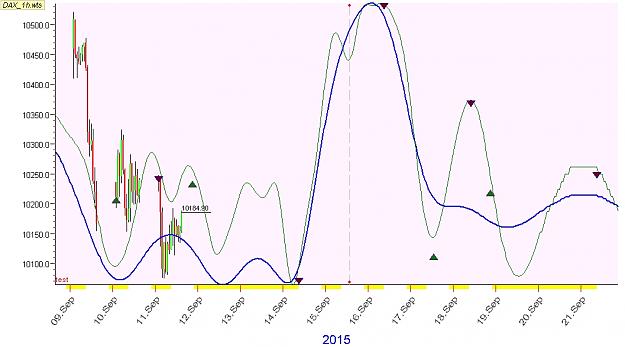
- Almondeyed replied Sep 13, 2015
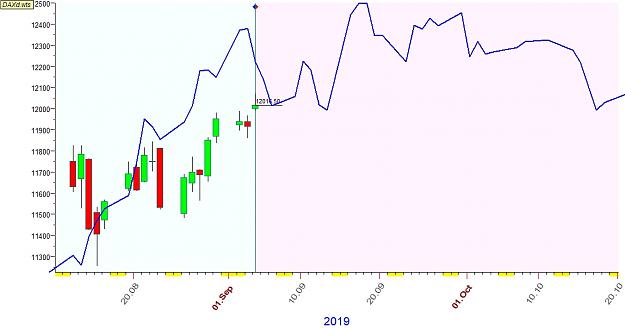
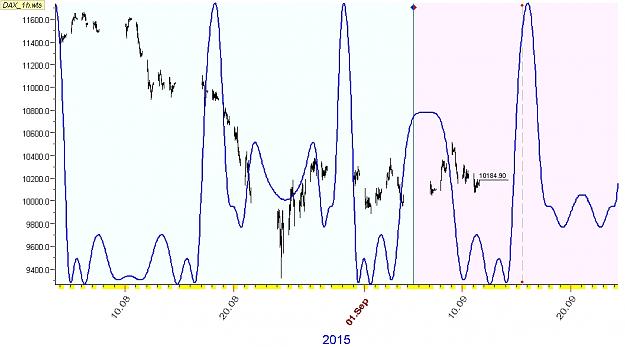
I am not sure that this cycle works for Dax or not. image image
Planetary Cycles Trading (EUR/USD)
- Almondeyed replied Aug 29, 2015
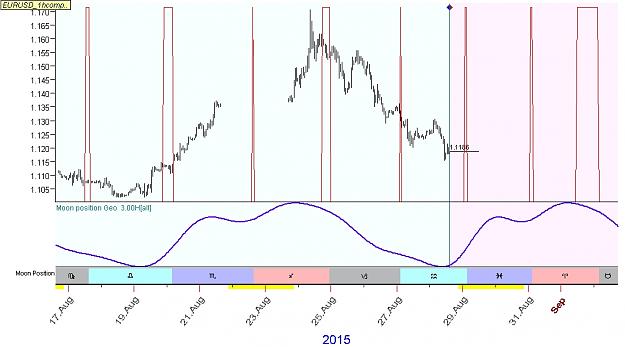
It looks, at least for Eurodollar, Moon Void of Course does not have any special pattern or effect on market turns image
Test of some of my esoteric observations