- Search Forex Factory
- 47 Results (1 Thread , 46 Replies )
-
 FinInsTrader replied Jun 16, 2021
image Up-Down-Up-Down-Up-Down-?-?-?....... Hopefully everyone achieve their % target daily/weekly/monthly.
The brutal truth of day trading
- FinInsTrader replied Jun 12, 2021
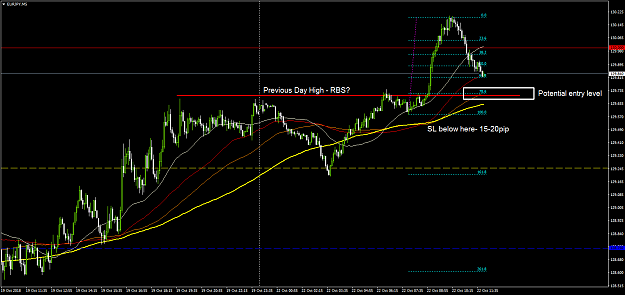
"I like to trade where the market likes to corner itself while it tries to breach previous high/low." "- where it (the EURJPY) started the day vs the rest of the space"..GBPUSD in this case image thanks FIT
The brutal truth of day trading
- FinInsTrader replied Mar 1, 2021
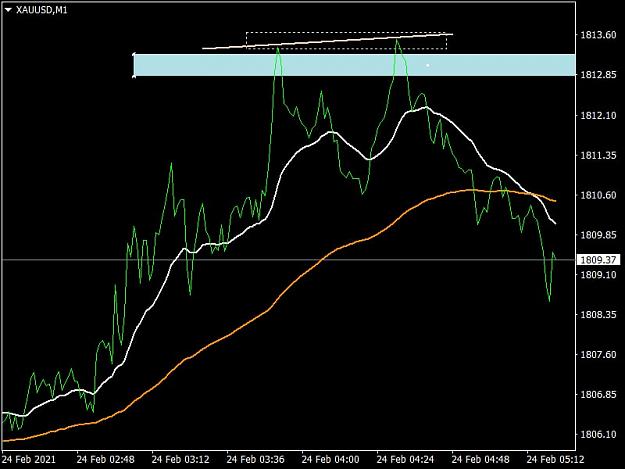
image image Are there any signs of ALGO manipulating prices in the chart above? It's a daily chart.
Real or Algo
- FinInsTrader replied Feb 23, 2021
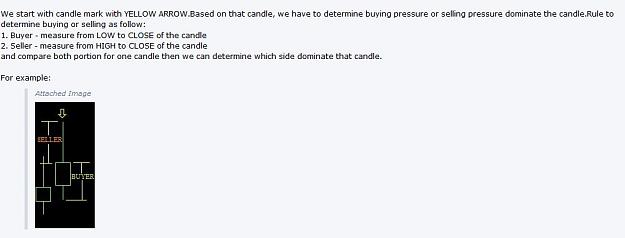
image BUY LOW SELL HIGH!.Easy?Simple?..How we can do that repeatedly? Sell at TARGETS high..Buy at TARGETS low? Really? That easy? So it is literally buy at low and sell at high. Supply and demand?When price is to high nobody want to buy,so we sell ...
Price action at the core = family members' discussion project
- FinInsTrader replied Jun 18, 2019
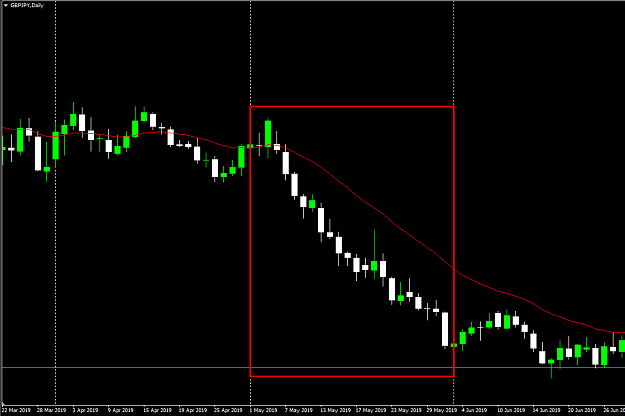
To add to @Djd has mentioned, location marked with red box also a reversal trade following George theory (extreme price action shown in the red box, I 100% sure George and those who apply this theory in trading will make entries at that ...
Price action at the core / tma intra day
- FinInsTrader replied Mar 6, 2019
Just to clarify certain point, "You put the fibs on the previous weeks (on a daily chart) with the R&S lines and then drop to a 4 hr chart during the current week to identify a suitable entry point" It easy to draw last week fib on H4 if you have ...
"Ancient" Trading System
- FinInsTrader replied Mar 5, 2019
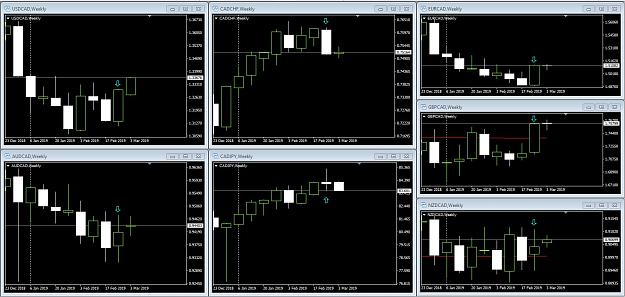
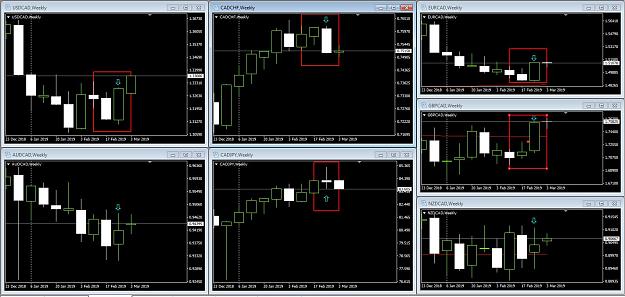
Difficult for me to give the exact number of how many pair I trade, but in general I monitor all 28 pairs. Then I look at weekly chart for each major currencies in basket. Example for CAD weekly chart below, candle mark with blue down/up arrow are ...
"Ancient" Trading System
- FinInsTrader replied Mar 4, 2019
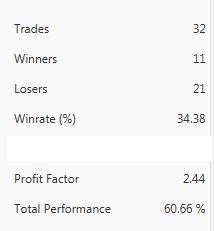
This is one of my accounts stats. The focus of this account is to enter at every possible turning point using concept discuss in here. With very tight SL, from 5-20pip only depend on pair traded. image From the screenshot above, more than half of ...
"Ancient" Trading System
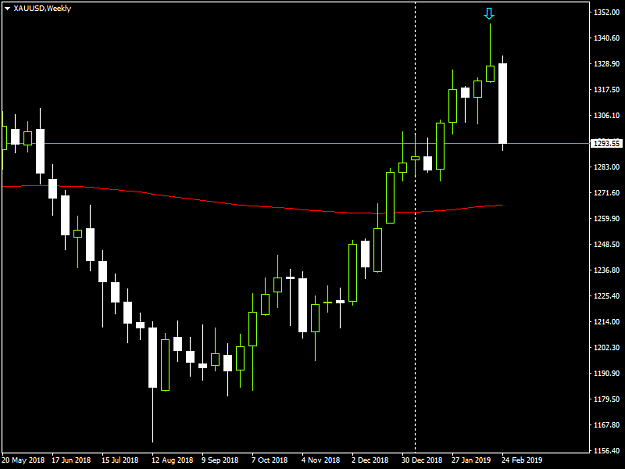
- FinInsTrader replied Mar 1, 2019
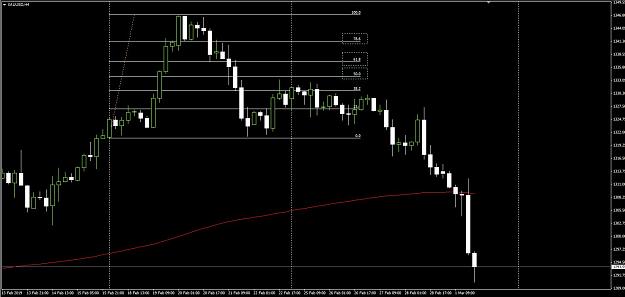
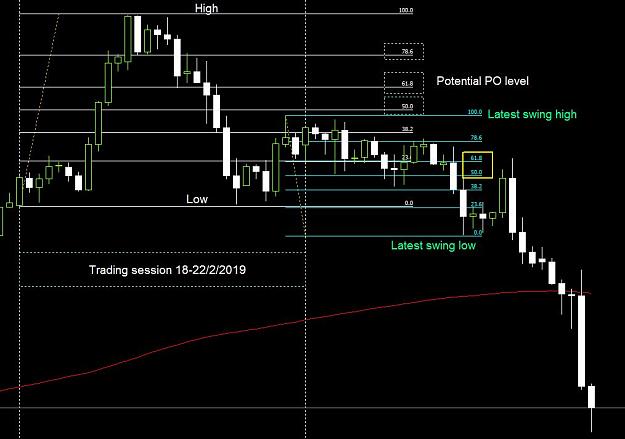
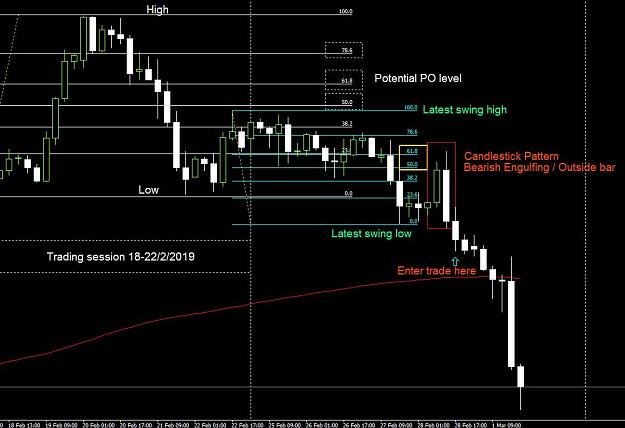
Example again, Gold weekly chart, last week candle (18/2-22/2), marked with down arrow = sell candle. image Now we have trading bias, which is SELL. Now go to H4 chart and draw a retracement tools using high/low of the previous week. For Gold, I ...
"Ancient" Trading System
- FinInsTrader replied Mar 1, 2019
Hello guys, We meet again. Hopefully everyone still survive in this trading arena. Its a marathon, not a sprint. Hope you guys still remember the concept for this trading system I shared previously. For those how just unfortunately stumble into this ...
"Ancient" Trading System
- FinInsTrader replied Nov 8, 2018
HORRIDO.......xoxoxo.. Thanks FF. image
The only thread you will ever need: FX Exposed!
- FinInsTrader replied Oct 29, 2018
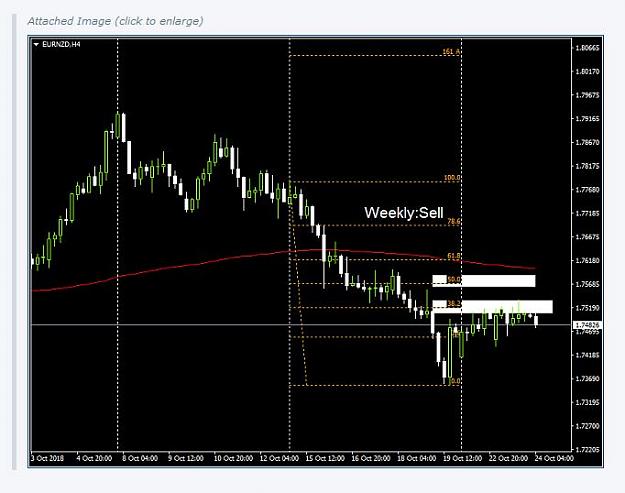
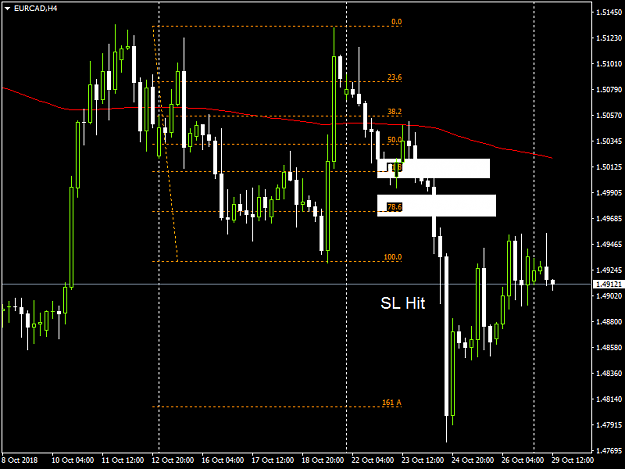
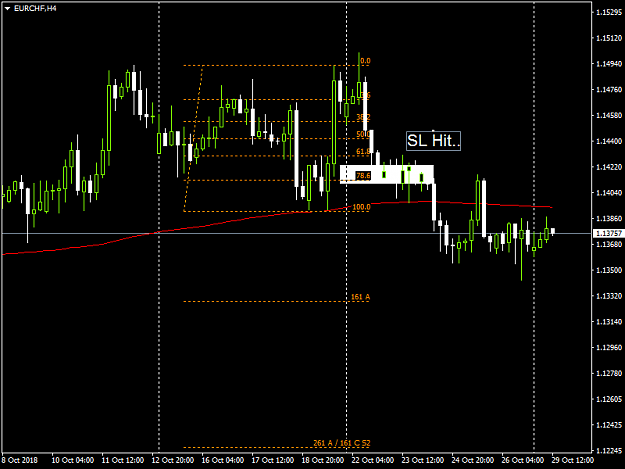
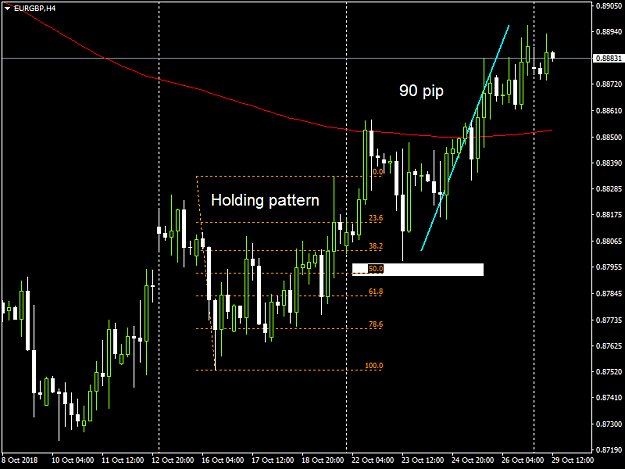
We continue our review with Euro pair. 1.Before image After image 2. Before image After image 3.Before image After image 4.Before image After image 5.Before image After image
"Ancient" Trading System
- FinInsTrader replied Oct 28, 2018
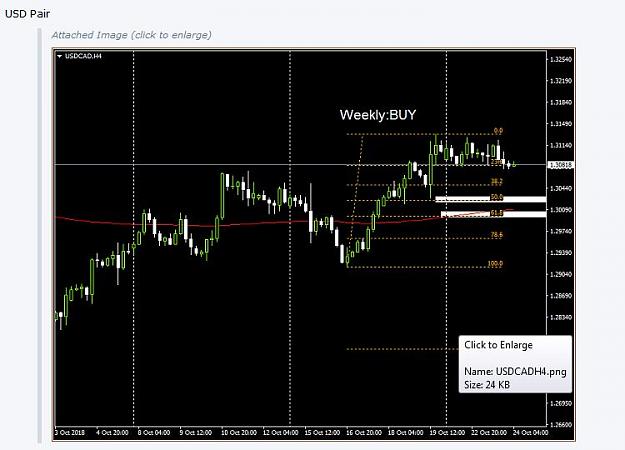
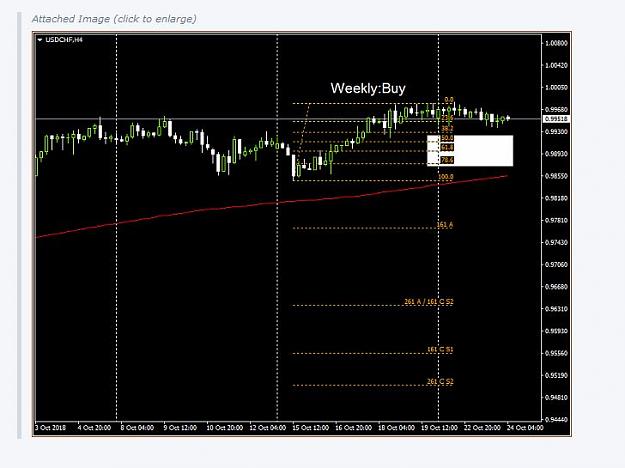
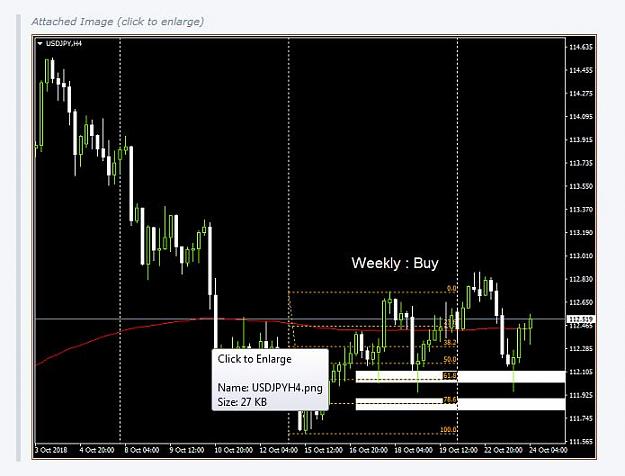
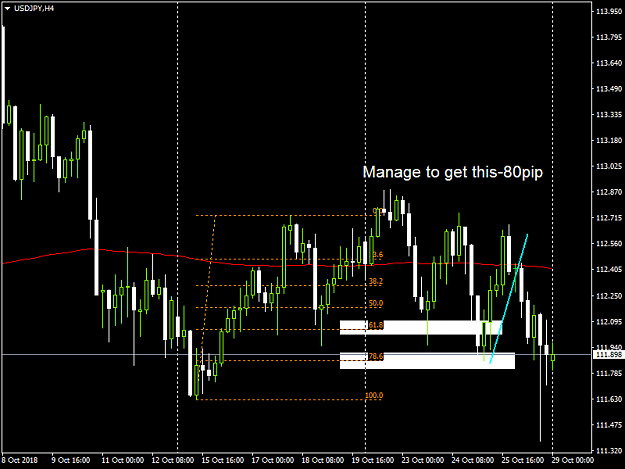
GOOD DAY, Lets do some review for USD PAIR first. USD Pair: 1 BEFORE image AFTER image News give us nice discount to buy on deep. 2 BEFORE image AFTER image Example of holding pattern 3 BEFORE image AFTER image Ranging market.
"Ancient" Trading System
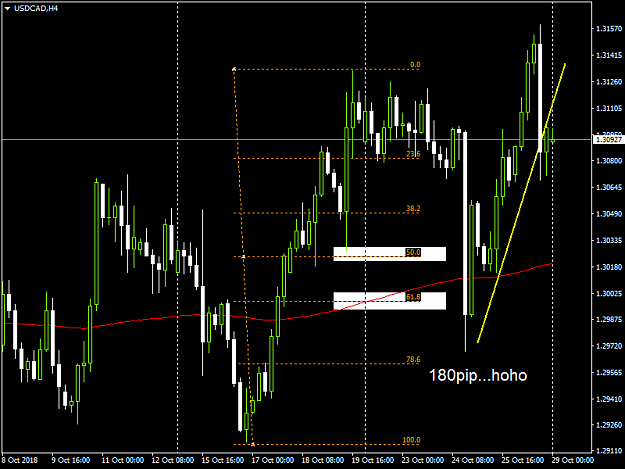
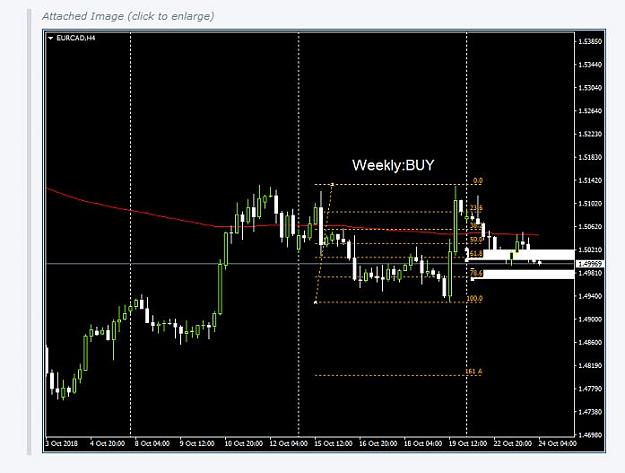
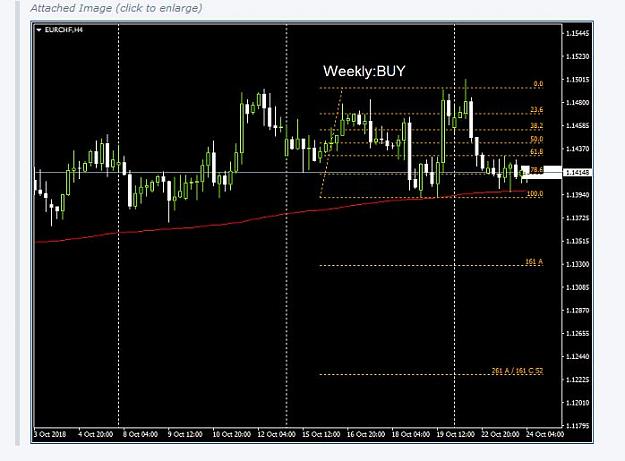
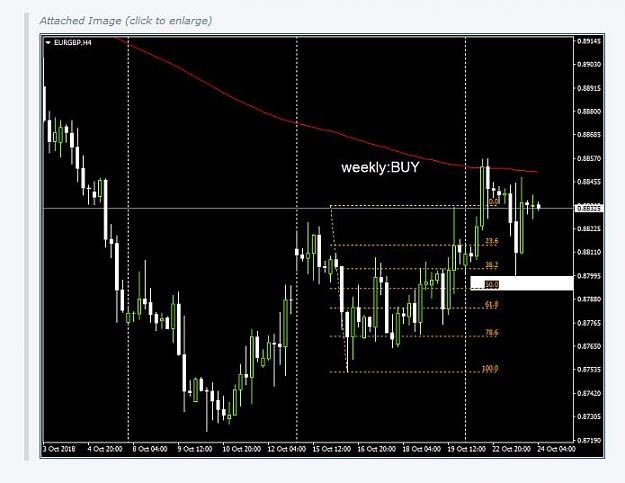
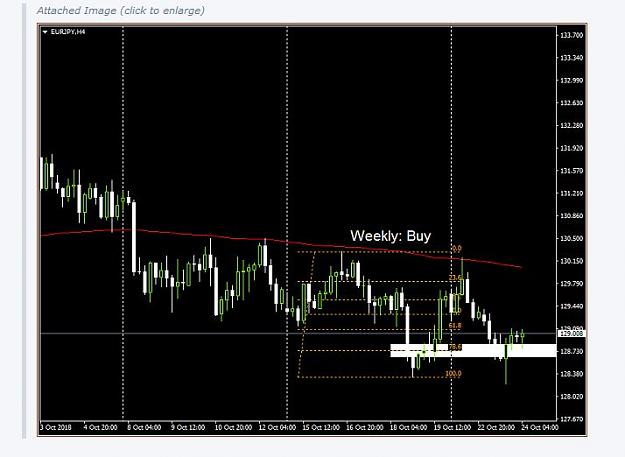
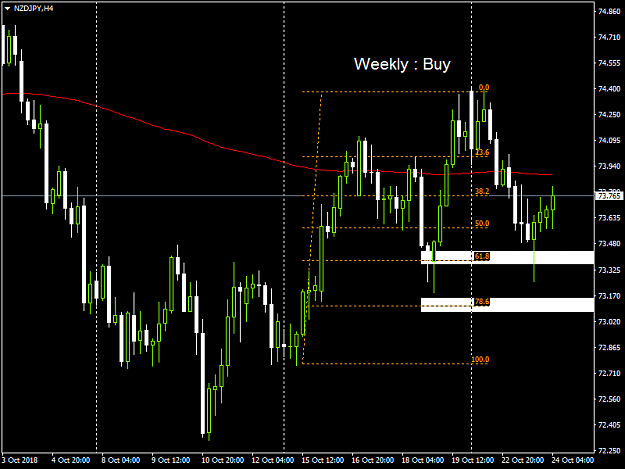
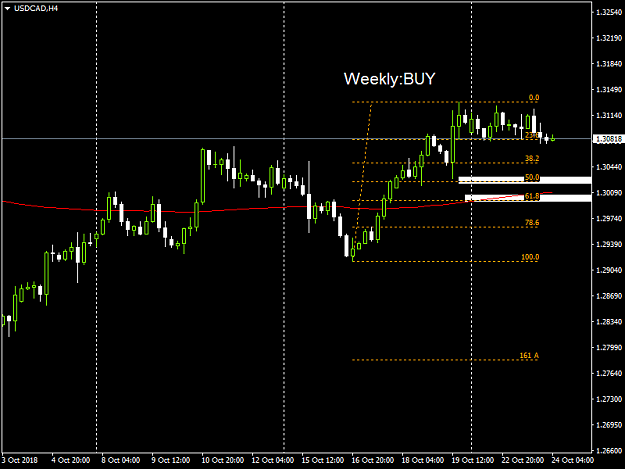
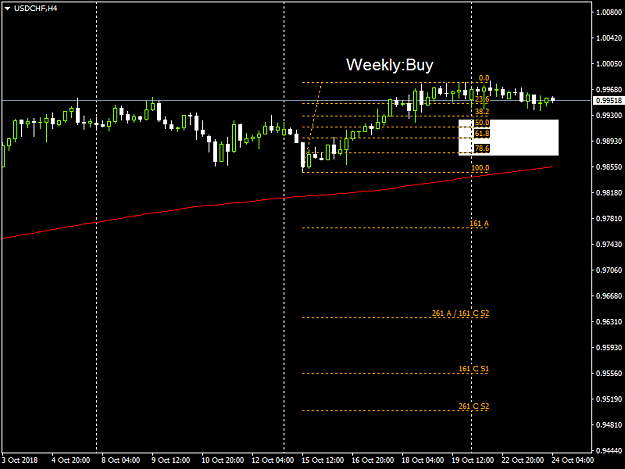
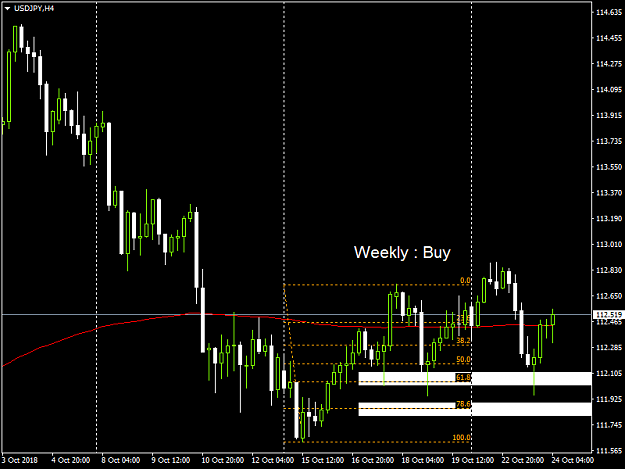
- FinInsTrader replied Oct 23, 2018
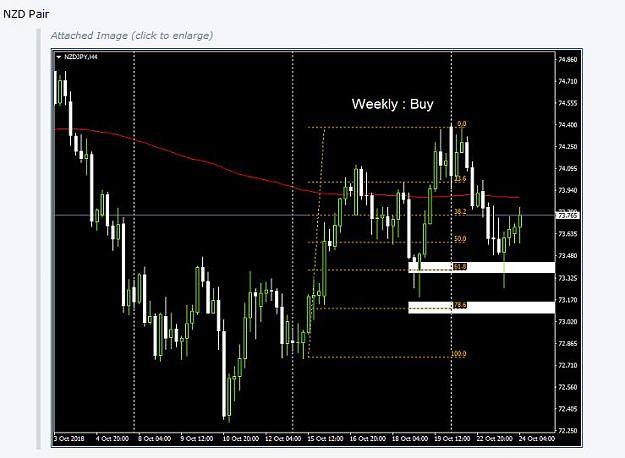
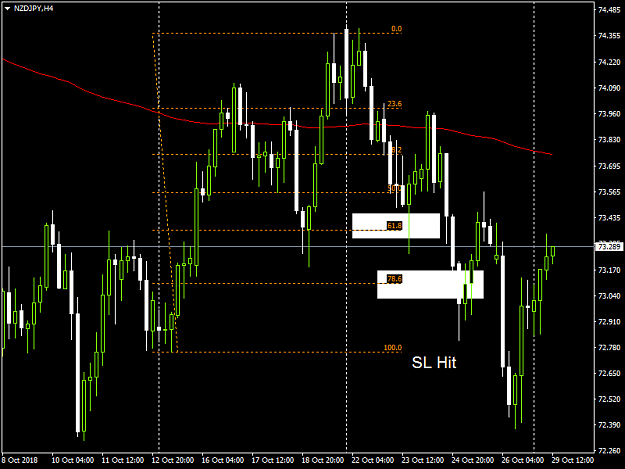
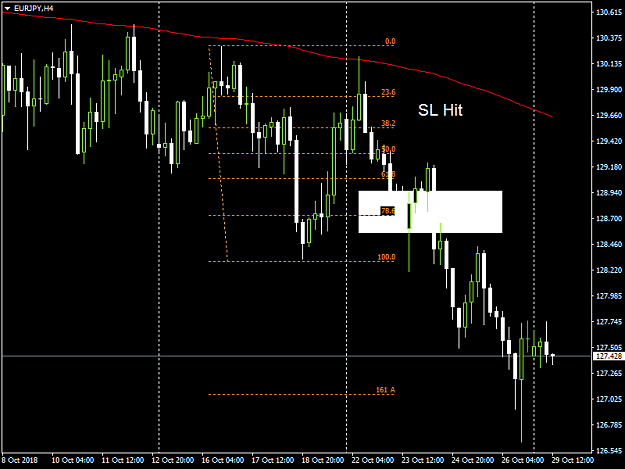
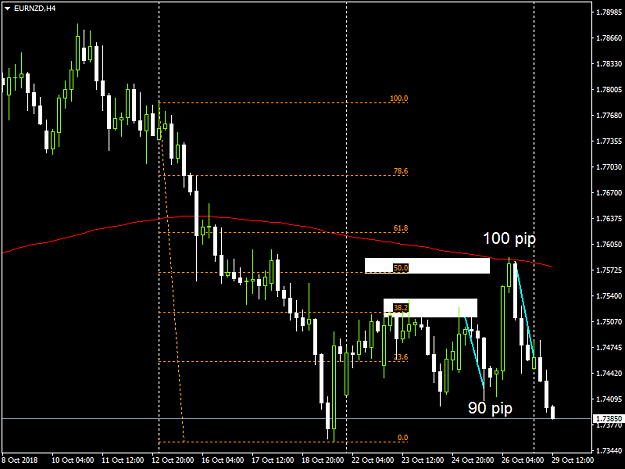
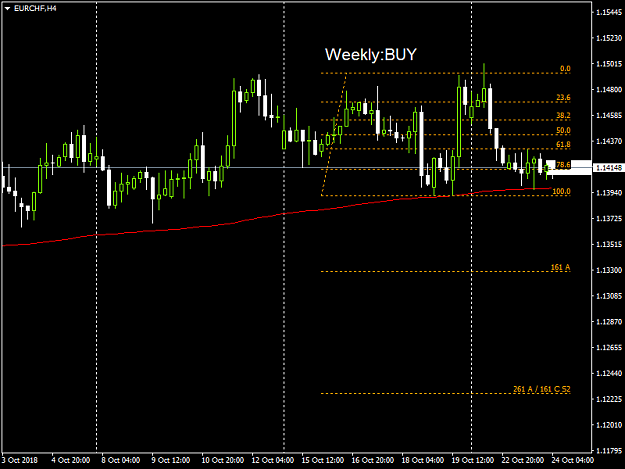
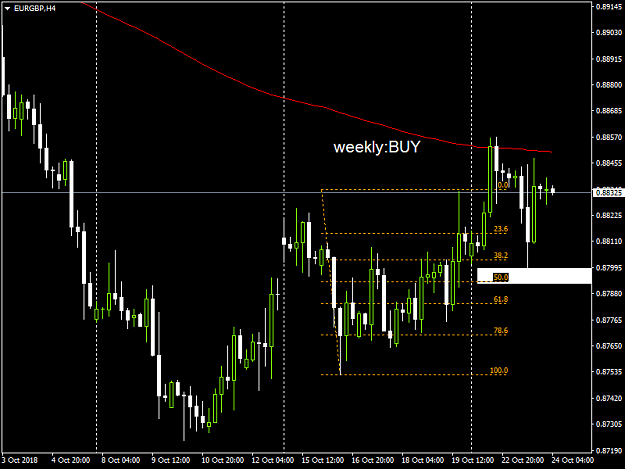
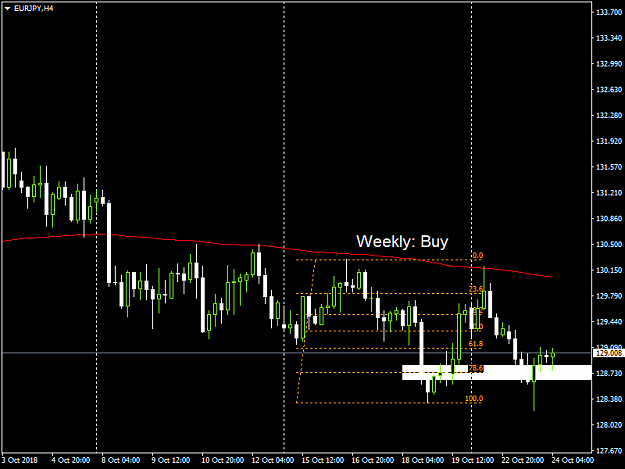
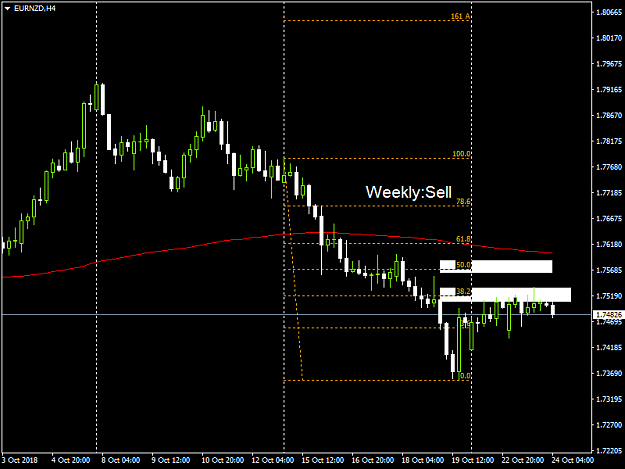
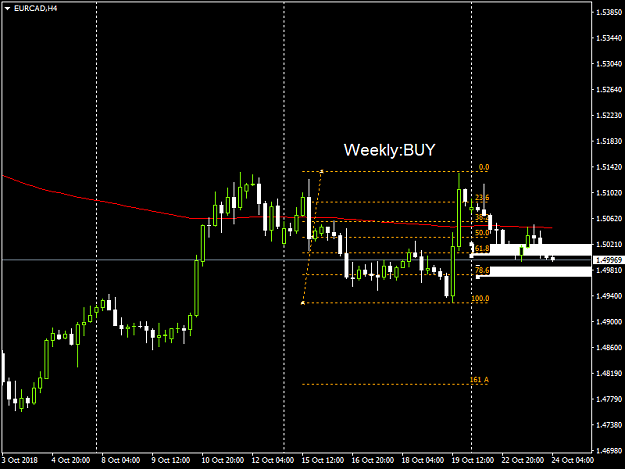
Big pip movement today..weekly reversal.Let see how it goes... USD Pair image image image Euro Pair image image image image image NZD Pair image
"Ancient" Trading System
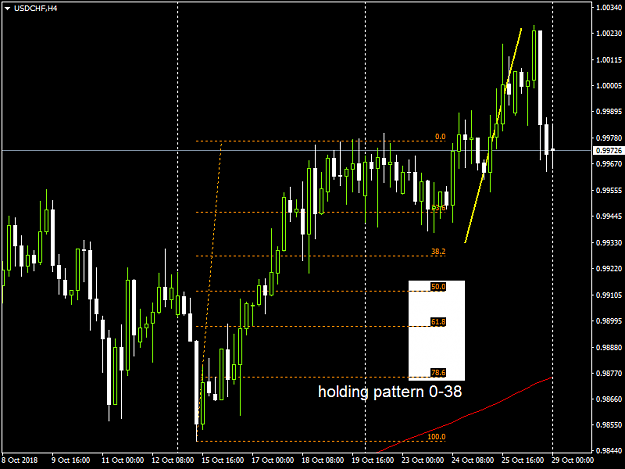
- FinInsTrader replied Oct 23, 2018
Another example for holding 0-38 Fib level..lets see how it goes. image
"Ancient" Trading System
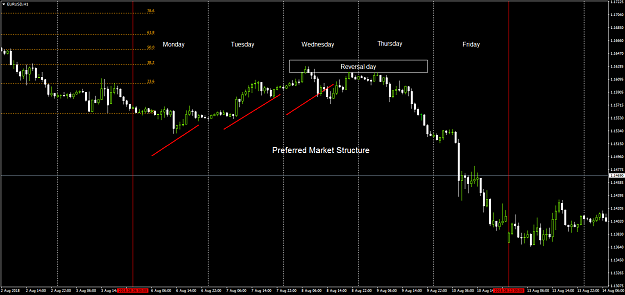
- FinInsTrader replied Oct 23, 2018
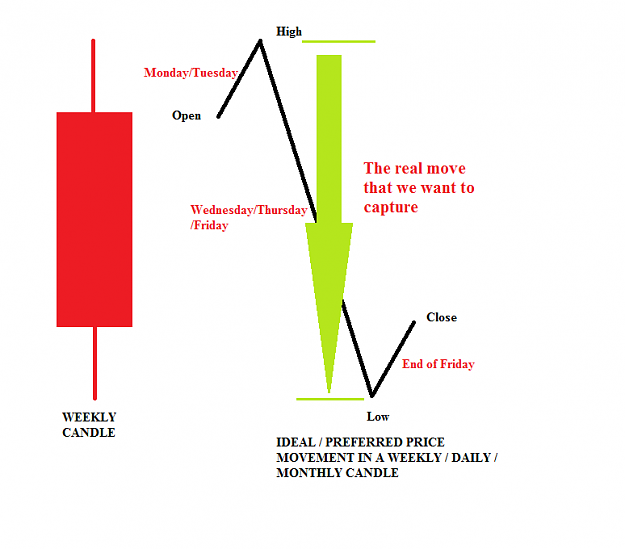
If you look closely at the weekly candle,it bullish...On monday,candle close as bear.So,for Tuesday, we will short EJ..When referring to weekly bias, this is good structure, where Monday & Tuesday price fall giving us weekly retracement and ...
"Ancient" Trading System
- FinInsTrader replied Oct 22, 2018
image # this is high risk entry because it against higher timeframe market structure. H4 - downtrend
"Ancient" Trading System