- Search Forex Factory
- 177 Results (2 Threads, 175 Replies)
-
 JackAntigua replied May 16, 2019
You can do it in Tradestation by having 4 datastreams in 1 window. I've then hidden the candles otherwise you wouldn't be able to see the moving averages clearly, in this case blue for EURUSD, red for GBPUSD, green for GBPJPY and magenta for EURGBP. ...
Moving Averages together for multiple pairs


- JackAntigua replied Feb 22, 2018
I'm sure that I can take out of this screenshot more than I am at the moment, encapsulating it in a rules based approach would I am sure be useful.
Strat's PASR Long Term, Stress Free Trading

- JackAntigua replied Feb 12, 2018
Strat, Could I just check my understanding of your USDCAD trade. Price had broken above the highs of the London session so you were looking for a continuation long, (supported also by the fact that the 200 ema which had been acting as resistance had ...
Strat's PASR Long Term, Stress Free Trading

- JackAntigua replied Feb 12, 2018
Hi Strat, Presumably, this would be a good example of a valid setup when all 3 timeframes aligned which led to a sustained move to the upside. I've managed to obtain a shadow indicator for Tradestation which is my preferred charting platform (as I ...
Strat's PASR Long Term, Stress Free Trading

- JackAntigua replied Feb 7, 2018
Let me take a stab at this but before Strat tells me I'm talking bollocks, I am aware of that possibility as I have not yet read nearly enough of this or the original thread. I am thinking that the weekly bar closing 12th January 2018 (black ...
Strat's PASR Long Term, Stress Free Trading


- JackAntigua replied Feb 1, 2018
If you wait for 3 timeframes to align you will generally be late to the party.
Strat's PASR Long Term, Stress Free Trading


- JackAntigua replied Dec 21, 2017
This is where we are at the moment.
Strat's PASR Long Term, Stress Free Trading

- JackAntigua replied Dec 14, 2017
Hi Yoki, All in all, it looks a bit confused to me. Firstly, 200 ema's are relatively flat on daily, weekly & monthly charts with price testing from below on the weekly but from above on the monthly. And the 20 is above the 50 on the weekly but ...
Strat's PASR Long Term, Stress Free Trading

- JackAntigua replied Dec 12, 2017
Hello Strat. Just noticed this one on USDCAD 60 min. Bullish pinbar from support, target daily resistance. Is this one you would take?
Strat's PASR Long Term, Stress Free Trading

- JackAntigua replied Nov 29, 2017
Very interesting Strat, I've done a bit of back testing and came across this nice example on USDCAD from September off Monthly support. I initially thought that the trigger would have been the hammer on the 8th September but looking more closely, ...
Strat's PASR Long Term, Stress Free Trading


- JackAntigua replied Dec 8, 2016
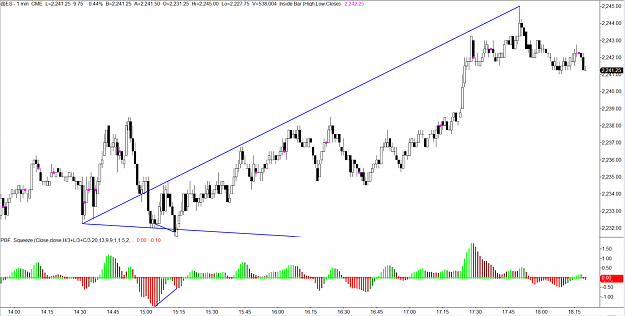
Interesting, clear divergence there as well.
A new look at Wolf Waves
- JackAntigua replied Nov 26, 2016
Hi Pharley, I think on this one there were clear signs of exhaustion after 2 consecutive divergences.
Pharley Simple system - Get your levels right for trading S/R

- JackAntigua replied Oct 10, 2016
Another question I'm afraid, I was wondering why this would not have been a +1 trail out.
Highest Open / Lowest Open Trade

- JackAntigua replied Aug 2, 2016
I've been reading the exchanges between yourself and pininit. Which of the your equity curves is most desirable? And isn't the point that they encompass all trades? The fact that you had one bad position is significant because it almost wiped you ...
Geppy vs. GJscalper - a duel to the death!

- JackAntigua replied Jul 1, 2016
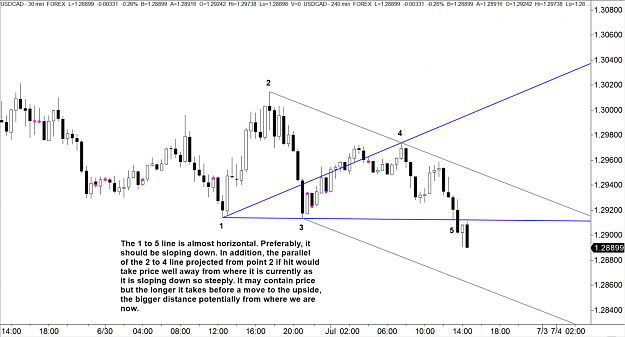
Hiya, It's not something I've particularly read about, it just seems logical to me that you don't want price to spend a lot of time below point 5, and particularly below the parallel of 2 to 4 projected from point 3. I'm attaching an excerpt from ...
A new look at Wolf Waves


- JackAntigua replied Jun 28, 2016
Hi PK, I was wondering, should point 1 not be the highest point (up to that point)? There was a higher point just to the left which could be point 1.
A new look at Wolf Waves
