- Search Forex Factory
- 192 Results (2 Threads, 190 Replies)
-
 iTrader replied Mar 4, 2019
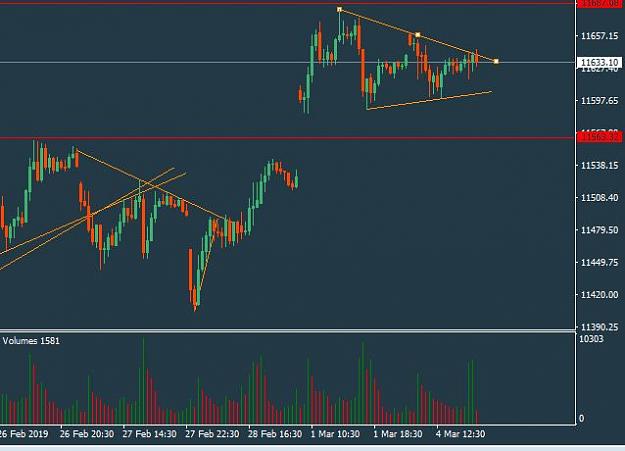
Watching DAX i see an interesting flag pattern forming. once we get out of the flag we might see a decent bull move toward 11700, but for now just watching. image
My Simple Trading Journal
- iTrader replied Feb 27, 2019
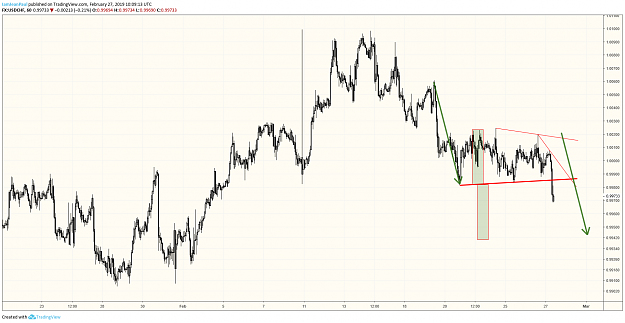
Technicals: Key break lower, potential continuation pattern. image
My Simple Trading Journal
- iTrader replied Feb 20, 2019
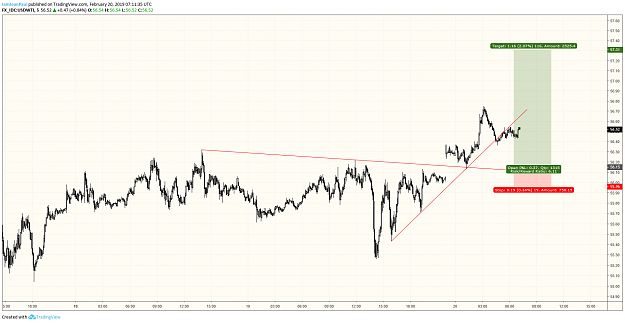
Closing also WTI with a nice profit at 56.55 / +37. Would have probably closed it overnight with 30 pips more profit, but i have to sleep sometimes lol. image The reason i closed were some conflicting price action signals between WTI and BRENT. ...
My Simple Trading Journal
- iTrader replied Feb 18, 2019
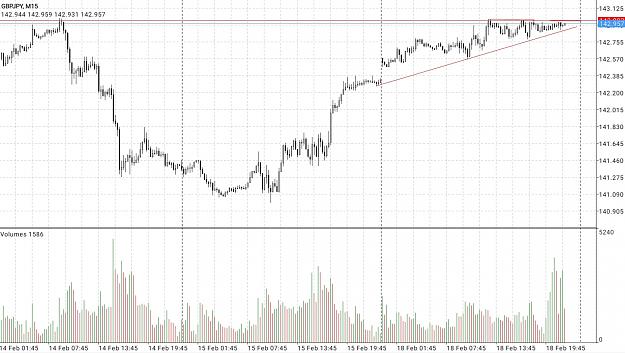
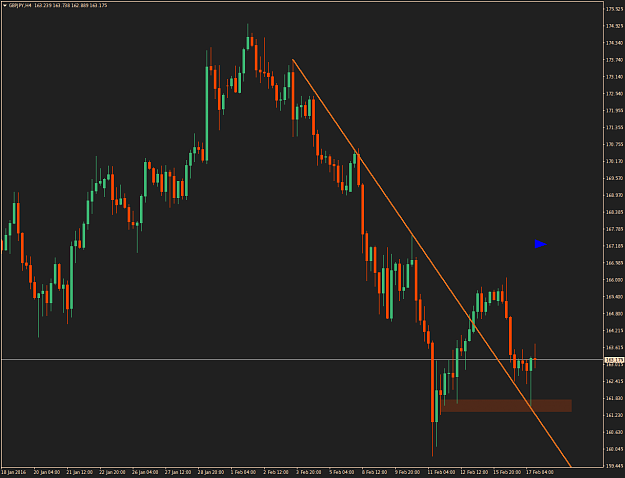
Interesting setup on GbpJpy and also GbpUsd but i am not taking it because of the lack of liquidity right now, still want to post it. image Entry would be at 142.93 Stop at 142.78 Limit 143.30 edit// Stop hit on this idea, but as mentioned above i ...
My Simple Trading Journal
- iTrader replied Feb 18, 2019
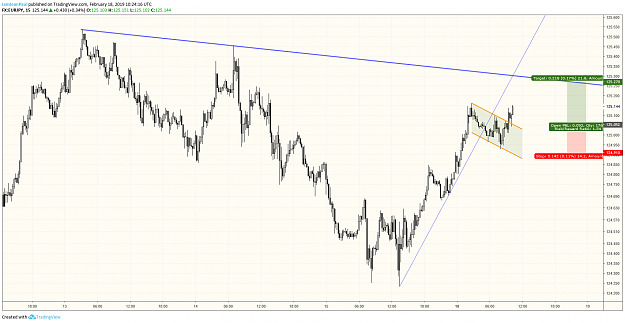
Chart with more input. image Its a quick trade for a calm trading day.
My Simple Trading Journal
- iTrader replied Feb 15, 2019
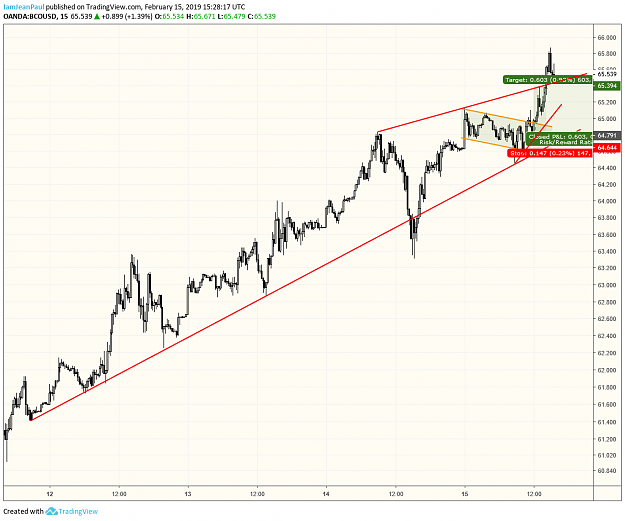
Brent chart: image I like to build my entry decision based on fundamentals and chart technicals.
My Simple Trading Journal
- iTrader replied Oct 30, 2016
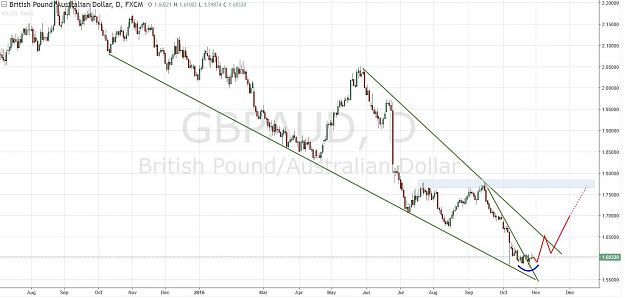
image I think this daily chart talks for it self. In my opinion this market is currently bottoming out after forming a huge falling wegde. A falling wedge is traditionally a exhaustion pattern, and looking at this chart there is quite a chance for ...
GBP/AUD - Daily Trading
- iTrader replied Oct 24, 2016
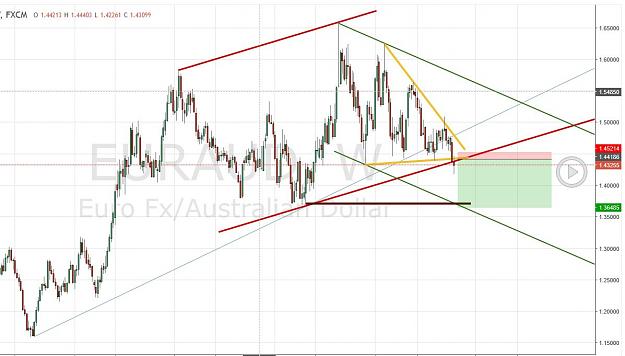
url EurAud looking increasingly ugly. The weekly chart, is showing a very strong hand of the bears. image I am expecting an aggressive move towards 1.3720. I am seeing some general weakness in the Euro, its quite offered in rallies. Aud has a ...
EUR/AUD
- iTrader replied Oct 3, 2016
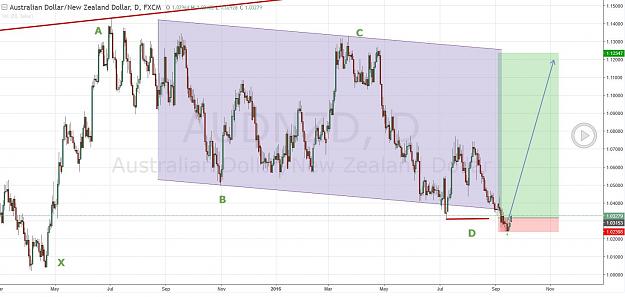
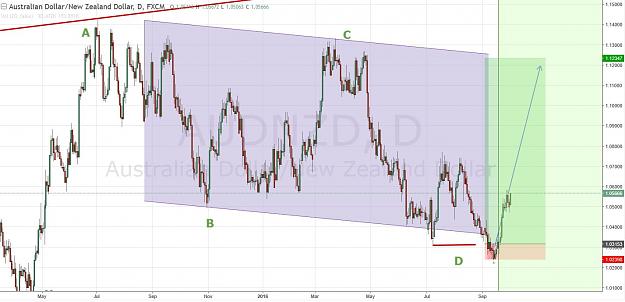
image image keep calm and watch the money pile up... this pair is going to 1.12! it may take a little while but its going there. my stop is still at 1.0315 at BE! Good luck lads.
AUDNZD
- iTrader replied Feb 17, 2016
Take care guys, dragons sometimes fly high. This 4H Pinbar is ugly and could provoke a quick move towards 167.30. image
Forex Made Millionaire Thread for Blog Swing Trades
- iTrader replied Dec 15, 2015
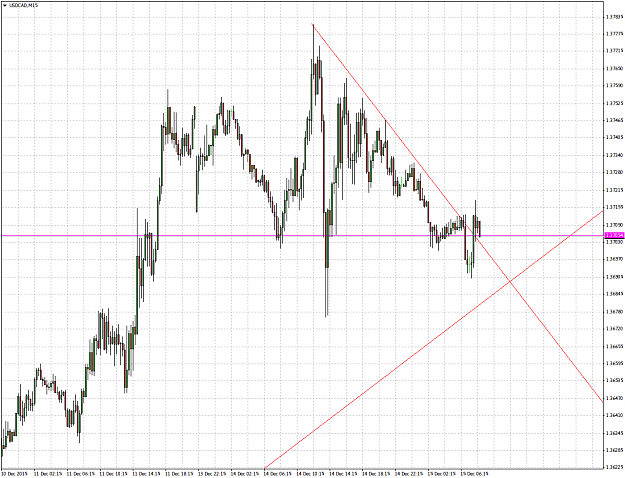
Shortterm Buy UsdCad @ 1.3705 Stop 1.3674 Looking for 1.3760 as a finally target. Around 1.3735 gonna adjust stop to BE and take a small profit off. image
USD/CAD
- iTrader replied Dec 14, 2015
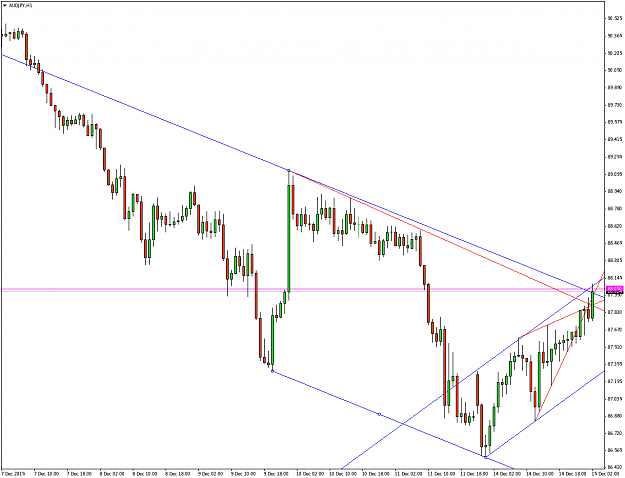
Sell AudJpy 88.05 Stop 88.26 Gonna take off some profits at 87.65 and move Stop to BE, final target is around 87.40 image
AUD/JPY
- iTrader replied Dec 14, 2015
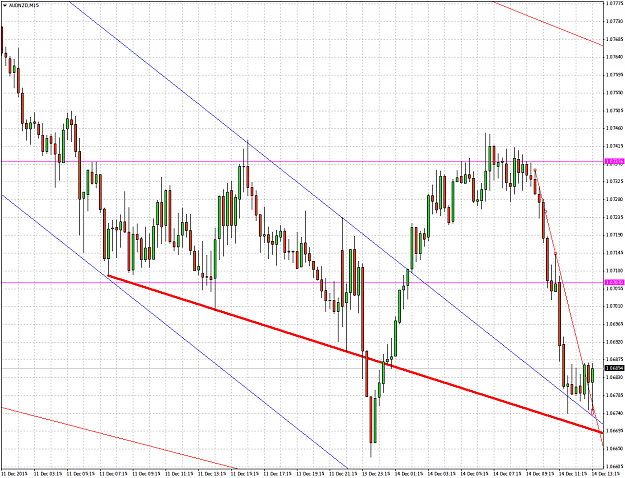
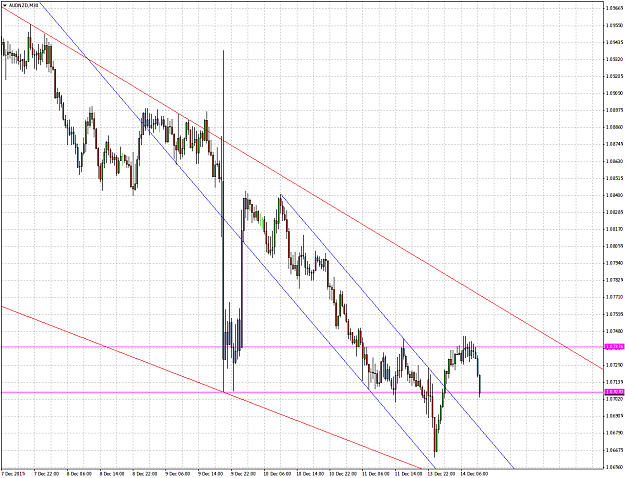
Closed on the target. Turned long now @ 1.0680 with a stop at 1.0660 looking for a move to the range top 1.0735, gonna move stop to BE and maybe take a small profit off somewhere around 0710. image
AUDNZD
- iTrader replied Dec 14, 2015
First Target 0705 achieved, closed half of the position and moved stop to BE and now looking for 0685. image
AUDNZD
- iTrader replied Dec 13, 2015
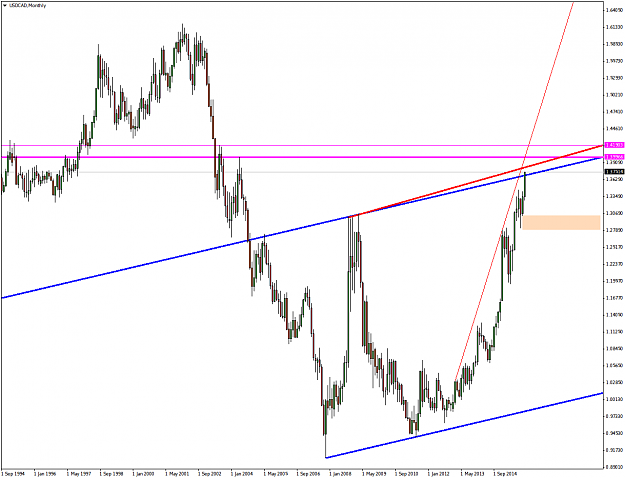
This UsdCad monthly chart looks quite interesting to me. This multi-year trendchannel and trendlines are a major resistance ahead for this currency pair. I am suspecting around 1.3950/1.4050 longterm UsdCad Bulls will start to cash in their profits, ...
USD/CAD
- iTrader replied Dec 13, 2015
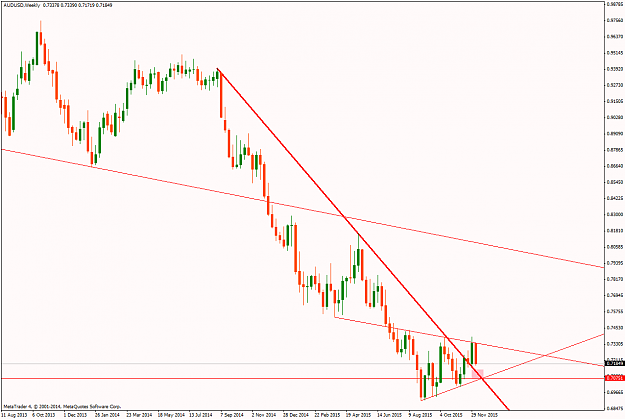
Check out AudUsd Weekly Chart with some interesting Trendlines. The 0.7100/0.7070 area looks crucial to me, if this wedge is going to become a trend continuation pattern price needs to get back under the major bold Trendline and continue with its ...
AUD/USD
- iTrader replied Jun 16, 2015
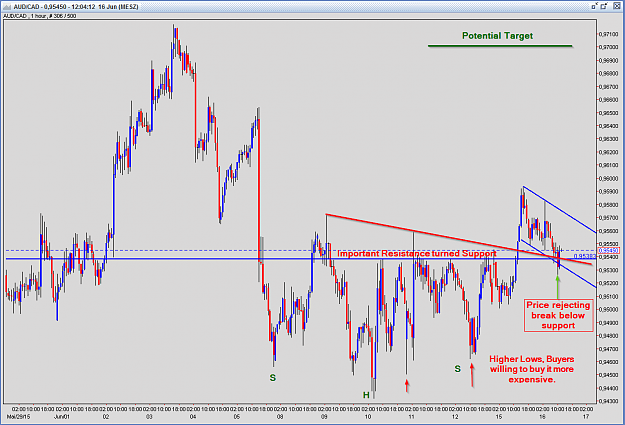
I entered an AudCad long position @ 0.9545 with a stop @ 0.9525 and a target around 0.9700. Chart below for a better explanation of my thoughts on this trade. image
iT - Trading Ideas
- iTrader replied Jun 12, 2015
Just sold UsdJpy image Its looking like the bears are absorbing the power of the bulls, i am looking for a decent leg lower but we have the ppi data on the calendar, its a tight stop not much to lose, i will look how to manage it as it develops.
iT - Trading Ideas

- iTrader replied Jun 11, 2015
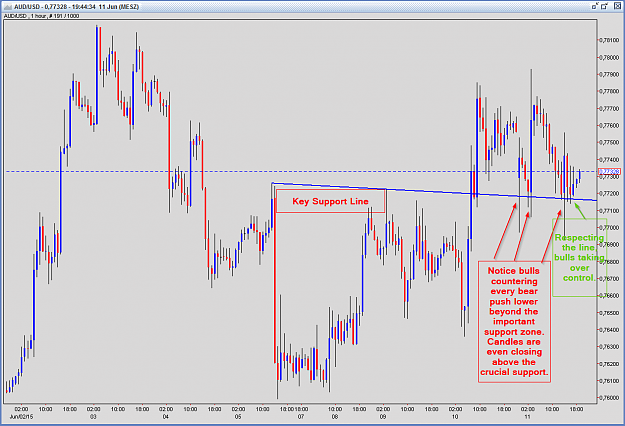
AudUsd 1h chart with some thoughts. image Optimally i am having a 1:4 risk:reward on this position, so i am happy to take the risk on this one.
iT - Trading Ideas