- Search Forex Factory
- 190 Results (1 Thread , 189 Replies )
-
 Almuten replied Jan 21, 2024
Dear Strat & Co, I've been lurking around here off and on for about five years, but I finally decided to make PASR my permanent home. Five years ago when I first stumbled upon Strat's strategy I didn't know what to make of it because there wasn't a ...
Strat's PASR Long Term, Stress Free Trading

- Almuten replied Feb 14, 2019
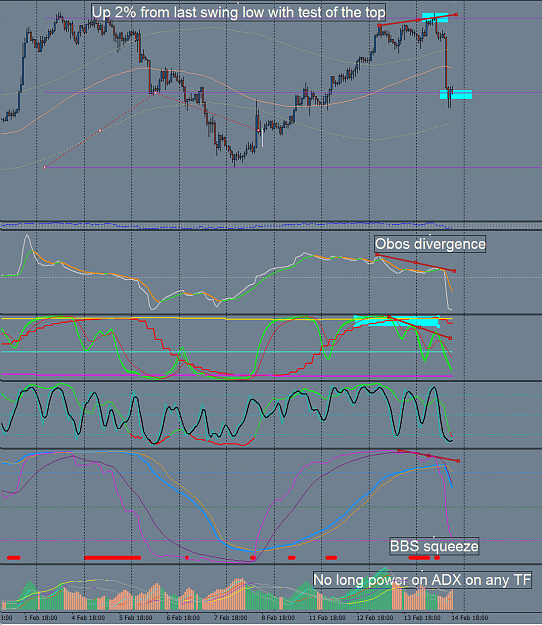
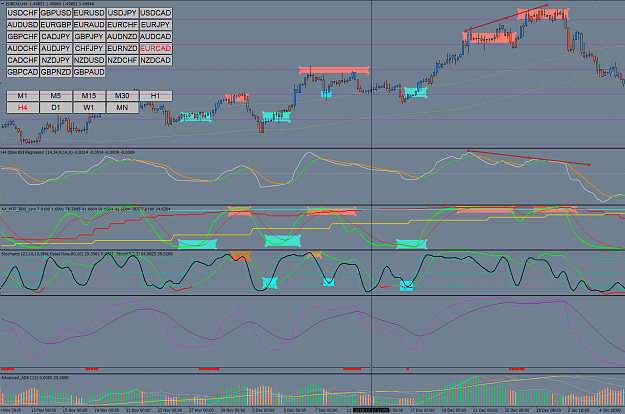
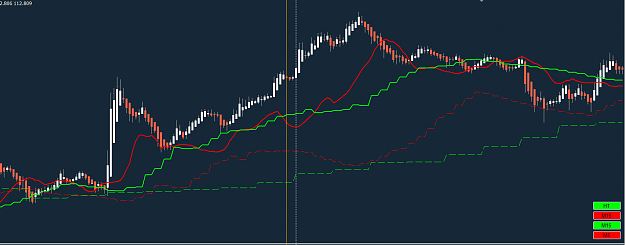
Looks like it worked out well for you if you took a quick profit. But look at the H4 under Alien V1. Still power in the ADX down, RSIOMA < 20, Stoch 21 < 50, Stoch 8 < Stoch 21. image Last night I took these two: Shorted CADJPY 6 pips from the top ...
Alien's Extraterrestrial Visual Systems
- Almuten replied Feb 12, 2019
God Help ME! I'm starting to think like a banker! Hey fellow Aliens! I’ve been studying this thread for five years but I don’t post that often; mostly because I’ve only now started live trading very recently (within the last few weeks). So far, so ...
Alien's Extraterrestrial Visual Systems
- Almuten replied Feb 12, 2019
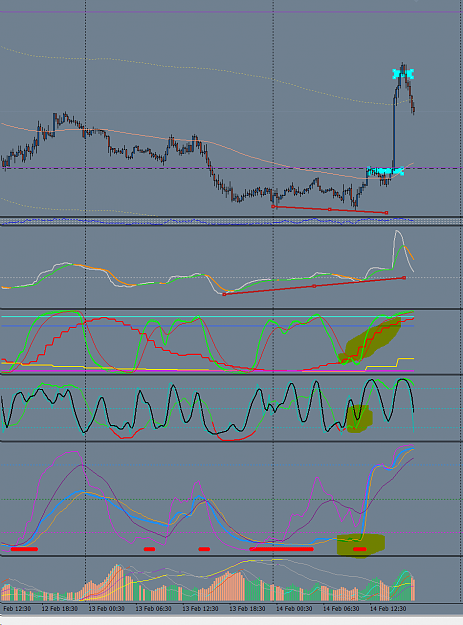
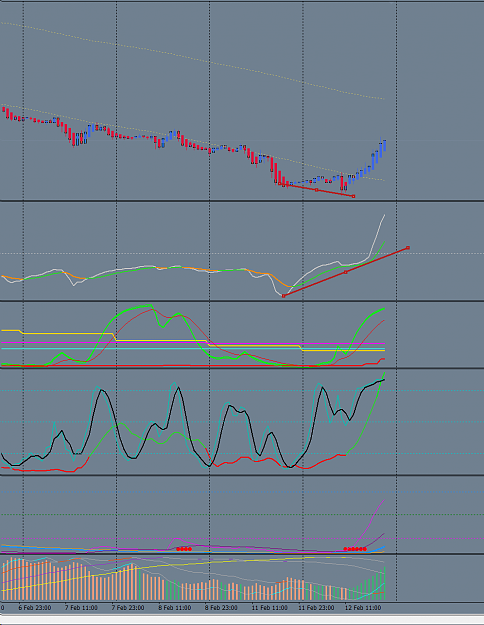
There's a nice Obos divergence on H1 as well!
Alien's Extraterrestrial Visual Systems
- Almuten replied Sep 23, 2018
Hello Aliens! I've been reading this thread since it's beginning - almost 5 years now! My how time flies! Anyway, many thanks to Master Alien, for he made success in this forex business seem possible. I greatly appreciate the years of his personal ...
Alien's Extraterrestrial Visual Systems
- Auto Trendline ProjectStarted Sep 16, 2018|Platform Tech|0 replies

Hi Everyone, I need some help writing a trendline indicator. I don't think it would be that hard ...
- Almuten replied Feb 1, 2018
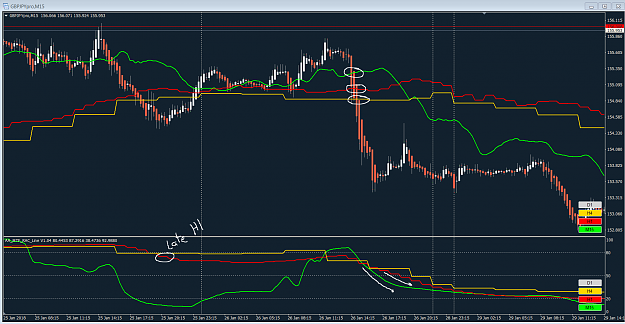
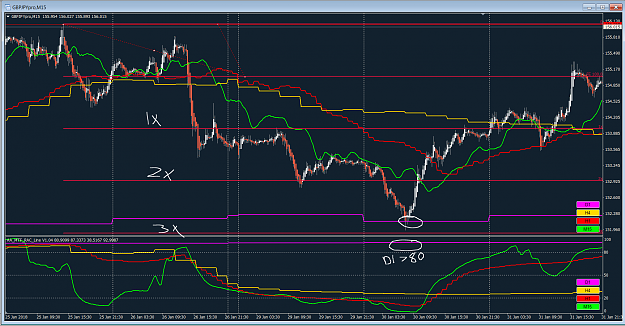
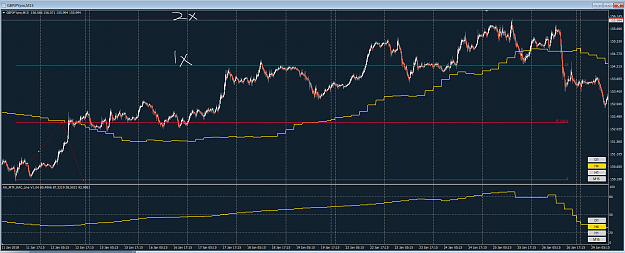
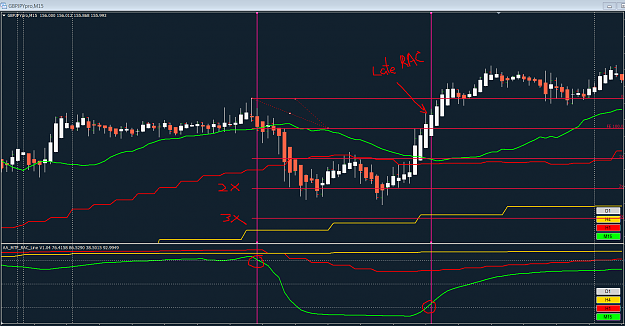
Jan 25th & 26th On the 25th, a short initiated on M15 for a 2x profit (if it was taken). The H1 triggered late on the RAC, so right there is a reason to think it will reset and test the top. The 26th afforded an ideal opportunity to the short side ...
HAC & RAC - A Simple-Minded Approach
- Almuten replied Feb 1, 2018
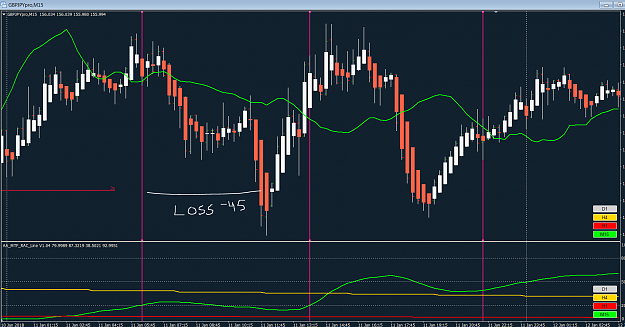
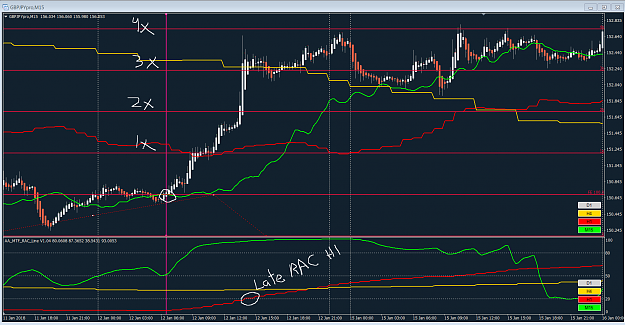
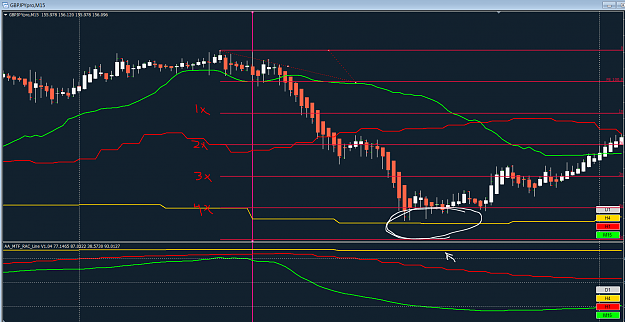
Jan 11th On this day the market futzed around, trying to build a long position, etc... The first opportunity would've been a loss of around 45 pips. After that it was clear sailing. image Jan 12th M15 and H1 both triggered. H1 had a late RAC ...
HAC & RAC - A Simple-Minded Approach
- Almuten replied Feb 1, 2018
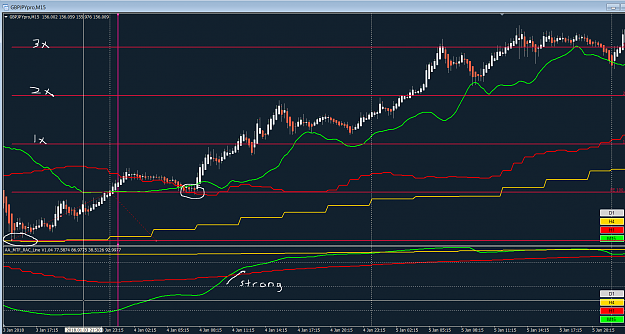
Jan 9th - this is the kind of ideal scenario that you want to find; a quick, cascading of triggers from one TF to the next. image But since H4 was involved, I'll put on the D1 and see its relationship to everything. You can see that the H4 RAC has ...
HAC & RAC - A Simple-Minded Approach
- Almuten replied Feb 1, 2018
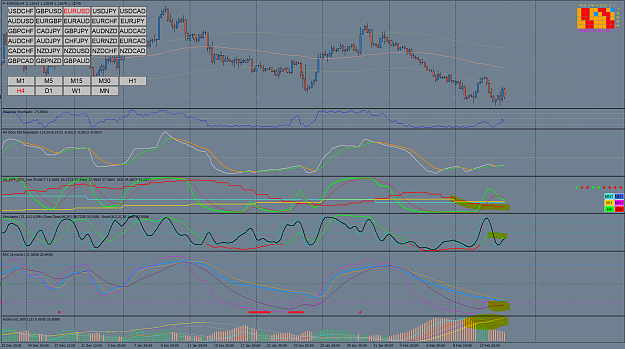
Hi Timo! What I wanted to do was place all the info for multiple TFs on a single chart because it would be easier to manage (at least in theory). At the very least it could offer a quicker, cleaner view of the relationships between TFs. Also, I ...
HAC & RAC - A Simple-Minded Approach
- Almuten replied Jan 4, 2018
A Helpful Tool I've been perusing on Forexalien's thread lately and happened across a nice indicator - a multi TF Drake Stochastic (more on this later). Anyway, I modified the code a bit and made a multi-TF HAC line. I have two versions, each having ...
HAC & RAC - A Simple-Minded Approach
- Almuten replied Dec 21, 2017
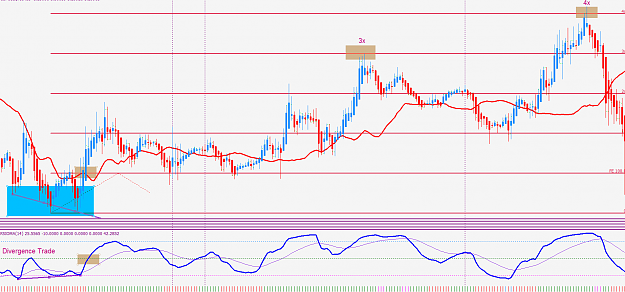
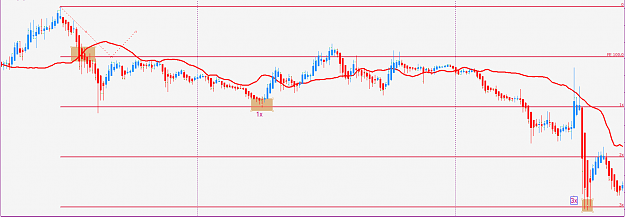
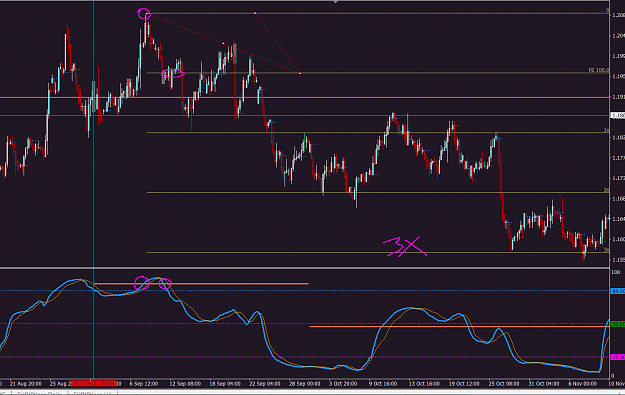
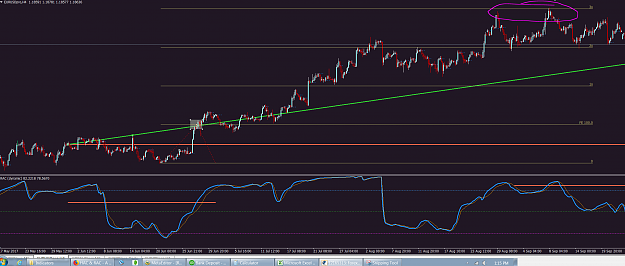
H4 Projection Like the previous example, this one also had a nice H4 projection - a 3x to the pip. In this case, a high was made just as the H4 RAC crossed the key level. To my mind, this establishes some importance. Anyway, the projection was made ...
HAC & RAC - A Simple-Minded Approach
- Almuten replied Dec 21, 2017
Here's another setup going the other way in September. This one hit 5-6 times on the same trendline before moving lower. image And here's the 3x target reached in early October image
HAC & RAC - A Simple-Minded Approach
- Almuten replied Dec 21, 2017
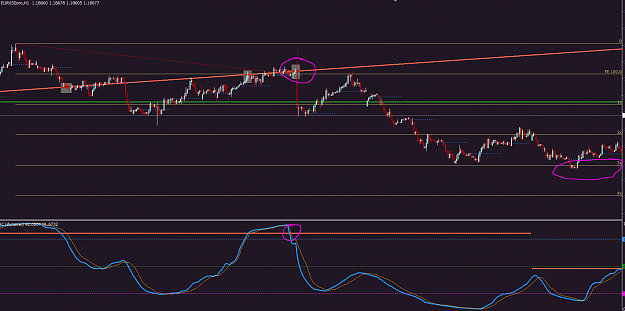
And now is the H4 chart. It's not really a 'perfect setup' like H1 and I wouldn't trade it this way, but given H1 was so perfect I used H4 as a measuring device. Pretty much nailed 3x to the pip. image
HAC & RAC - A Simple-Minded Approach
- Almuten replied Dec 21, 2017
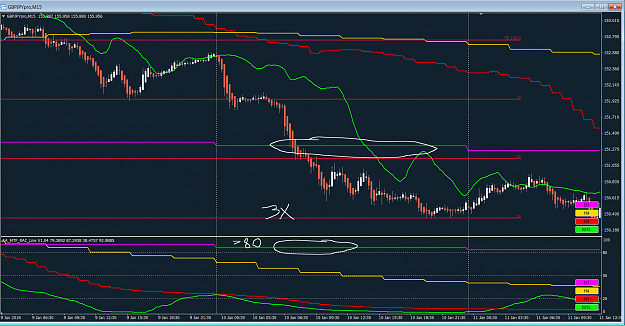
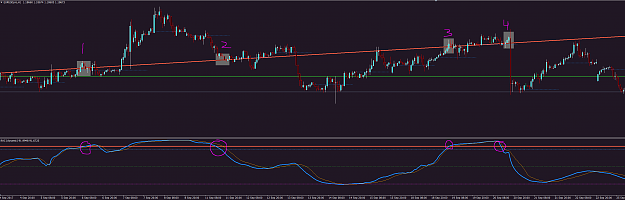
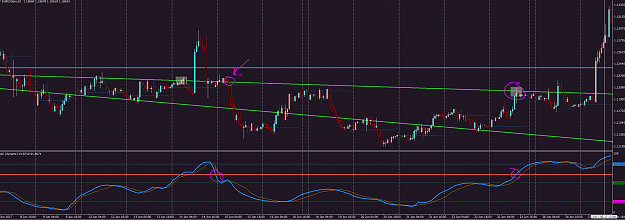
Hit #4 In this example, the TL was hit yet again, just as the RAC was crossing the key level. This is an extremely UNLIKELY event. image Now we can measure how far it ought to go. On a fresh run, the typical target is 3x. This one went much, much ...
HAC & RAC - A Simple-Minded Approach
- Almuten replied Dec 21, 2017
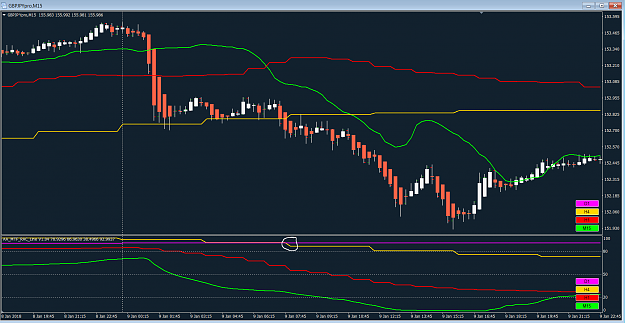
Now this part is really cool. It will confirm whether or not the trade is perfect; at least as perfect as could be expected. Now that we have the levels set up, I'm going to use H1 to find the setups. This time frame will make enough swings on a ...
HAC & RAC - A Simple-Minded Approach
- Almuten replied Dec 21, 2017
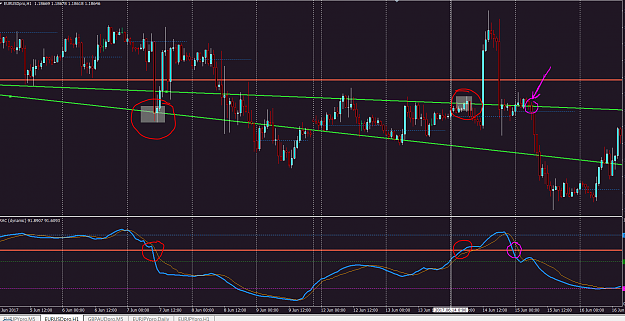
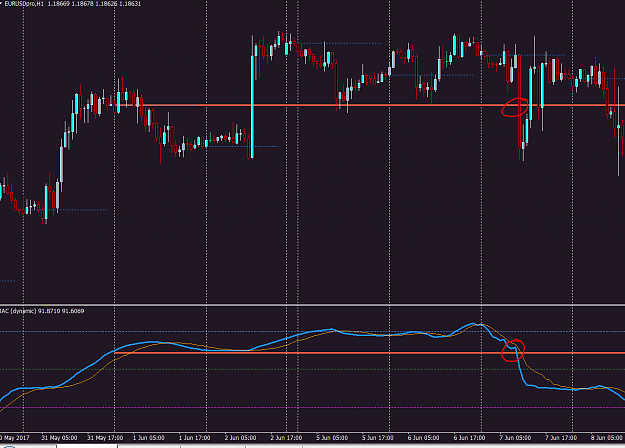
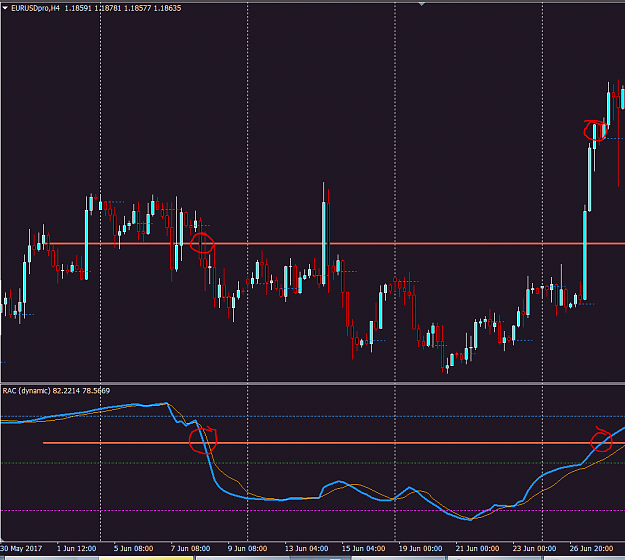
Now I change the chart to an H1. Just notice what happens with the RAC on that time frame crosses the level marked out by M5. image Also look at H4. Same kind of thing, only it happens later. image
HAC & RAC - A Simple-Minded Approach
- Almuten replied Dec 21, 2017
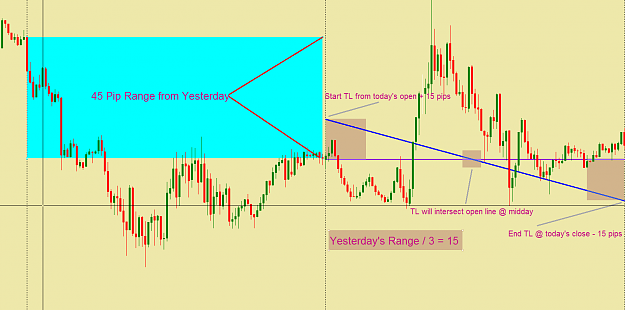
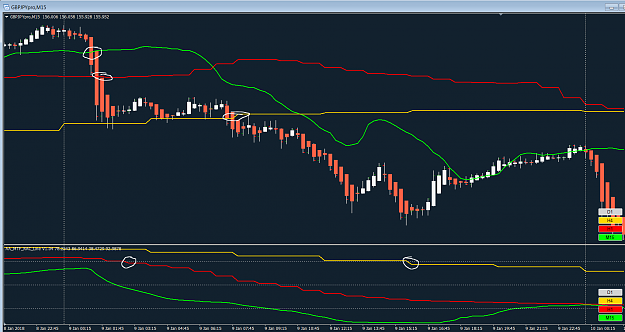
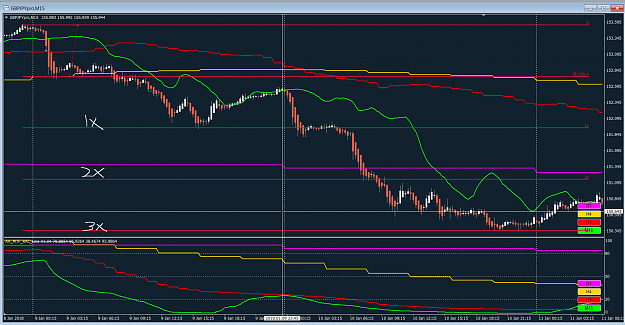
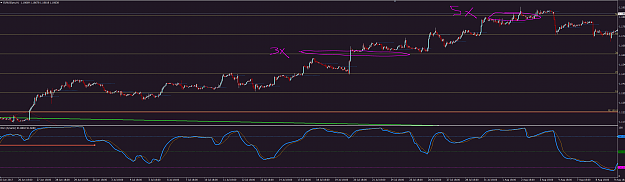
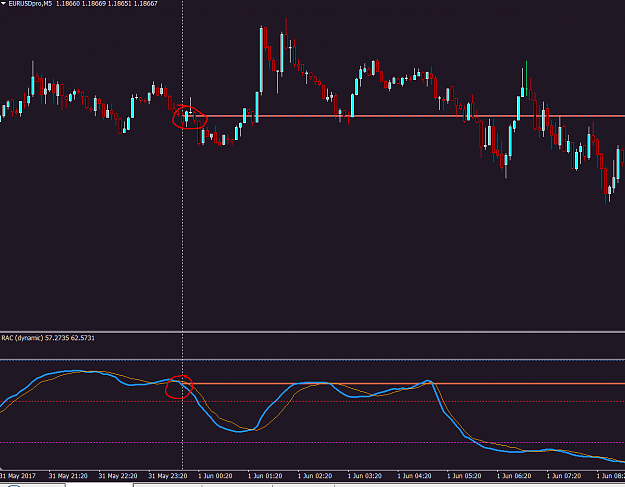
Now the next thing I want to show you is that the indicator can potentially be used to map out a month's worth of price movement using the first five minutes of the month. The RAC on the lower time frame will translate into significance on the ...
HAC & RAC - A Simple-Minded Approach
- Almuten replied Dec 21, 2017
RAC as a predictive tool for price: The logic behind this is that the smaller time frames will lead the larger; that patterns made in them will repeat in the larger structure. To obtain some idea of this I've been using the RAC indy to establish a ...
HAC & RAC - A Simple-Minded Approach
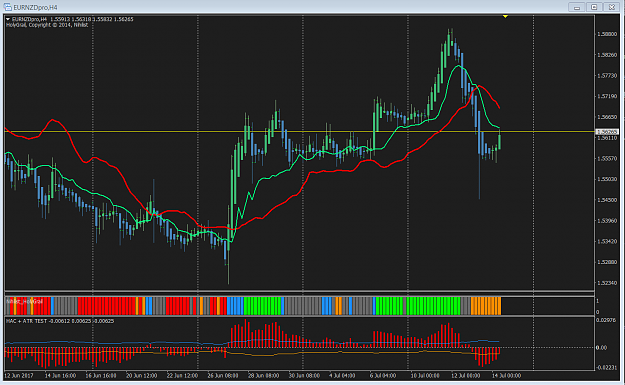
- Almuten replied Jul 14, 2017
Hi Timo, Over the last few months I've been readjusting my life to accomodate trading. I live in the United States and the best hours are of course during the London session. Problem was, my life was mostly conducted during the daytime. Fortunately ...
HAC & RAC - A Simple-Minded Approach