- Search Forex Factory
- 23 Results
-
 BenWarburton replied Jan 12, 2024
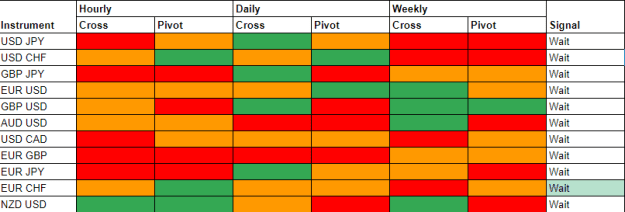
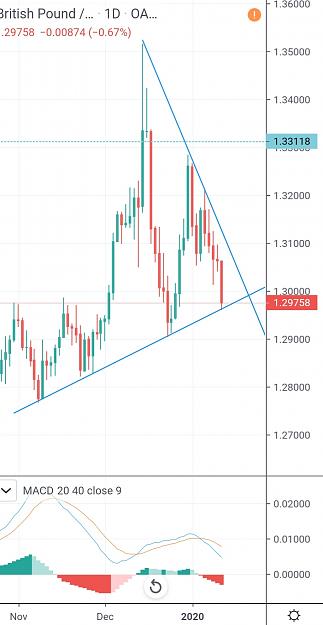
I post these on my personal trading thread daily. Feel free to take a look at it for some knowledge of my strategy. image As you can see, a lot of WAITING. For GPBUSD, I am aware of the current short-term up trend to the Weekly/Monthly R1 Pivot. ...
Cable Update (GBPUSD)

- BenWarburton replied Jan 12, 2024
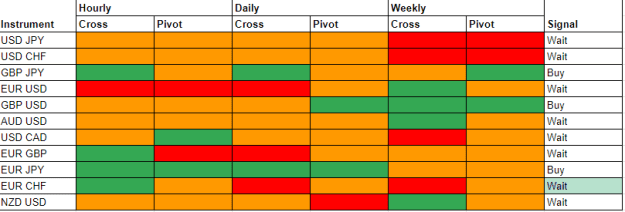
This is how it's looking right now. image I have further comments which I will keep to myself as I believe they reveal much more regarding the strategy. But as you can see - a LOT of waiting. The markets are generally trendy but I'm currently ...
Pivot to the Moon
- BenWarburton replied Jan 10, 2024
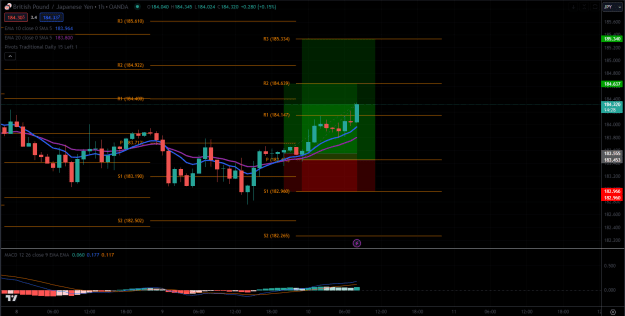
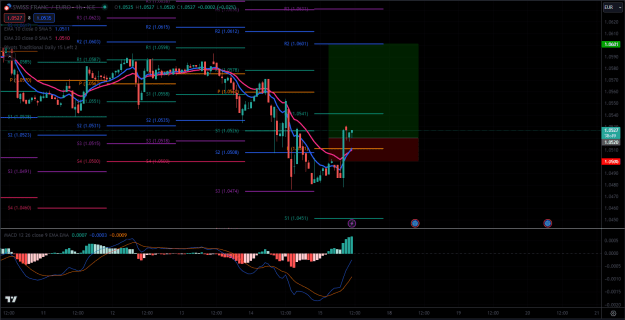
Hey Benjamin! It's a relatively simple strategy. Over 3 timeframes I check for an EMA and MACD cross in the same direction. Then I see where they relate to pivot points on each timeframe respectively. I plot them simply as such: image Green ...
Pivot to the Moon
- BenWarburton replied Dec 20, 2023
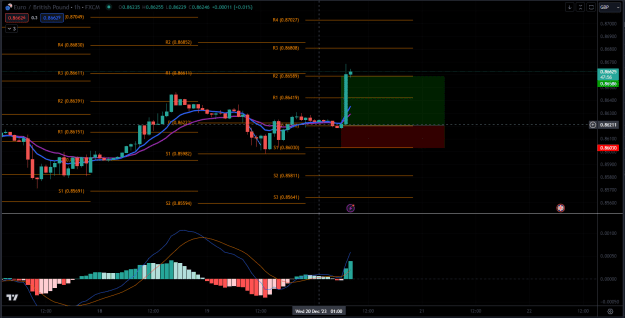
I'm taking about 5 trades/day and will only post one or two a day - not becoming a free signal service. This one blew up faster than expected. Symbol: EUR/GBP Sentiment: Long Price: 0.86282
Pivot to the Moon
- BenWarburton replied Dec 18, 2023
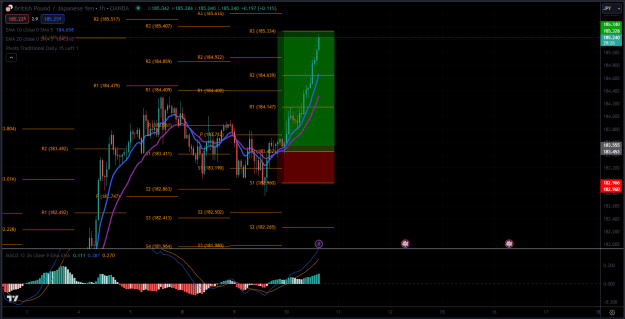
Back again with some fun moves of the week. I don't try to predict where the market is going - I see where it is going and I follow it (please don't reverse on me). In this case, the trend is upward and the fibs approve. Starting with: Symbol: ...
Pivot to the Moon
- BenWarburton replied Dec 15, 2023
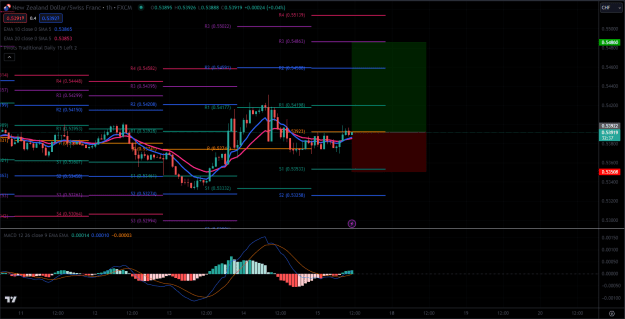
Symbol: NZD/CHF Sentiment: Long Price: 0.53917 Easy setups - again on the CHF upside.
Pivot to the Moon
- BenWarburton replied Dec 15, 2023
Symbol: CHF/EUR Sentiment: Long Price: 1.05278 Second trade, trying to get all my money in the market right now. Another trade against the EUR - I don't have any speculations, it is all price action.
Pivot to the Moon
- BenWarburton replied Dec 15, 2023
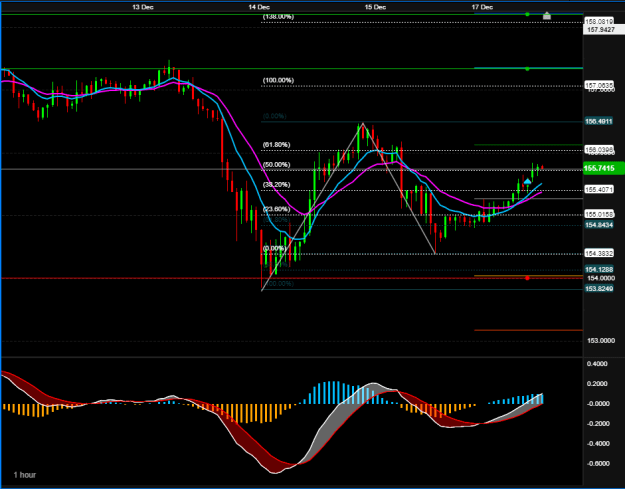
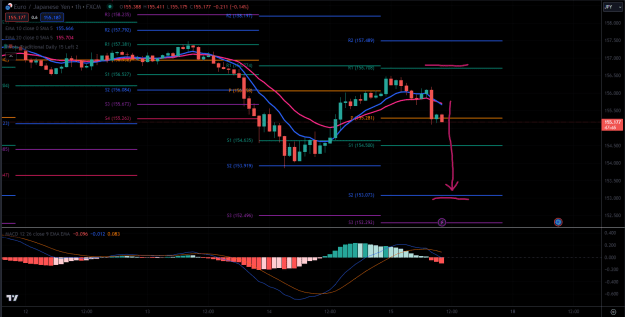
Symbol: EUR/JPY Sentiment: Short Price: 155.25 Trade #1 of this journey. My short signals are based on a series of crossovers within a day. Breaking of key pivot points reveals an intention to continue in a given direction.
Pivot to the Moon
- BenWarburton replied Jul 9, 2020
Don't you love it when a good plan comes together? image Called both these positions two days ago and it's wonderful to see patience pay off
Cable Update (GBPUSD)
- BenWarburton replied Jul 8, 2020
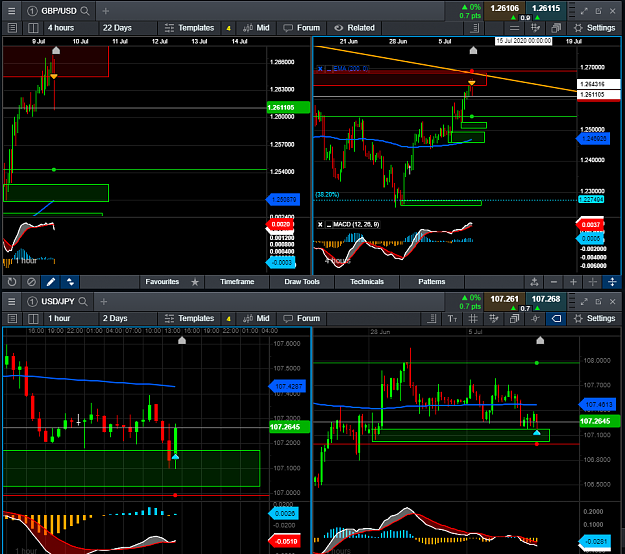
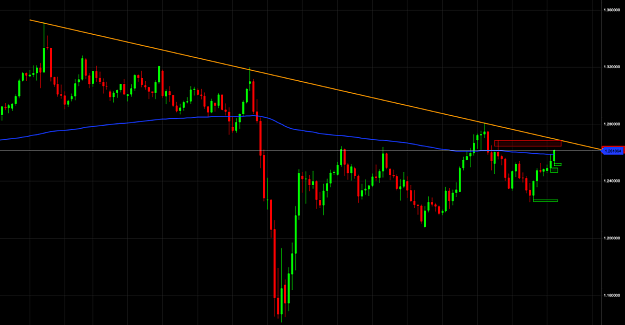
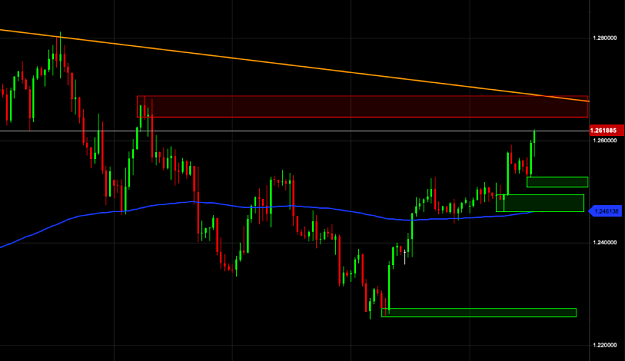
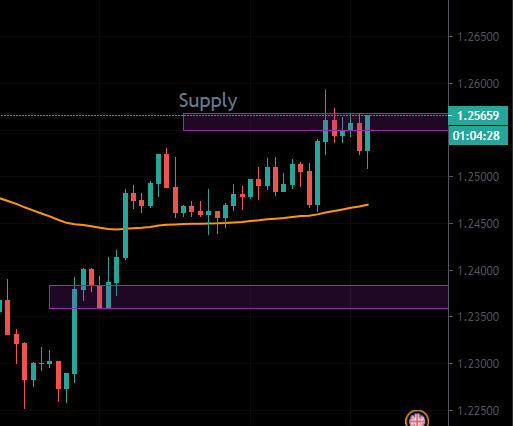
Strong trend line down (the orange one) on the daily chart... looking to hit it tomorrow, if not then Monday. image Furthermore, the 4H chart illustrates an area of supply (red box) which is close to being hit. If the stars align and both are hit ...
Cable Update (GBPUSD)
- BenWarburton replied Jul 8, 2020
Thinking of having a cheeky short as supply level here on the H4 chart. Previous bearish engulfing candle and plenty of volume at this level. Not selling but could possibly tp at 1.247, breaking that to 1.236.
Cable Update (GBPUSD)
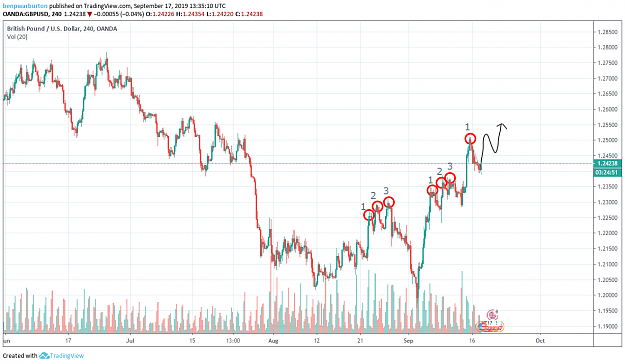
- BenWarburton replied Sep 19, 2019
Possibly looking for a third peak. Might be on Monday but won't be surprised if GU pushes to 1.254 soon.
Cable Update (GBPUSD)
- BenWarburton replied Sep 18, 2019
It's right here mate
Cable Update (GBPUSD) Already took profits off another so in all its a 2.2k trade!

- BenWarburton replied Sep 17, 2019
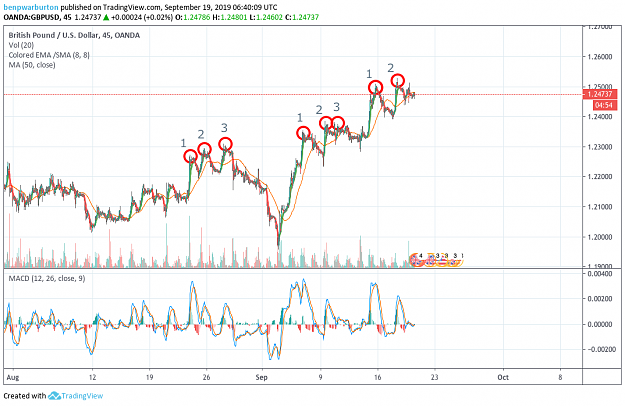
Seeing a possible pattern for future trades.
Cable Update (GBPUSD)
- BenWarburton replied Sep 17, 2019
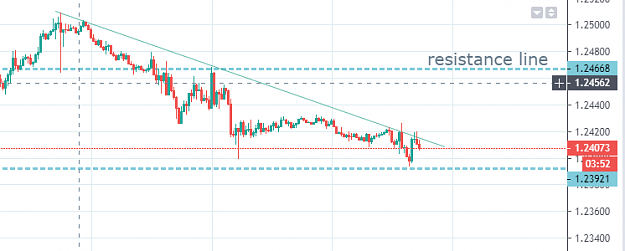
Respecting downward trend. Possible breakout but its respecting.
Cable Update (GBPUSD)

- BenWarburton replied Sep 17, 2019
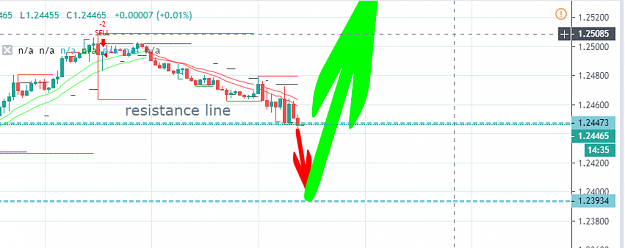
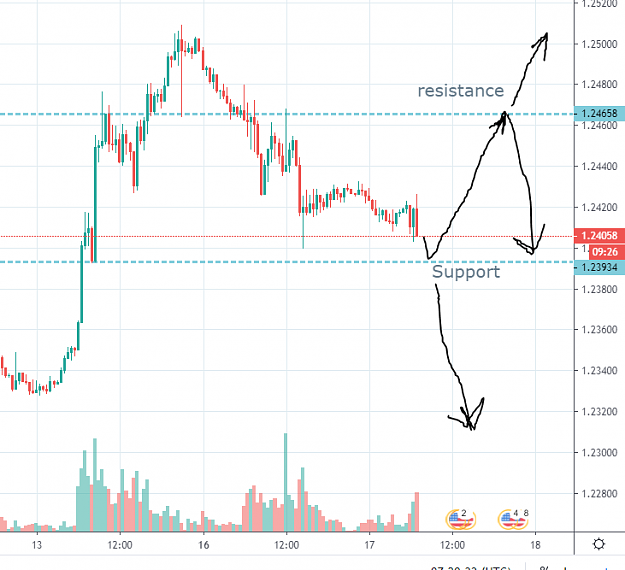
Possibility of bouncing off the 1.239 support level. This would be an important point to illustrate future bullish or bearish moves. With the american news, I see some quick drop in cable but will only be a good spot to buy low. I foresee cable ...
Cable Update (GBPUSD)
- BenWarburton replied Sep 16, 2019
If cable breaks through first support line, it will bounce off second and continue the bullish trend. (graph says resistance but means support)
Cable Update (GBPUSD)