- Search Forex Factory
- 179 Results (2 Threads , 177 Replies )
- Bushy replied Mar 24, 2023
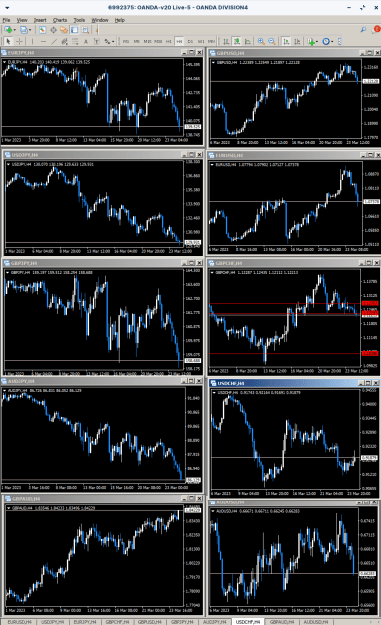
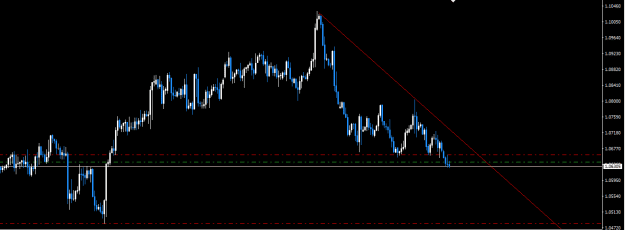
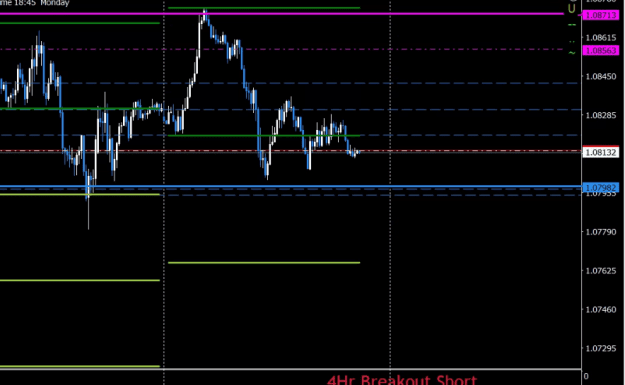
Stuff this, I can't be doing this, I just can't get the discipline...... 4hr chart, it's a piece of cake, longer term trading. Short on GBPCHF image
Forex intraday using the 5min chart: EURUSD
- Bushy replied Feb 26, 2023
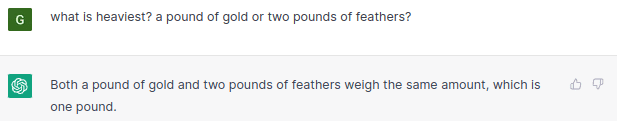
I wouldn't pin my hopes on it.... image
Chat GPT generated code not working in the backtester
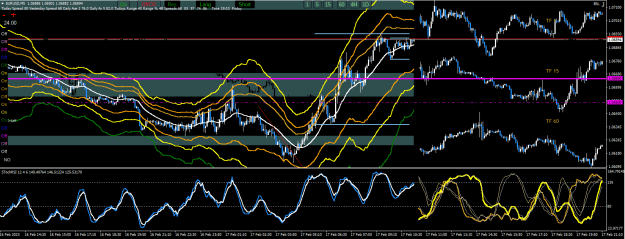
- Bushy replied Feb 17, 2023
Ok, here's what I've arrived at, my final system that I will use to go live and give this thing my best shot, the main reason for the Stochastic is to stop my early entries, and I'm sure it works for me, I might just spend a days programming see if ...
Forex intraday using the 5min chart: EURUSD
- Bushy replied Feb 9, 2023
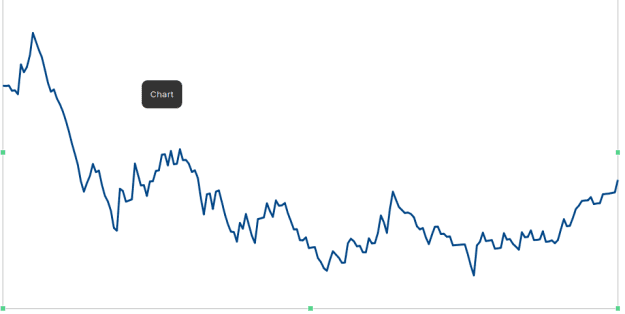
ABSOLUTELY FASCINATING.... I don't know about you guys but I find this absolutely fascinating to the point of freay even, kind of looking at yourself in a mirror in an odd way. This is a graph of my running total on my account, I thought it would be ...
Forex intraday using the 5min chart: EURUSD
- Bushy replied Feb 9, 2023
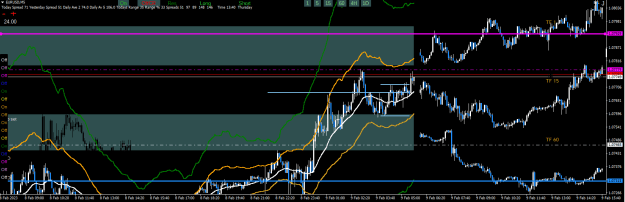
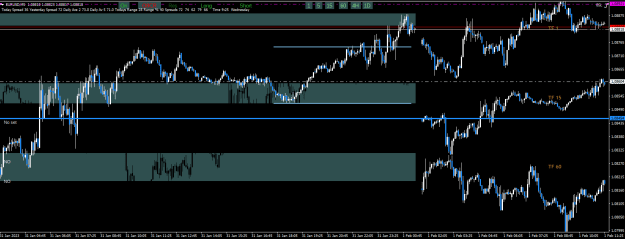
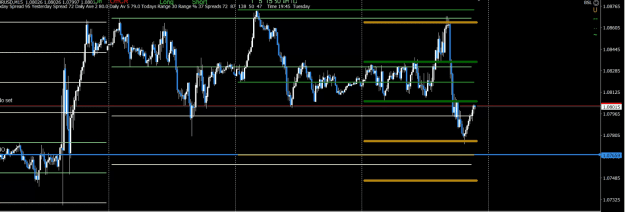
And down then up to the top zone again where there is high likelihood it will break up further. image @pgidia no problem, I'll load the lot up to make sure they are the latest versions file
Forex intraday using the 5min chart: EURUSD
- Bushy replied Feb 9, 2023
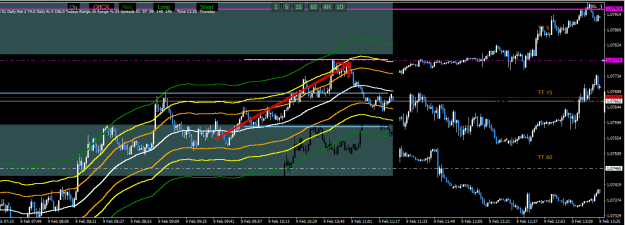
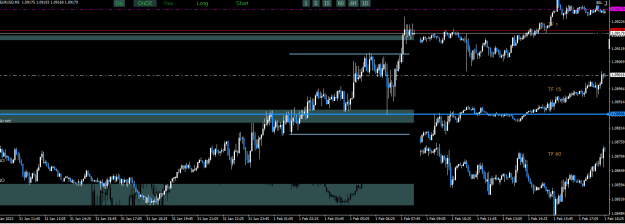
Zone to zone, done for the week, about 8% on the week, quit while ahead, happy days. image
Forex intraday using the 5min chart: EURUSD
- Bushy replied Feb 8, 2023
Nothing doing today really, tried a couple of shorts, edged a tiny profit. Indicator showing it's worth though, from under the top zone to under the bottom thin zone. I have a tiny account, but in percentage terms I'm up 25% in 3 weeks, so pretty ...
Forex intraday using the 5min chart: EURUSD
- Bushy replied Feb 7, 2023
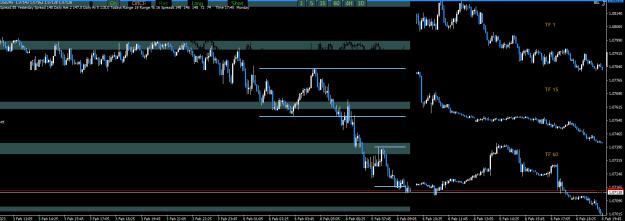
Triangle, break of zone, short, don't look a gift horse in the mouth, See the triangle on the 15m, then breaks that zone and goes way past down the next zone, I just knew it would spring back up, you gotta think 'Composite Man', but that's by the ...
Forex intraday using the 5min chart: EURUSD
- Bushy replied Feb 6, 2023
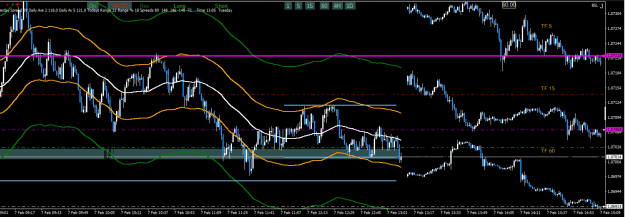
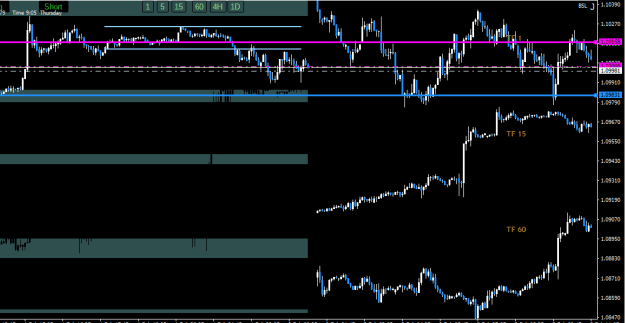
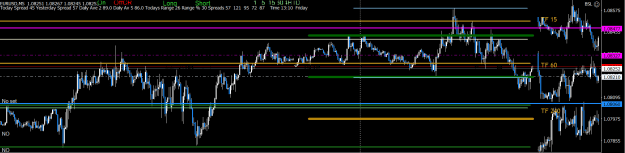
My focus was on the hourly chart, the consistent lower highs in a nice curve = price action indicating short, then the indicator shows where with the levels. image
Forex intraday using the 5min chart: EURUSD
- Bushy replied Feb 2, 2023
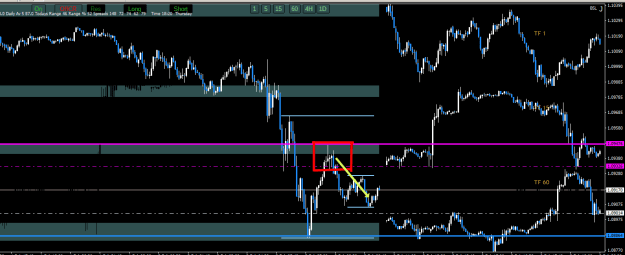
I took this trade this morning. Lower Highs on 1hr, expect next candle to do the same. 4 Hr Low as resistance The red line I've put in but that is a short sign, look at it as a triangle.. Took profit at top of grey bar, could have had a bit more if ...
Forex intraday using the 5min chart: EURUSD
- Bushy replied Feb 1, 2023
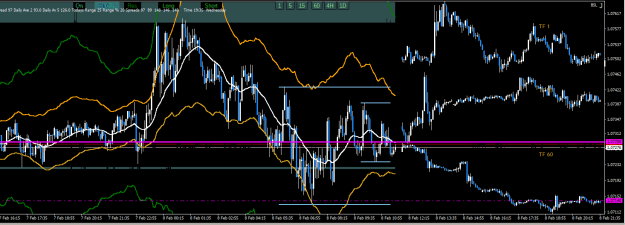
I'd say it does a decent job of highlighting levels, difficult market today though, and tomorrow and Friday, so stay out is probably best bet for the rest of the week..... but we'll see.... image
Forex intraday using the 5min chart: EURUSD
- Bushy replied Feb 1, 2023
Trading Zones & Gaps. image How to eat Elephants? For those of you not familiar with the saying, the answer is to break it up into little bits, So spending endless hours running the strategy going through months of charts at a time, first I ...
Forex intraday using the 5min chart: EURUSD
- Bushy replied Jan 24, 2023
Tested my strategy through the tester, and getting some pleasing results, managed to run through 2 weeks trading or so in a couple of hours, all running smoothly, will post updates of the indicators next couple of days. I attach the chart I used, ...
Forex intraday using the 5min chart: EURUSD
- Bushy replied Jan 20, 2023
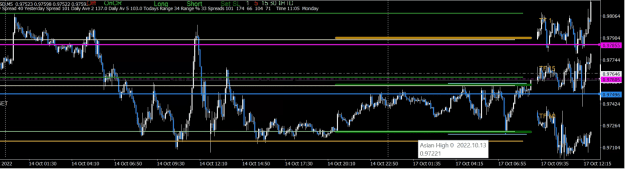
Thanks, yes, I've got it pretty much under control, it's only when I encounter something new that I think will help my trading, I get over-excited and try it this way and that way, cool calm and collected this morning, took a short from Asian High ...
Forex intraday using the 5min chart: EURUSD
- Bushy replied Jan 17, 2023
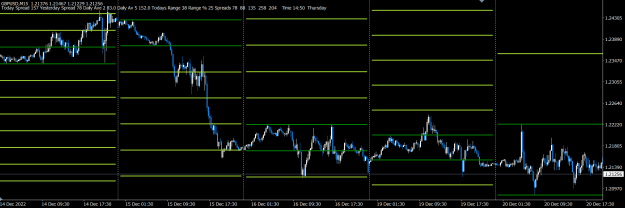
Added past 3 days Asian levels extended to first candles. image file
Forex intraday using the 5min chart: EURUSD
- Bushy replied Jan 16, 2023
As it happened, cracking example on EU15, if that appeared coming into the NY session, you have a very high probability trade, as it is, who know by morning.... image
Forex intraday using the 5min chart: EURUSD
- Bushy replied Jan 16, 2023
Here's one of the thoughts behind the levels.... If we strip it all down, as in, you get up in the morning (London Open) start with a clean chart, what's the first 2 lines your going to put on it 90%+ of the time? It's going to be the AH and AL, so ...
Forex intraday using the 5min chart: EURUSD
- Bushy replied Jan 12, 2023
Rewritten levels indicator for history
Forex intraday using the 5min chart: EURUSD