- Search Forex Factory
- 77 Results
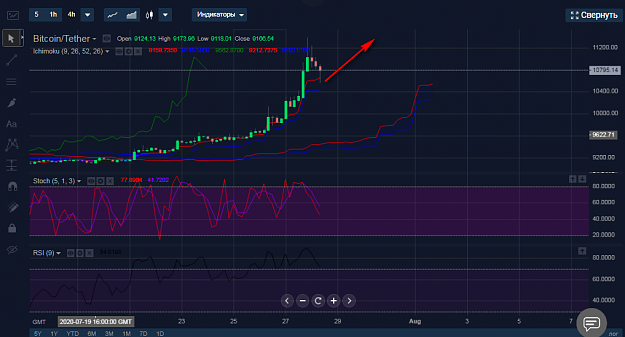
- CassandraK replied Jul 28, 2020
On the H4 timeframe, the trend is up. Now there is a rollback with a puncture of the Tenkan line and almost to the Kijun line. The best time to join the trend with little risk. After breaking the maximum of 11400, I will increase the lot. image
Bitcoin technical analysis
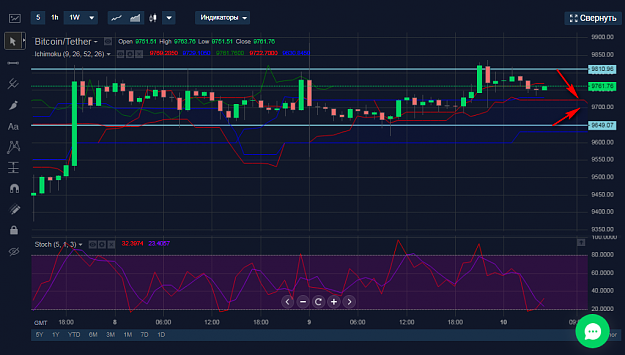
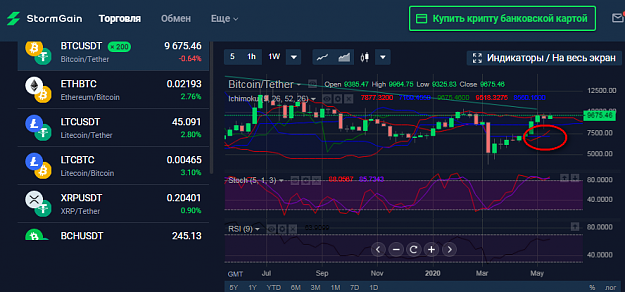
- CassandraK replied Jun 10, 2020
Bitcoin moves in the range of 9650-9800. I received a trading signal, to sell if the price is below 10.000. I think I can sell if the price rises closer to 9800. Now selling is risky.
Bitcoin technical analysis
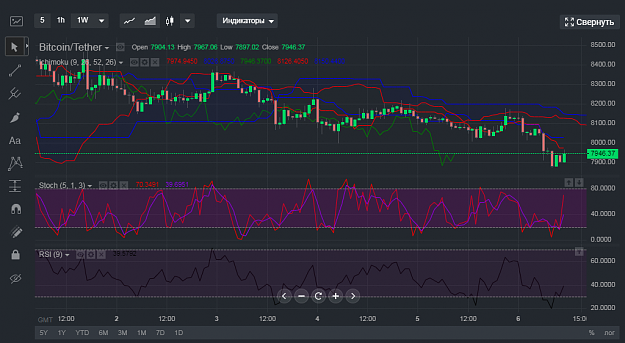
- CassandraK replied May 26, 2020
Bitcoin is moving down to support 8000. There is a Tenkan line there. Recently there was an intersection of Tenkan and Kijun, indicating a trend up. I want to buy from 8000 support. image
Bitcoin technical analysis
- CassandraK replied May 18, 2020
Analysis on the Ichimoku indicator. Tenkan crosses Kijun from bottom to top. This is a buy signal. In addition, last week formed a hammer candle, which is also in favor of the bulls. I really want to buy.
Bitcoin technical analysis
- CassandraK replied Oct 6, 2019
I'm sitting on the weekend trading Bitcoin.Nothing else is being traded. And it’s convenient for me today, on the weekend. This is not really for the dollar. Tether is pegged to the dollar. Can I publish a forecast for Tether? The trend for H1 is ...
Bitcoin ideas and charts
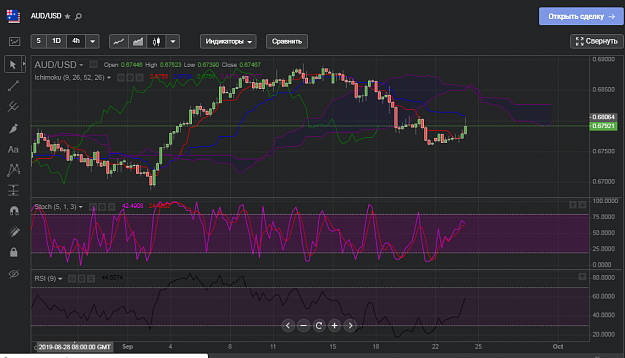
- CassandraK replied Sep 24, 2019
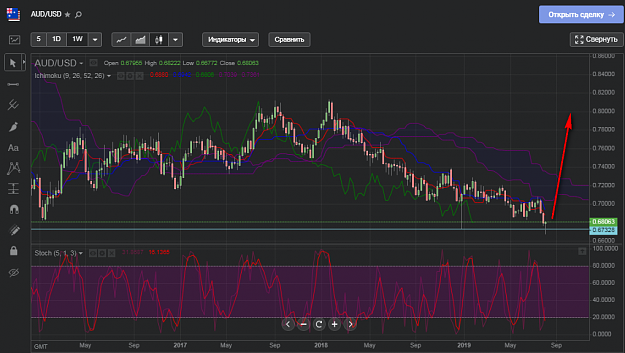
AUD / USD has touched the Kijun line and is bouncing off of this. The trend is down. Tenkan, Kijun and the cloud are arranged in order. Stochastic moved upward at a weak angle and went above 50. We have a downward trend, resistance is the Kijun ...
AUD/USD
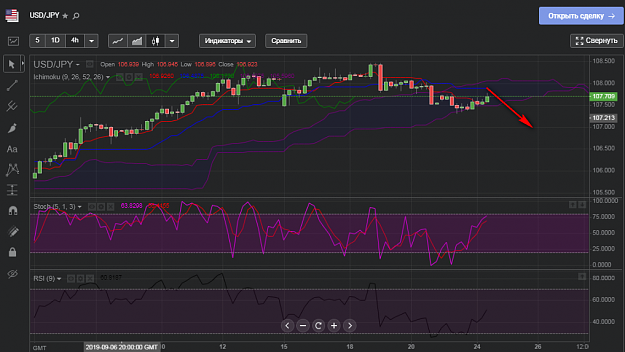
- CassandraK replied Sep 24, 2019
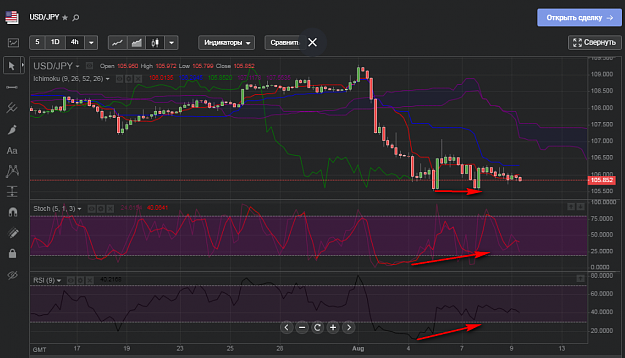
USD / JPY is moving towards the Kijun line, it is blue on the chart. Stochastic has already reached 80 and is ready to move down. Time to sell. Н4
USD/JPY Discussion
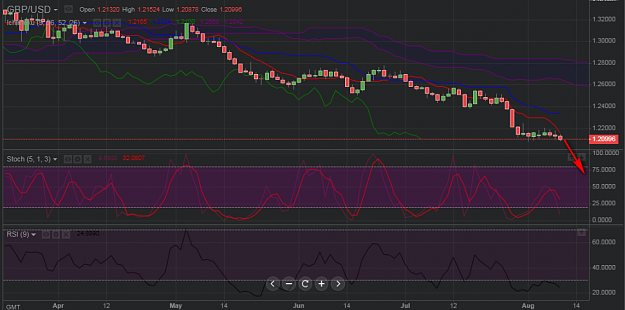
- CassandraK replied Sep 24, 2019
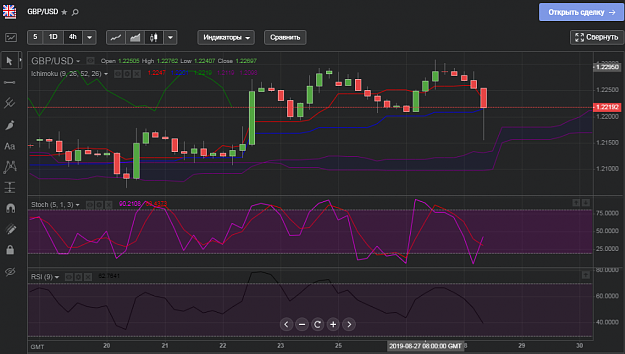
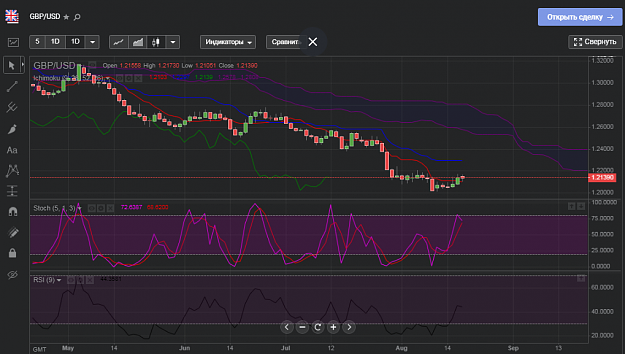
GBP / USD fell on the Ichimoku cloud, from which it can ward off. There is a "golden cross" - a signal to buy. The Tenkan line crossed the Kijun line from bottom to top. Stochastic has fallen almost to level 20. daily
Cable Update (GBPUSD)
- CassandraK replied Sep 24, 2019
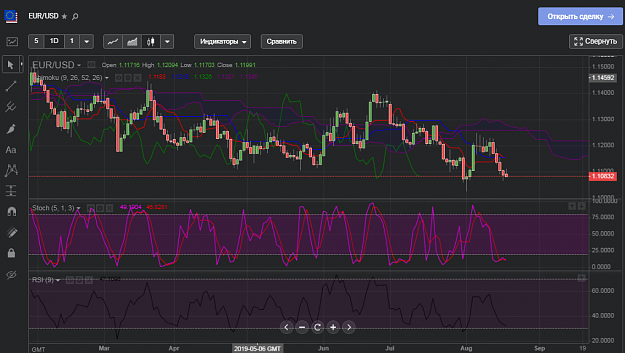
EUR / USD after the breakdown of important support 1.0990 rolled back to the broken level. Stochastic has risen above the 50 mark, and is ready to move down. The trend is down, as Ichimoku shows the "parade of three lines" Tenkan, Kijun and the ...
EURUSD
- CassandraK replied Aug 28, 2019
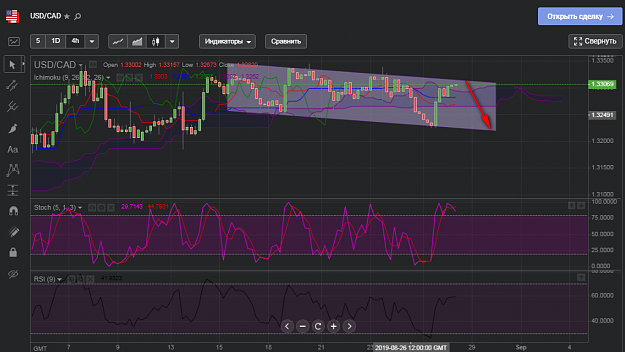
I think I drew the channel for USD / CAD correctly and now you can sell the pair from the upper border. Stochastic and RSI are overbought, there is no upward trend. I look at the trend in Ishimoku. Now the Tenkan and Kijun lines are inside the ...
USD/CAD
- CassandraK replied Aug 28, 2019
Curious if GBP / USD will close above the Kijun blue line or below it? My further actions depend on this. If GBP / USD breaks through support, then we need to sell. And if it closes over support, and even a hammer-type candle, then you should ...
Cable Update (GBPUSD)
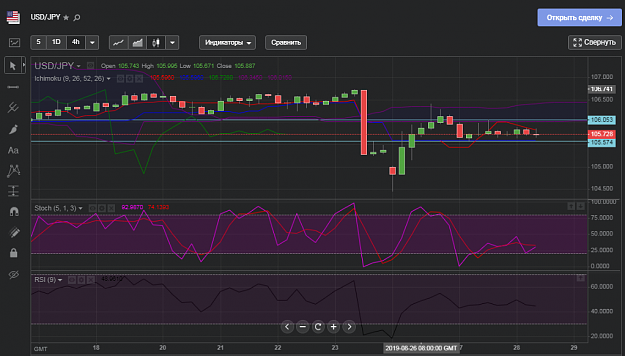
- CassandraK replied Aug 28, 2019
The support for USD / JPY is now the level of 105.57, and the resistance is 106.08. With the breakdown of any of them, the movement that has begun will be further developed. Therefore, I propose to place orders for the breakdown. Н4
USD/JPY Discussion
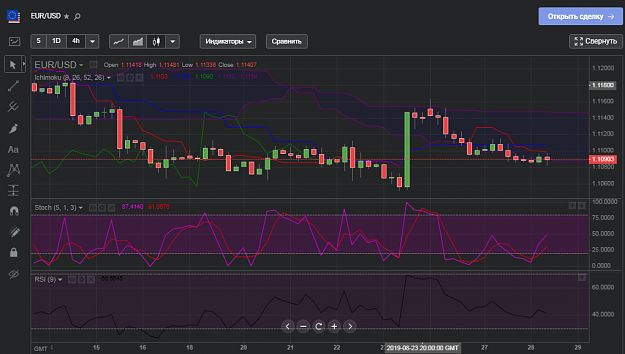
- CassandraK replied Aug 28, 2019
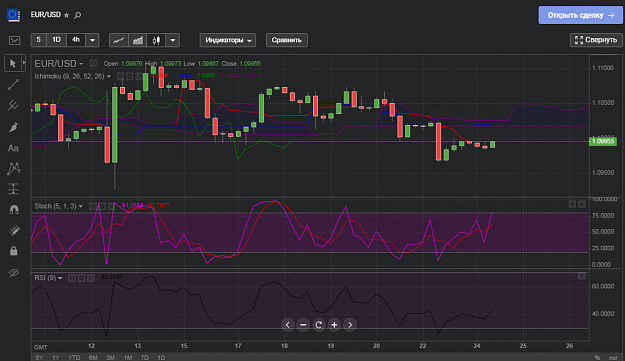
The red line of Tenkan crossed the blue line of Kijun from top to bottom. This is a signal for sales. EUR / USD is moving under Tenkan and Kijun, there is no support. Stochastic has come out of the oversold zone and can now be opened short. Н4
EURUSD only
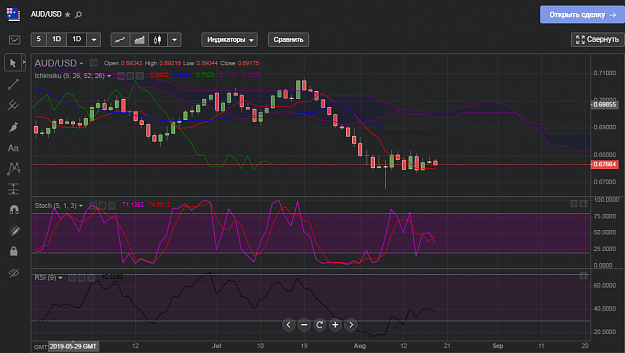
- CassandraK replied Aug 19, 2019
I have been waiting for the AUD / USD reversal for a long time. Now AUD / USD has fixed above the red Tenkan line. Stochastic moves below. I hope AUD / USD reaches the blue line of Kijun. There are no other resistances. I also note that the Tenkan ...
AUD/USD
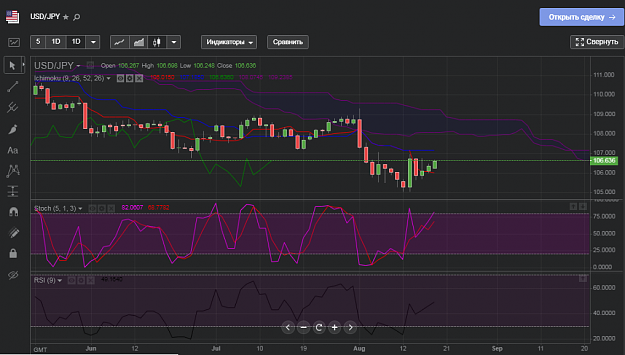
- CassandraK replied Aug 19, 2019
It entrenched above the Tenkan red line. Obviously, USD / JPY is moving towards the Kijun blue line. Stochastic is already close to 80. A rebound from the Kijun blue line is possible. USD / JPY will be in channel 105-107 for now. Daily
USD/JPY Discussion
- CassandraK replied Aug 19, 2019
GBP / USD and up against the euro. Stochastic and RSI show divergence. Price closed above the Tenkan red line. So GBP / USD will move to the Kijun blue line at 1.2300 or higher. Daily
Cable Update (GBPUSD)
- CassandraK replied Aug 19, 2019
EUR / USD is moving down. After yesterday's hammer bar, today's bar closed lower, with its tail pointing up. The Tenkan line is preparing to cross the Kijun line from top to bottom. Stochastic is already oversold, so I think EUR / USD will not move ...
EURUSD only
- CassandraK replied Aug 9, 2019
USD / JPY is preparing to turn up. Oscillators show ugly and irregular divergences. Which meanwhile can work. USD / JPY cannot overcome the support of 105.53, but also cannot stay above the Tenkan line. Н4
USD/JPY Discussion
- CassandraK replied Aug 9, 2019
AUD / USD has reached the bottom of its global channel. Below 0.6800, they began to buy it in large volumes. Therefore, a reversal to 0.7000 and higher is now possible. Weekly
AUD/USD
- CassandraK replied Aug 9, 2019
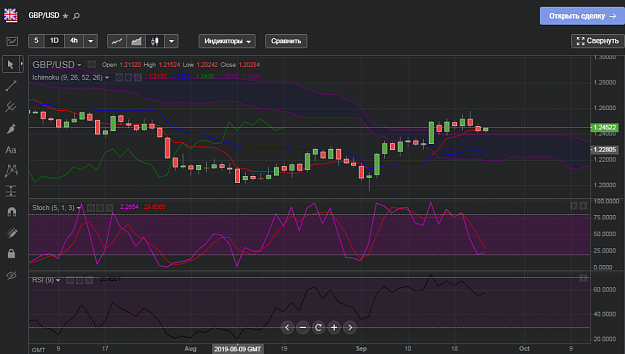
GBP / USD beats off the Tenkan line down. Stochastic is above 20 and is ready to move down. The trend is directed downward, all the lines of Ichimoku are arranged in the order of periods precedence. I think you need to sell. Daily
Cable Update (GBPUSD)