- Search Forex Factory
- 106 Results (4 Threads , 102 Replies )
-
 FiatFap replied Feb 13, 2014
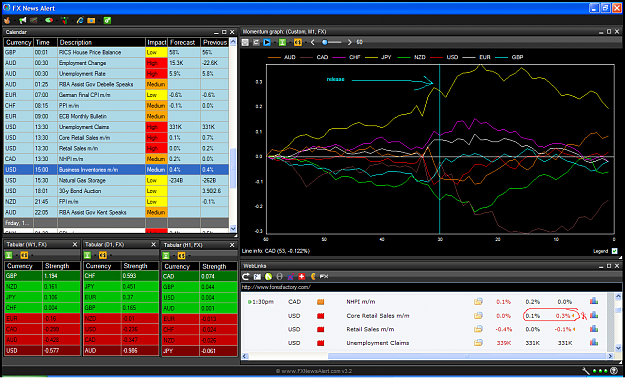
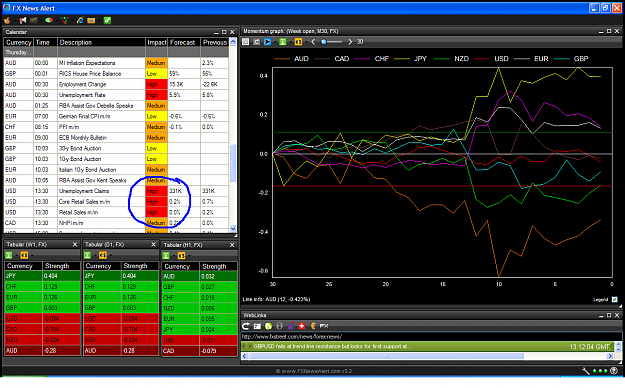
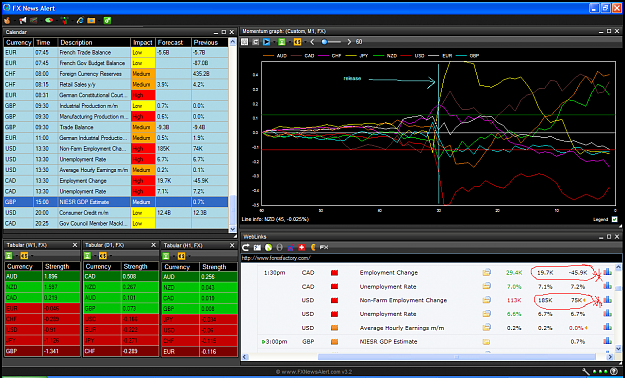
Thursday - 3 high impact events image Very subdued market move(s); dollar (red line) spiked down before the news but then came back to unch @ hour candle open price, i.e. 0% momentum.
High impact news releases and market impact
- FiatFap replied Feb 10, 2014
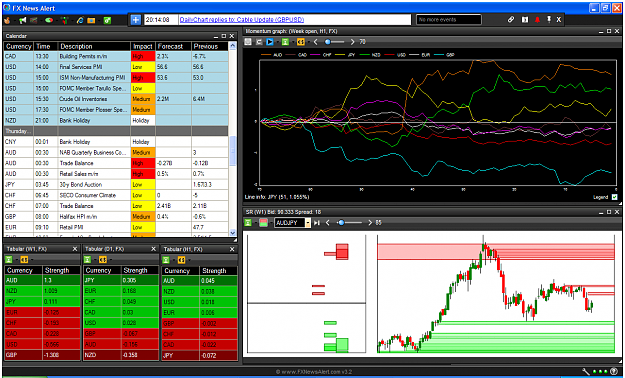
Next event: Thursday @ 13:30 GMT Only one cluster this week, i.e. three or more high impact events at the same time. Market has begun the week with a risk-off sentiment as AUD & NZD weaken and yen strengthens; USDJPY still holding 102 level. image
High impact news releases and market impact
- FiatFap replied Feb 7, 2014
Friday - 4 high impacts image
High impact news releases and market impact
- FiatFap replied Feb 6, 2014
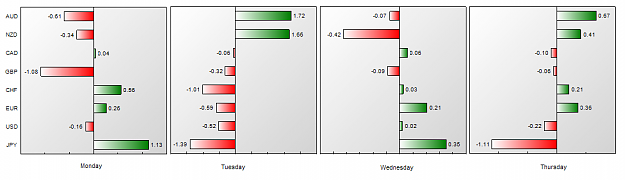
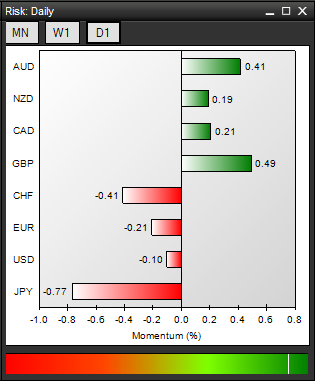
FUBAR market machinations Below pic shows the momentum for each currency at the end of day this week. Notice how the yen has swung to extremes on each consecutive day. GBP is the only one that's had the same sentiment all week, albeit a marginal ...
AUD/JPY
- FiatFap replied Feb 5, 2014
I've been thrown into the commercial section even though the app has been free for almost 3 years, but i have to thank Twee for his help to remove my commercial member status, I'm still just a grunt spewing my diatribe here and there on the forums. ...
FXNewsAlert ver3 - Signals, Strength and News
- FiatFap replied Jan 27, 2014
It's funny that we posted currency momentums at the same time
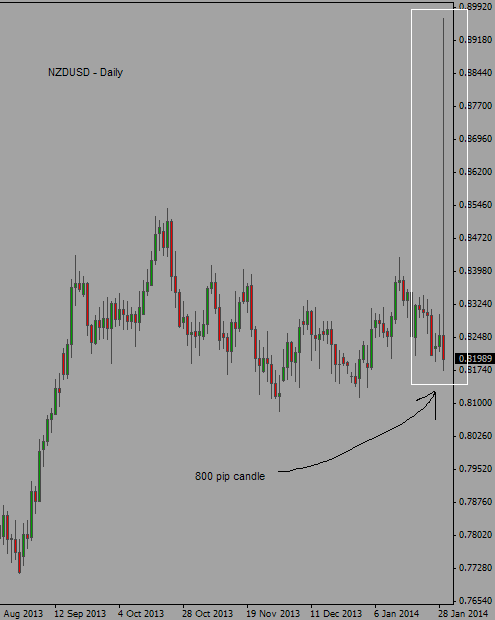
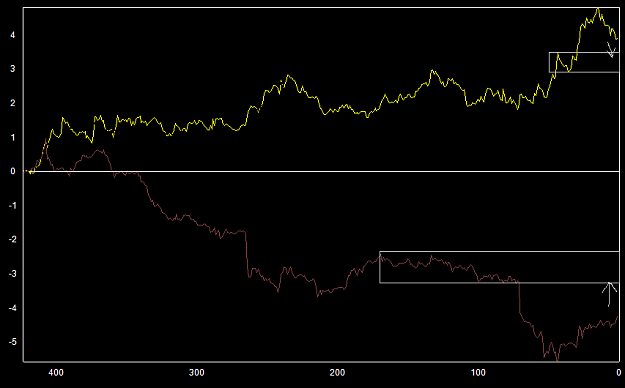
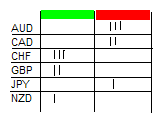
Where is current FX price relative to historical range? CAD (brown line) & JPY (yellow line) split currencies - momentum since month open image If we look at month open candle closes for split pairs CAD & JPY, we can see there's a short ...
- FiatFap replied Jan 27, 2014
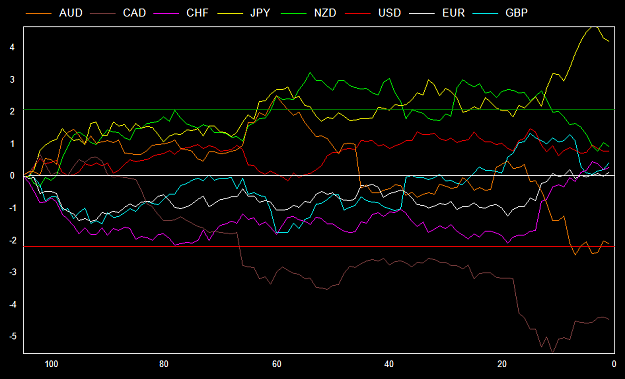
Momentum for base/quote currency pairs since month open image CADJPY - Weekly image You could scalp CADJPY buys. From above currency comparison, JPY is the highest and CAD the lowest but if you look at the weekly chart, it's testing the bottom ...
Where is current FX price relative to historical range?
- FiatFap replied Jan 27, 2014
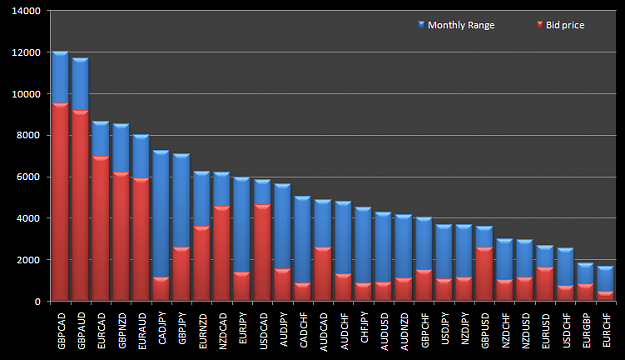
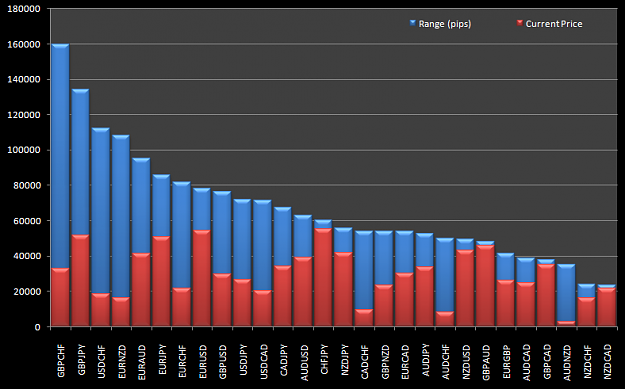
Modified the code to analyse just the current monthly candle. It now gets the hilo range for each monthly candle across 27 FX pairs and then determines how far from the low each bid price sits within the candle... image Can see that GBPCAD has had ...
Where is current FX price relative to historical range?
- FiatFap replied Jan 25, 2014
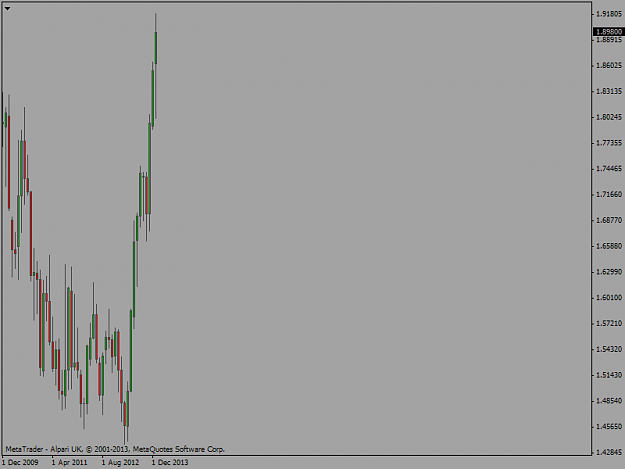
My GBPAUD only shows 49 candles on monthly; i'll try downloading historical data from metaquotes, thanks for pointing out the discrepancy. GBPAUD - Monthly image Edit: Just downloaded monthly from history centre and here's updated chart. I need to ...
Where is current FX price relative to historical range?
- FiatFap replied Jan 25, 2014
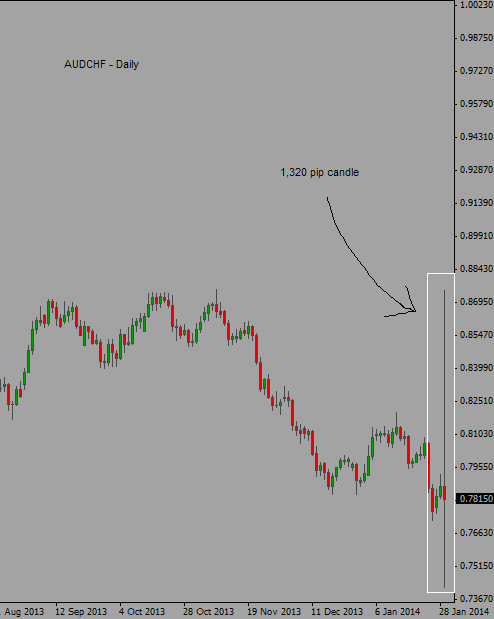
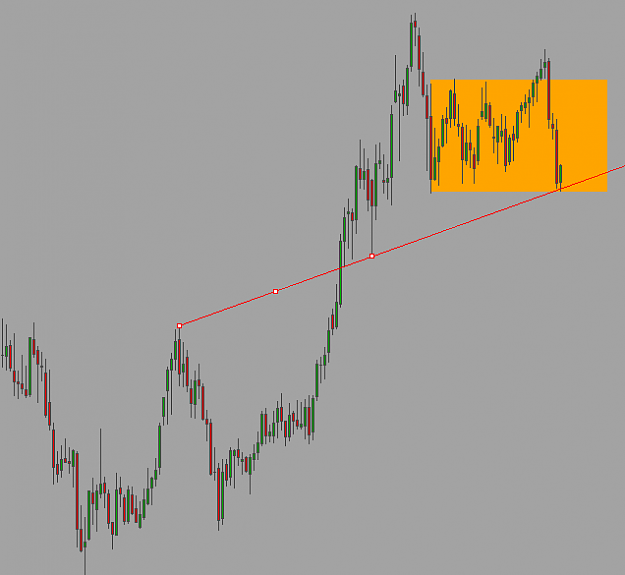
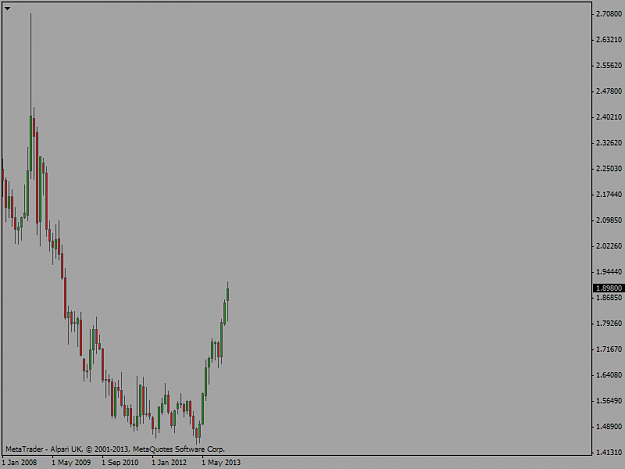
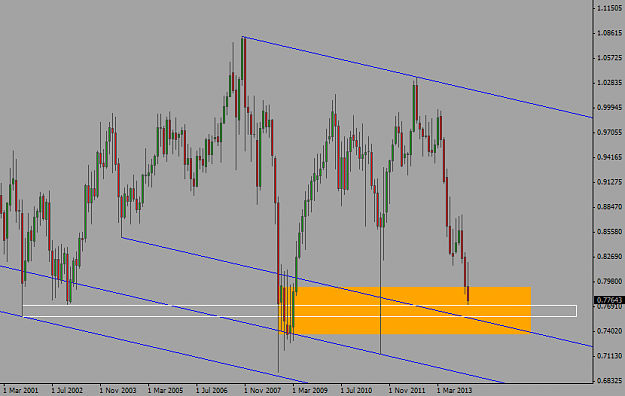
It seems price is currently testing support from 2001 / 2002 (white box), which sits inside the previous consolidation at the last fractal low (orange box). There's no denying these big red monthly candles on AUDCHF as the swiss franc is seen as a ...
Where is current FX price relative to historical range?
- Where is current FX price relative to historical range?Started Jan 25, 2014|Trading Discussion|22 replies

I was playing around with monthly charts and wanted to see where price sat within its all-time ...
- FiatFap replied Jan 21, 2014
Bigger picture analysis; don't get me wrong, i think cable will tank like a sack-of-shit...but when is the question? Need to hit those sell stops above to create demand. GBPUSD - Monthly image
Cable Update (GBPUSD)
- FiatFap replied Jan 21, 2014
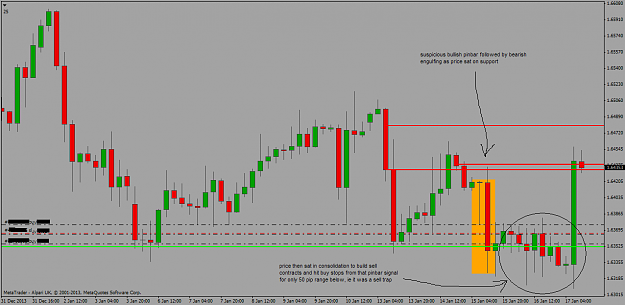
Also, there's another nice trap area on 4hr from last week, but price is now sitting above this previous trap zone, so which side won that battle? GBPUSD - 4hr image
Cable Update (GBPUSD)
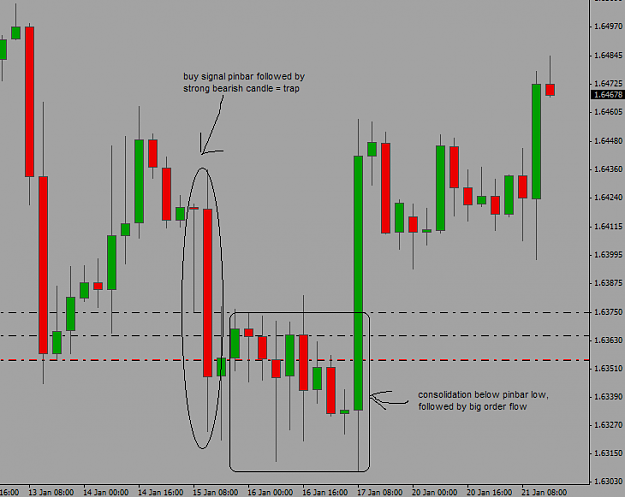
- FiatFap replied Jan 21, 2014
I can see the pinbar trap followed by bearish engulfing, but the very next candle is quite telling - it painted deep back into the initial trap zone; why would it do that? Did buyers get punished? What did price do after? Where is price now? GBPUSD ...
Cable Update (GBPUSD)

- FiatFap replied Jan 20, 2014
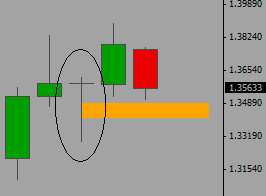
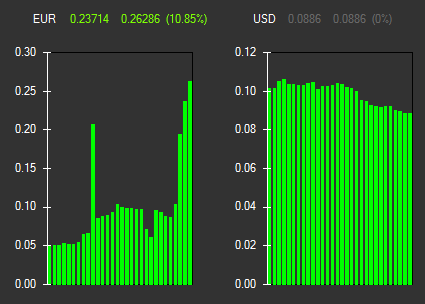
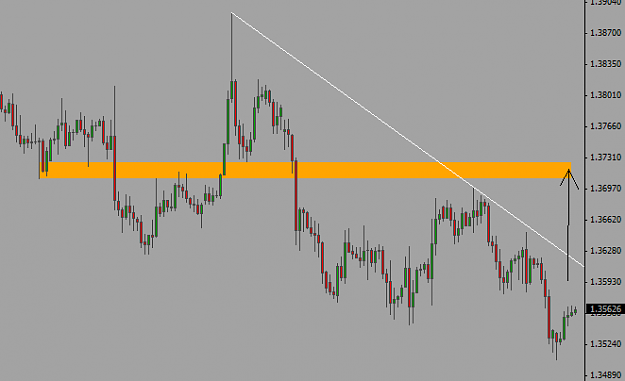
EURUSD could pop this week... Lots of positive news this week image Rates have been spiking image Monthly pinbar - retraced but not quite touched candle fib zone image EURUSD - 4hr Short term target @ 1.37 image
EURUSD

- FiatFap replied Jan 17, 2014
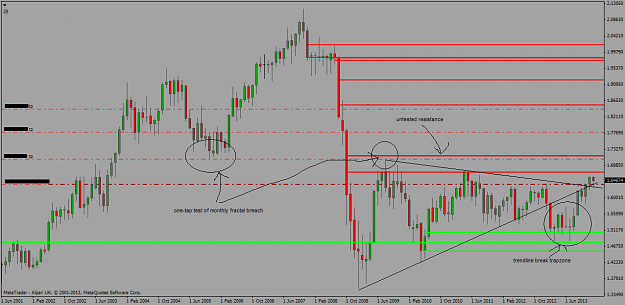
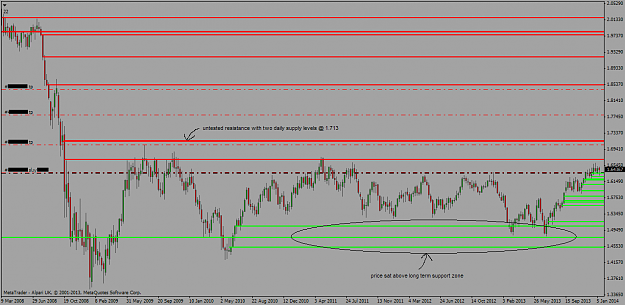
I think GBP will tank fast (carney doing more QE to debase) and play out its second elliot wave from 2008 monthly down leg, but not until it’s consumed all the sellers with a push up towards 1.71, which is an important untested monthly fractal pivot ...
Cable Update (GBPUSD)
- FiatFap replied Jan 15, 2014
That was quick & brutal: GBPAUD 1hr image
Strat's Long Term Stress Free Trading
- FiatFap replied Jan 15, 2014
If you drop down to 1hr, there's some bullish subtle signals: GBPAUD - 1hr image
Strat's Long Term Stress Free Trading
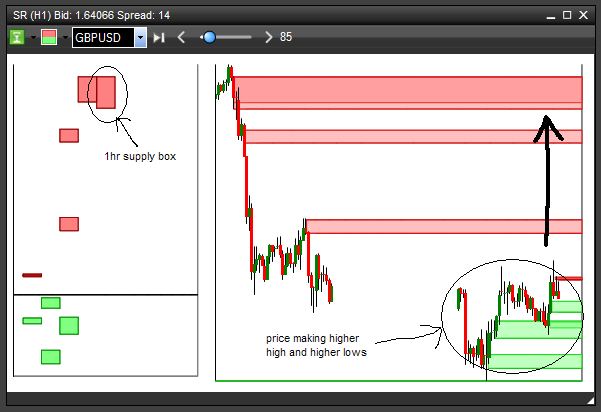
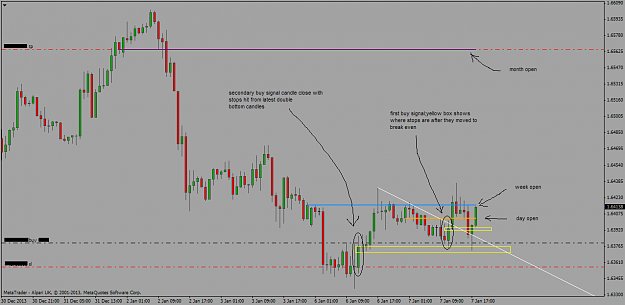
- FiatFap replied Jan 7, 2014
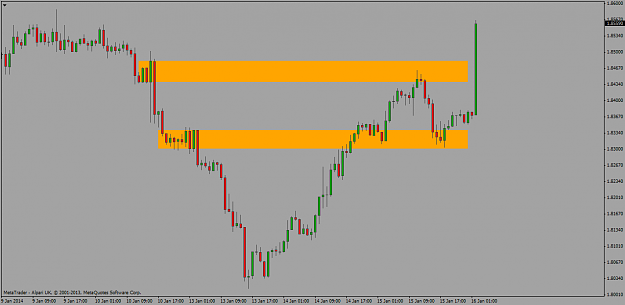
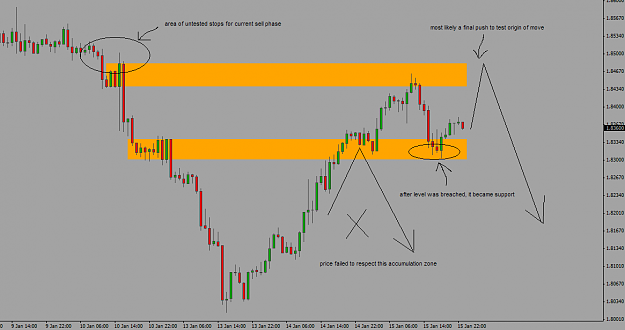
GBPCAD bid up to the supply zone and i was too late to the party for that one, but GBPUSD was an ideal 'buy low' trade. GBPUSD - 1hr image Initial stop loss zone from a trend line break was breached, but price had a backup area from a previous buy ...
Russian Doll - Boxes within boxes price action