- Search Forex Factory
- 64 Results
-
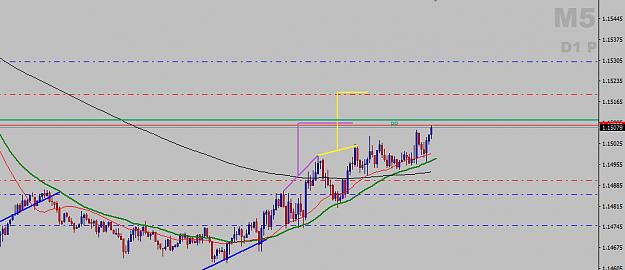
 Floryn replied Oct 15, 2018
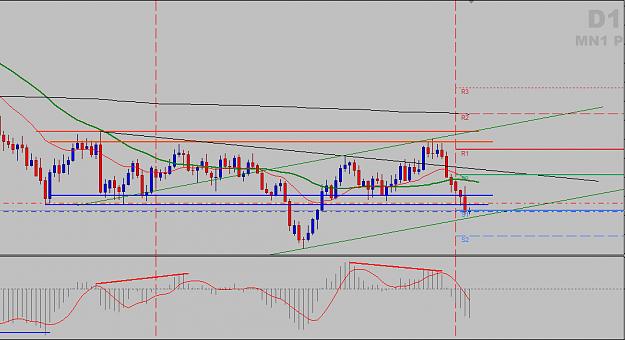
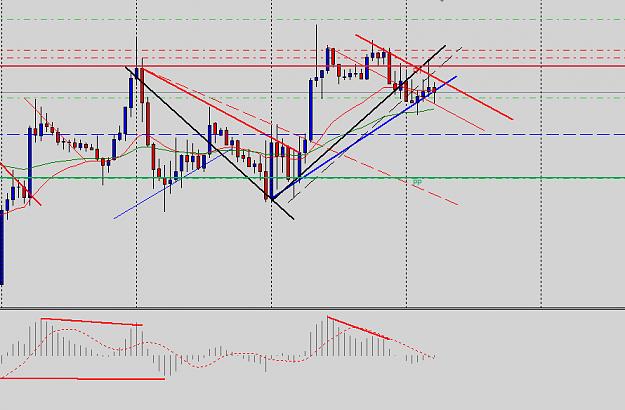
Though reaching the monthly pivot 1.16480 is inevitable imo, I was looking for a retracement to at least 50 fib from last week upward move first.
EURUSD only
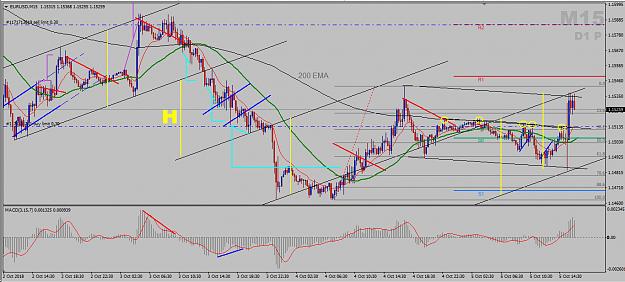
- Floryn replied Oct 5, 2018
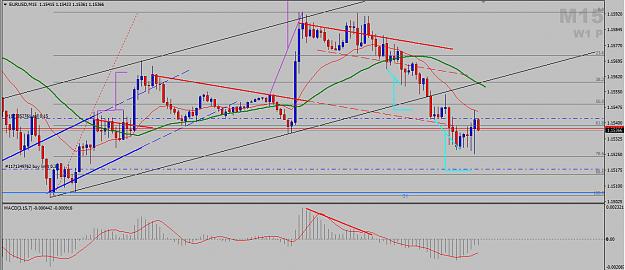
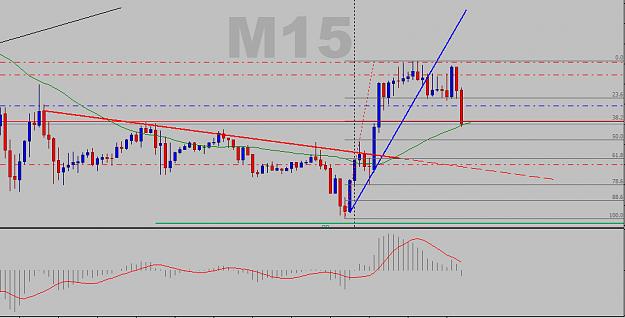
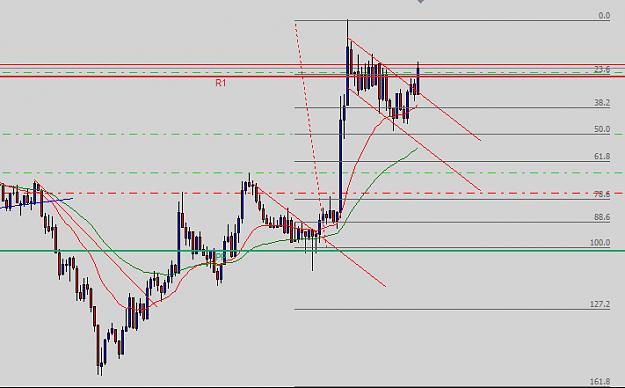
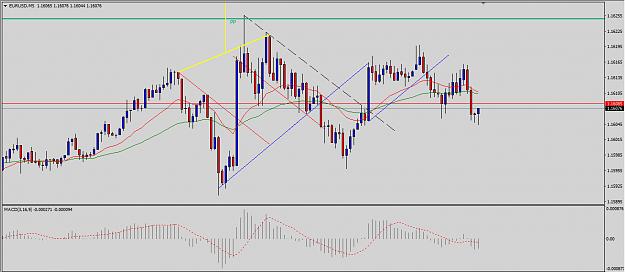
Pretty interesting stuff on M15. Price moved down lately with the same height of first channel and today channel before and after NFP has also the same height. 200 EMA was a strong resistance area before NFP. If there will be a breakout of this ...
EURUSD only
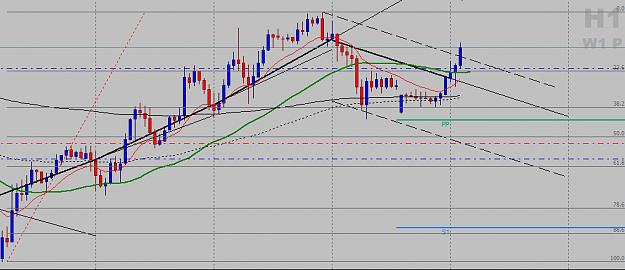
- Floryn replied Oct 4, 2018
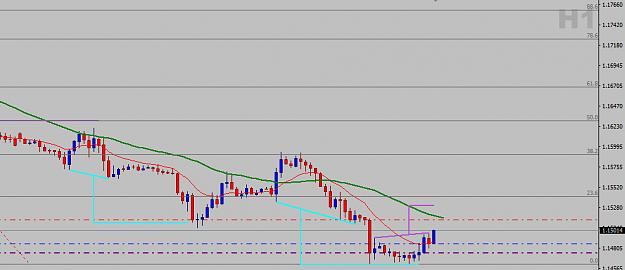
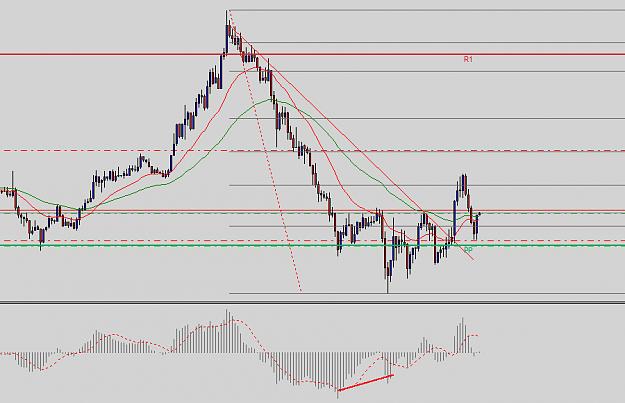
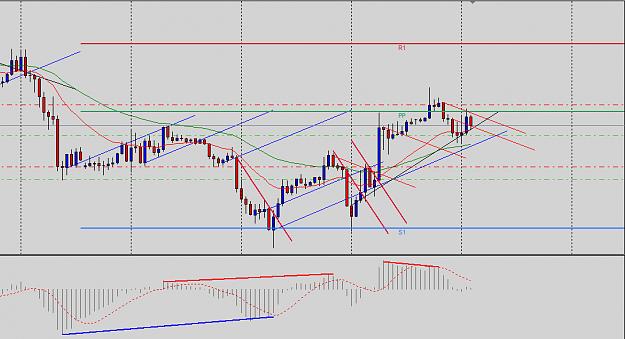
I took my profit TP 5080 level probably a little early. I had added a second long 4850 level. If I drew magnetics correctly on H1, it could reach 5300 level.
EURUSD only
- Floryn replied Oct 4, 2018
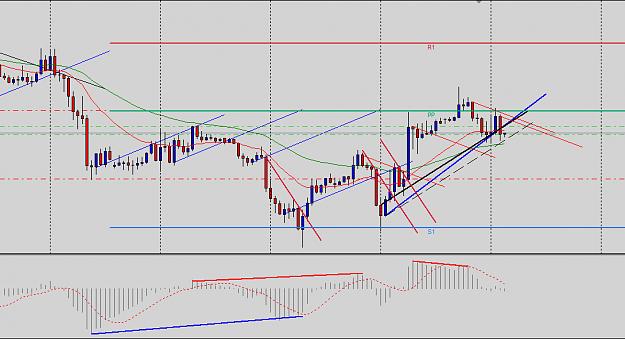
Since last daily candle closed below the support blue zone that Ata mentioned sometime what does it mean? Lower prices will come after a possible upward move before? In this case that inverted HS on Daily is out of discussion. Or probably a fake BO ...
EURUSD only
- Floryn replied Oct 3, 2018
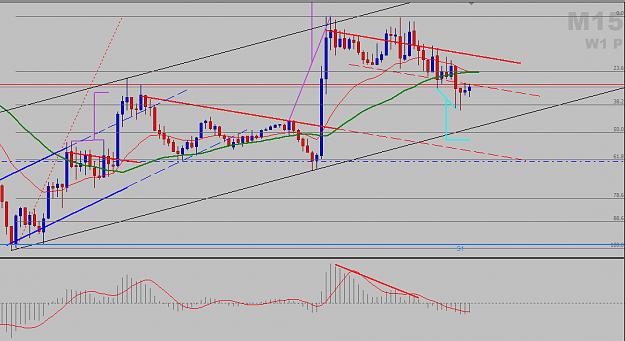
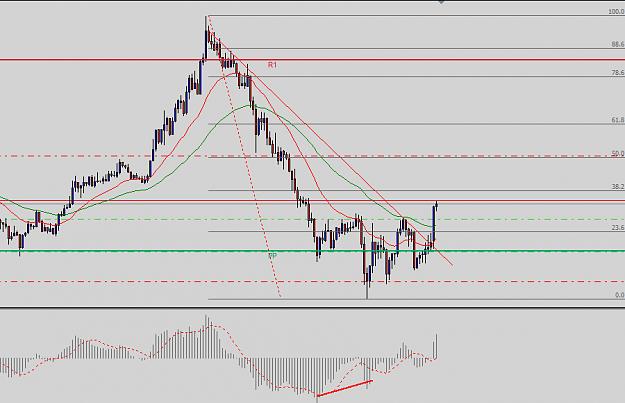
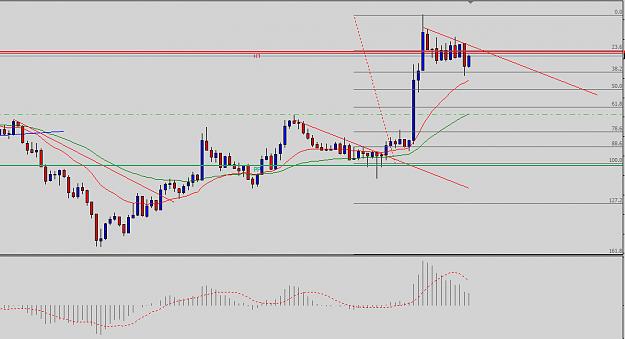
Short from 5420 TP around 5200 or a little bit lower where buy limit is waiting. That is a 78.6 and 88.6 fib retracement and I've just learned from somebody that if candles close in that area, in this case, would be a buy and not a sell level. Hope ...
EURUSD only
- Floryn replied Sep 21, 2018
LH's, LL's... I don't kow why did I close my short and not followed price action.
EURUSD only

- Floryn replied Sep 13, 2018
This pattern with small body bullish candles closed higher and higher reminds me of a big drop.
EURUSD only
- Floryn replied Sep 11, 2018
SL scratched... I don't know why I didn't close my longs or at least half at 1.15980. I was expecting the retest of neck line but not soo dip. M5 chart.
EURUSD only
- Floryn replied Sep 11, 2018
I have two longs and put my hope in these inverted HS on M5. TP around 1.16000
EURUSD only
- Floryn replied Sep 6, 2018
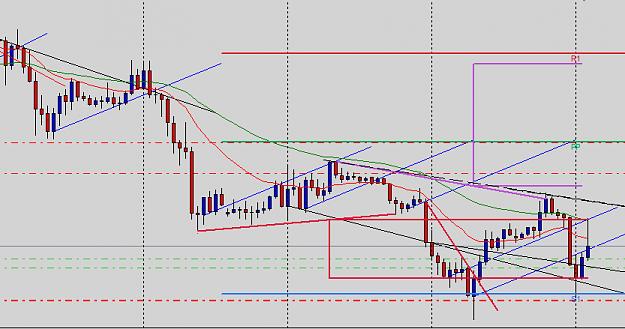
Though we are above LO, LO to LO TL is pretty steep upside, we are above 54 LWMA, 20 EMA is above 50 EMA, I would go bullish. But there was a bearish divergence on H1 and I remember ATA said sometimes that if candles closes below a steep LO to LO TL ...
EURUSD only
- Floryn replied Sep 5, 2018
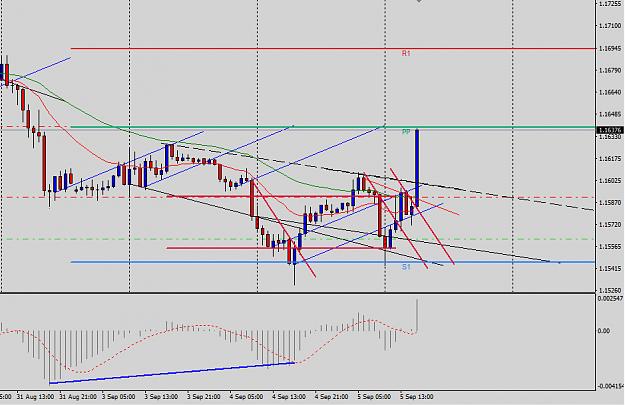
Buy Stop order hit 1.16245. There was a flag breakout on M5 also, hope not a fake one. My other Buy Limit 1.16080 order was not hit for only 20 points, but this also could happen who knows...
EURUSD only
- Floryn replied Sep 5, 2018
Could this vacuum happen so quick or there are chances for a bearish divergence on M5?
EURUSD only
- Floryn replied Sep 5, 2018
TP hit from one trade at 1.16235, +40 pips. For the second trade I closed manually at 1.16324 (too early, I was afraid of a quick retracement, TP was 1.16400). I booked from the second trade +70 pips. Great day for me!
EURUSD only

- Floryn replied Sep 5, 2018
Well, I suppose you closed your shorts and opened that long based on H1 bullish divergence and a retest of yesterday breakout level of that dark red TL... though I remember you said to never draw a red TL below LWMA, but this is dark red and not red ...
EURUSD only
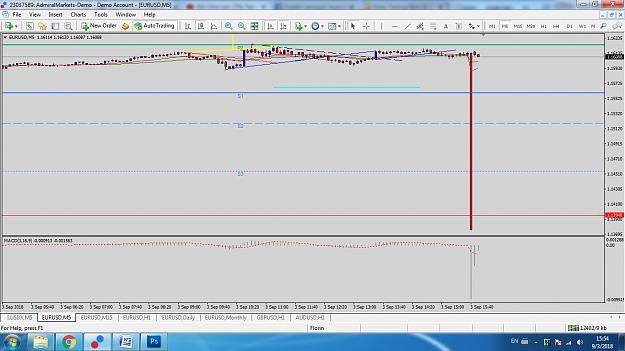
- Floryn replied Sep 3, 2018
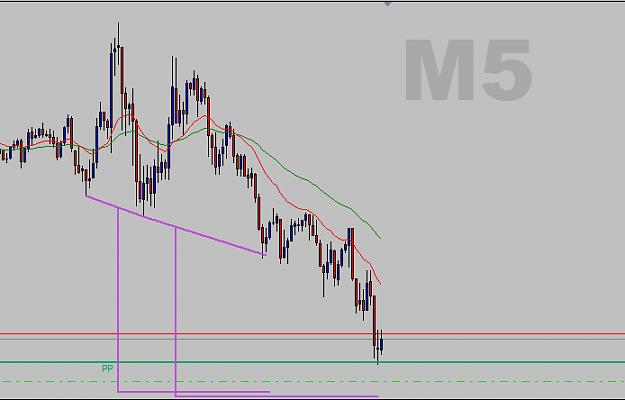
M5 chart. This drop on my broker was also on GU and AU. Great start of the month
EURUSD only