- Search Forex Factory
- 35 Results
- Fred-IV replied Feb 18, 2021
Hello TimeFx, once again I want to thank you and acknowledge the amazing work you have done. I'm just starting to read your three threads and it will definitely take me at least a few days if not more, there is a bunch of good stuff here. AMAZING! I ...
Trend Bias and Weighted Trade Signals Trading Tools
- Fred-IV replied Jun 23, 2019
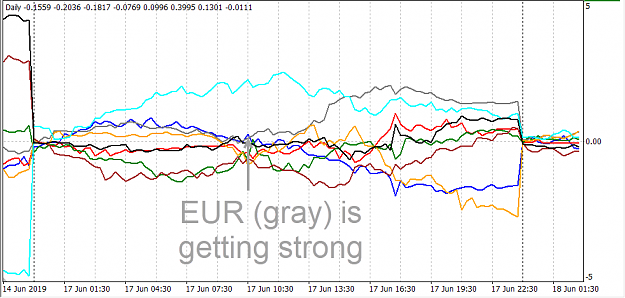
I am looking for a practical application of this indi. At the grey arrow you have a start of a GBP increasing strength. However, at the same time, the green currency looks even better, but then suddenly reverses. I would choose green, looks better, ...
An indicator for the strength of a currency
- Fred-IV replied Jan 30, 2019
Excuse me sir is your symbol created from forks?
The only thread you will ever need: FX Exposed!

- Fred-IV replied Jan 29, 2019
And can we have a picture of Will, please? Here is the picture of Darkstar from his profile (can ya make me appointment with ya sisters????):
Is it possible to trade $149 to $1 million in 4 weeks?

- Fred-IV replied Jan 29, 2019
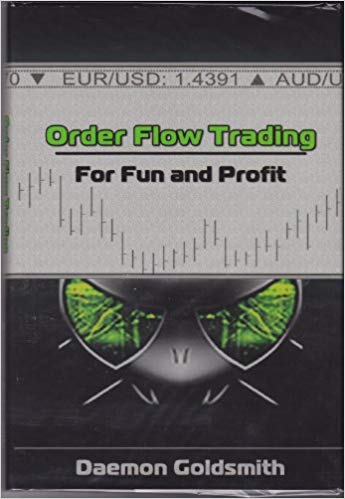
Will, essentially you are selling shares of your own company, telling us here that you are nor Will? Darkstar - author a book about order flow, former owner of an IT company, based in Florida. Well... From your website: Vertex: ...
Is it possible to trade $149 to $1 million in 4 weeks?
- Fred-IV replied Jan 28, 2019
Basic of sharp trend reversal at the bottom of compression still works. Closed prematurely but it is evening here.
ReadtheMarket - Supply and Demand with Price Action
- Fred-IV replied Jan 23, 2019
So you dont understand that I am contributing here by analyzing what is going on in this thread all the time? If not, look at my gold chart:
The only thread you will ever need: FX Exposed!

- Fred-IV replied Dec 19, 2018
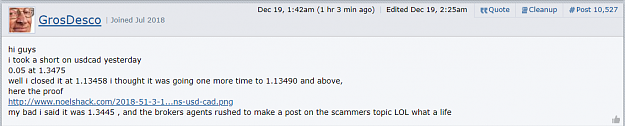
Yeah, I spotted that, more - look at the tiny position size. Typical for an amateur wanting to show a green statement, closing positions sometimes after half a year. this is rubbish, just like that girl from Germany half a year ago. These are ...
Scammers - Hall of Shame
- Fred-IV replied Dec 3, 2018
Now we have final stages of the first phase of Brexit, in a week time I suppose there will be final voting in the British Parliament: the outcome is not clear if it will be passed or rejected, I have heard that in the London City no one wants ...
MADdash (Moving Average Distance)
- Fred-IV replied Oct 11, 2018
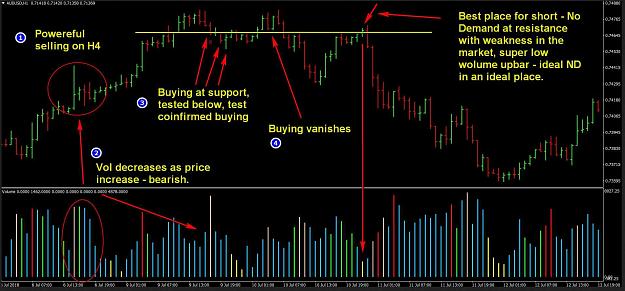
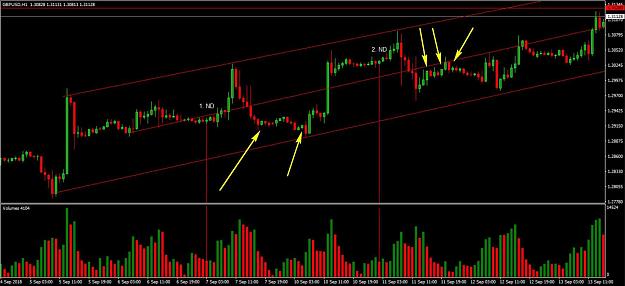
Imho both didnt work. I remember from the Tom Williams work, maybe it was in his London Symposium that to have a No Demand as a signal for a trade you should have a weakness in the background - in your both ND's it is not the case, so both are not ...
vsa with Malcolm
- Fred-IV replied Apr 27, 2018
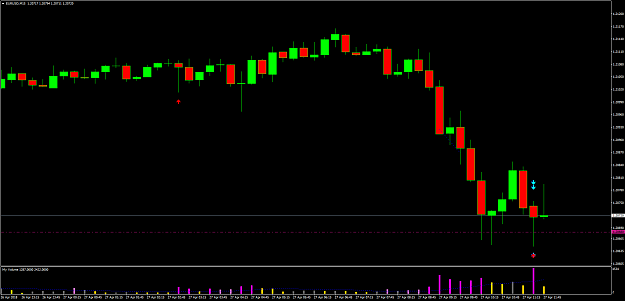
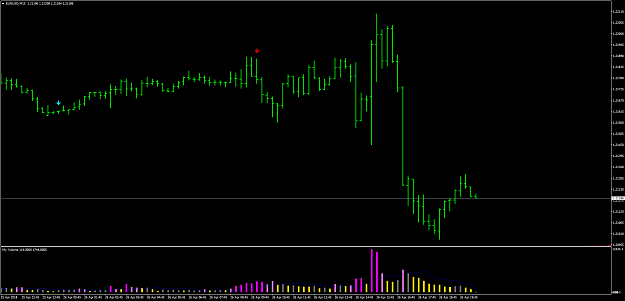
Squat and reverse UT at the same time - red and blue arrow on the right. However not the signal I would call very good - I know that the best ones are with the narrow range, while the second bar here is only 1 pip smaller. Screen 2: move up but ...
vsa with Malcolm
- Fred-IV replied Apr 26, 2018
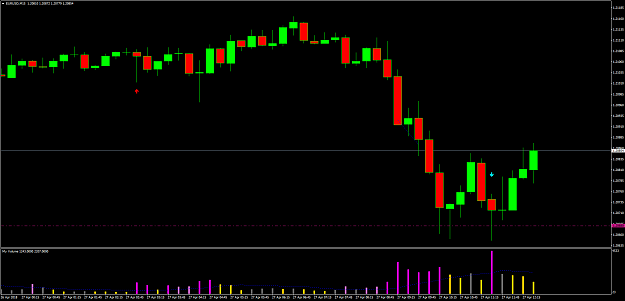
Tried my indi here: volume at my broker differs so it wouldnt be as clear picture as yours. It would be intreresting to compare with futures volume M15, if someone can supply I would be grateful. M5 with climactic up bar, Upthrust in the form of No ...
vsa with Malcolm
- Fred-IV replied Apr 26, 2018
Squats are something I would like to study further as frequently SQ is close to a top or bottom. Working on indicator has its advantages, forces to define all signals very precisely. If you wish I can supply (a lot) of examples to discuss squats: my ...
vsa with Malcolm
- Fred-IV replied Apr 25, 2018
I dont know your experience in public forums, but it is good to know that in general asking senior members for basics explanations is considered impolite. Especially if you have a list of pretty basics terms. I can share what I did before. url - ...
vsa with Malcolm
- Fred-IV replied Apr 24, 2018
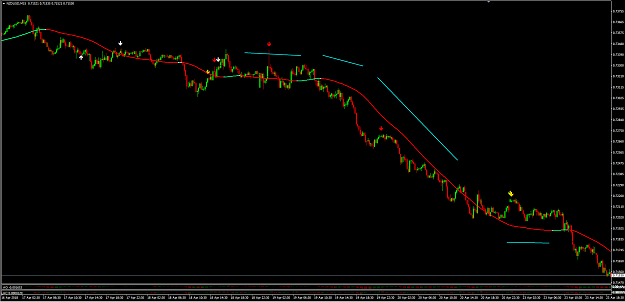
Thank you, I have something I believe good: SMAAngle
I will code your EAs and Indicators for no charge
- Fred-IV replied Apr 23, 2018
Hi Guys and Gals, thank you all for your service to the comunity! And now my question (s)
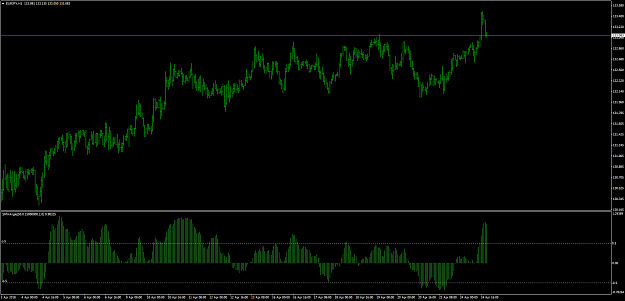
I will code your EAs and Indicators for no charge 1. Im looking for an indicator of slope of the curve. Example - I have here moving average (200 Hull, but it can be ordinary simple MA) - and I need an ...
- Fred-IV replied Apr 23, 2018
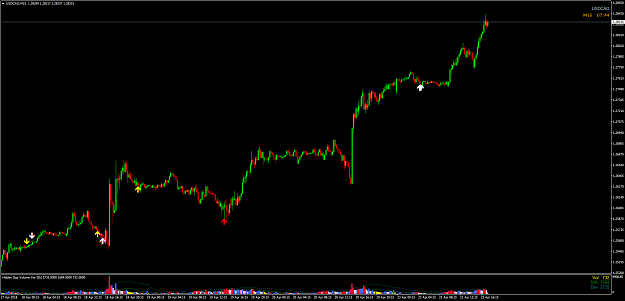
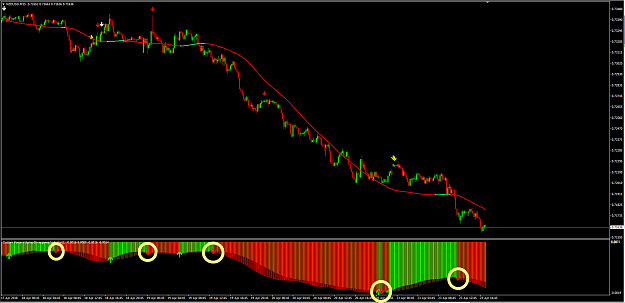
Added 200 period HMA and it filters out all buy signals leaving only sells. I think this is a main direction that the creator of this indi might pursue, eventually I would add something showing the strength of a trend or it's "smoothness" or the ...
Hey...what about Volume?
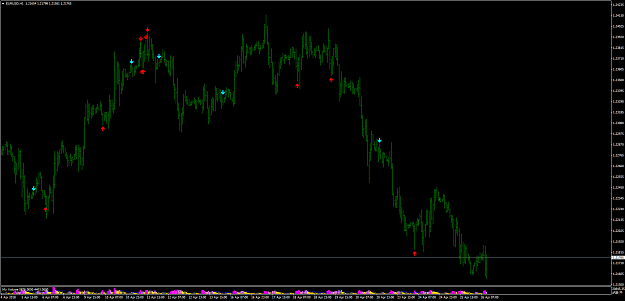
- Fred-IV replied Apr 23, 2018
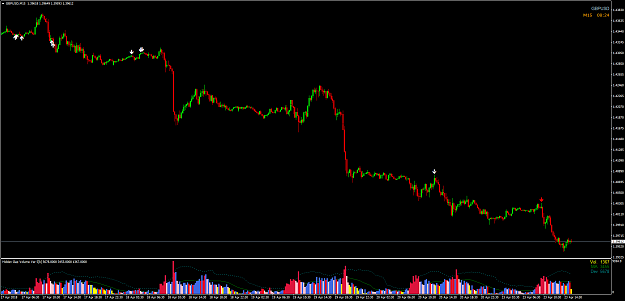
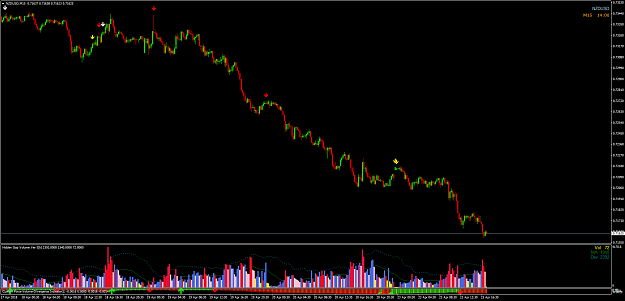
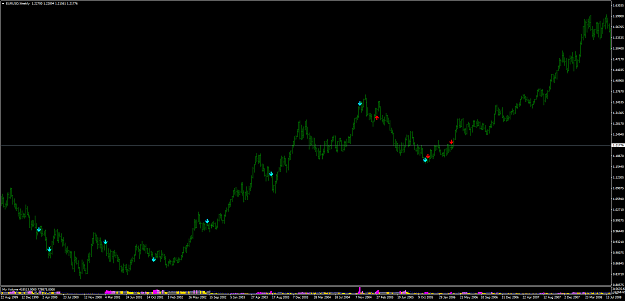
The indicator is at the bottom of the chart (histogram with arrows - I put there three yellow arrows to point at the indi's signals). On first sight might be useful when paired with a couple of MAS or Hull Averages to show trend, green ones are ...
Hey...what about Volume?
- Fred-IV replied Apr 23, 2018
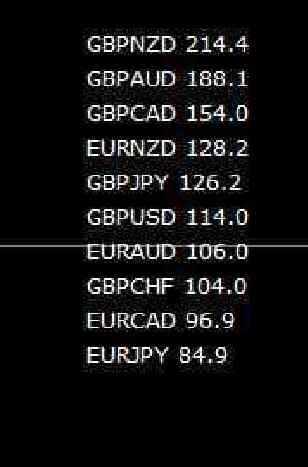
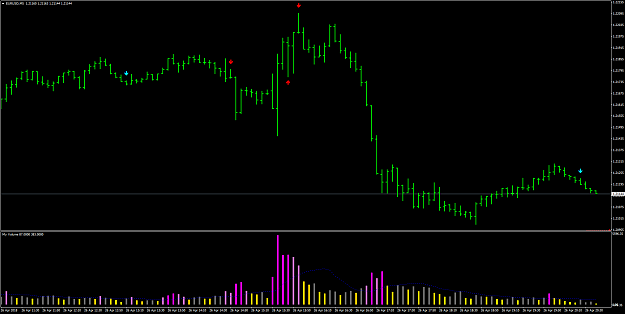
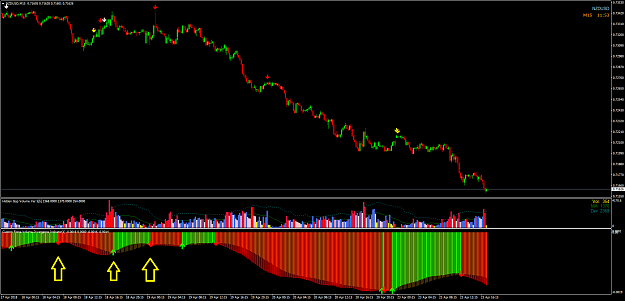
Some time ago I tried to explain my attempt to create a good market scanner. At this moment I have something like this (screen below), white are no demands, yellow are "zero demands" = vol minimal during last 20 bars ("extreme no supply/no demand"), ...
vsa with Malcolm