- Search Forex Factory
- 16 Results (2 Threads , 14 Replies )
-
 GoldTheHun replied Jun 27, 2017
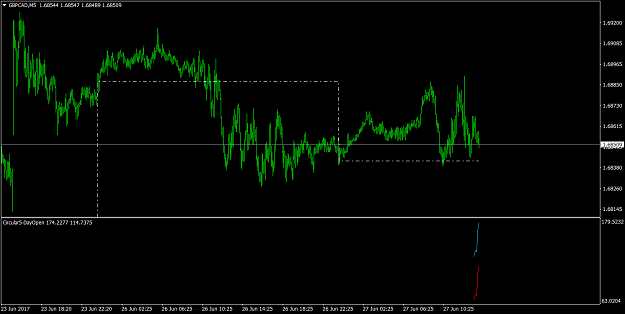
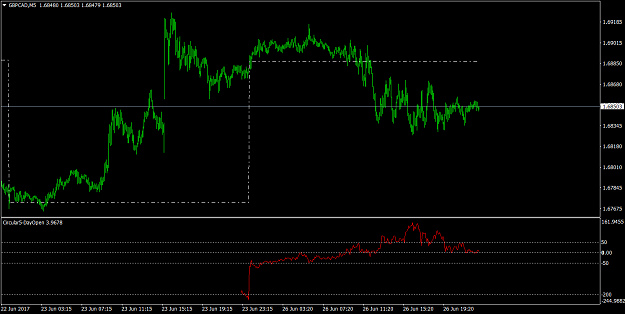
Here is the better version of the indicator. file file Both have to be downloaded.. There are 2 lines in the indicator. Blue line is the Long GBPUSD, Long NZDCAD, Long AUDNZD, Short GBPCAD, short AUDUSD. The red line is the opposite trades. This ...
Three Pairs Hedging
- GoldTheHun replied Jun 26, 2017
Hi Meta, You have a very good understanding of relationships between pairs.. I loved the clarity in you explanations and schematics. I am not a coder, just a modder when I can understand the logic of the indicator and task at hand. I put together a ...
Three Pairs Hedging
- GoldTheHun replied Apr 11, 2017
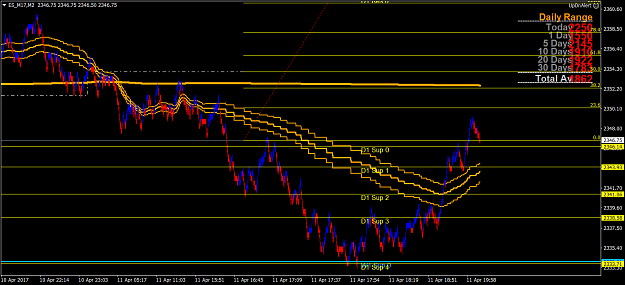
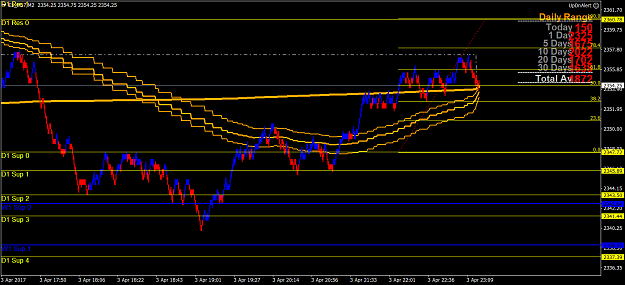
Hi Jack, There is no error in weekly levels. image As you said spx hit the %99 level on the daily range but touched only the first level of the week, which is normal in huge spikes. But if you see the %99 level hold nicely and than shot up D1Sup0, ...
Random Walk (The unbeatable!)
- GoldTheHun replied Apr 11, 2017
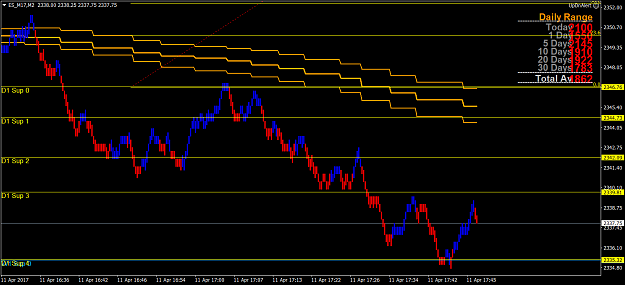
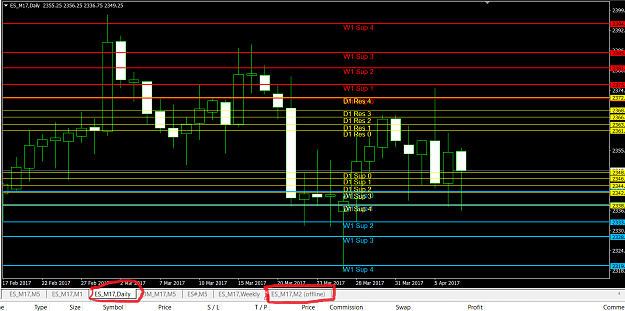
Few pointers for people who are interested. image As you can see the price respects these levels very much. I would like to see the price hesitate on a level before I enter. When weekly and daily levels coincide, they make a good ...
Random Walk (The unbeatable!)
- GoldTheHun replied Apr 11, 2017
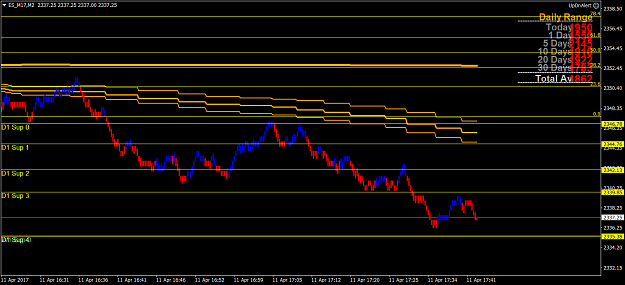
Sure metta, Since I only trade sp500 for a long time now, here is pic of my chart. Range bars are 0.50 in height. image Red and blue bars come from 3 line break indicator and the 3 orange lines are mtf ma, set at 5 minute timeframe and they are ...
Random Walk (The unbeatable!)
- GoldTheHun replied Apr 11, 2017
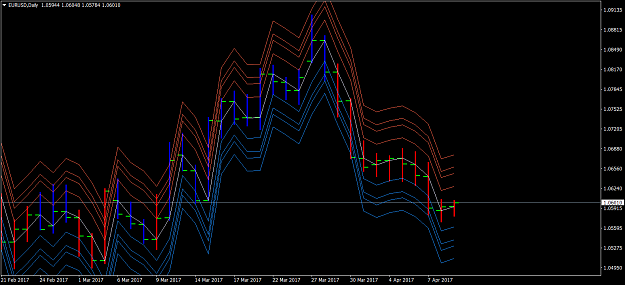
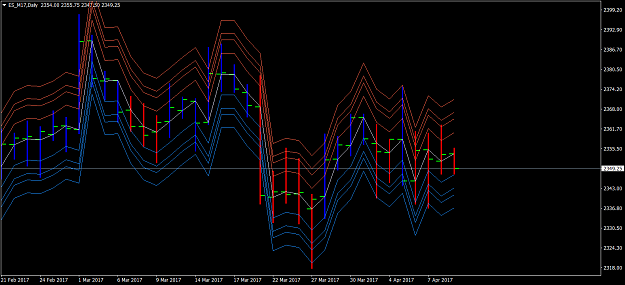
Please look at the kprsa's excellent indicator (pivot_goldthehun_v2.mq4 ) on daily time frame. You will need the ATR-Close.mq4 indicator in the indicator folder for the kprsa's indicator to work properly.. In following 2 charts you will find EURUSD ...
Random Walk (The unbeatable!)
- GoldTheHun replied Apr 7, 2017
Cobra I can't recommend any brokers, sorry. For the number of bars, just hover your mouse on the chart title at the bottom of the chart... I marked them with red...
Random Walk (The unbeatable!)
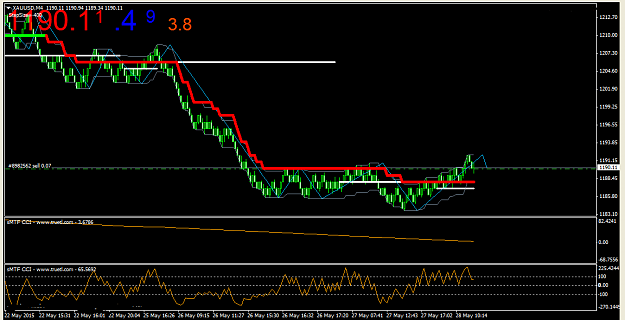
- GoldTheHun replied Apr 5, 2017
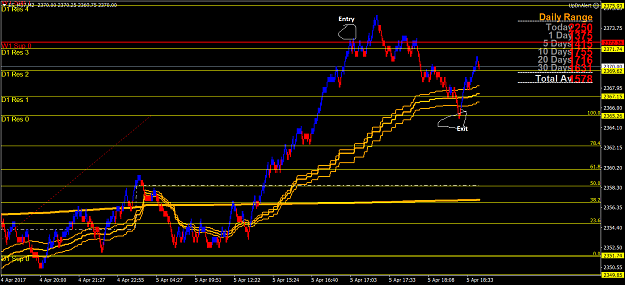
Here is a trade I took today. By the way I only trade futures, with a futures broker. I also use MT4 for technical analysis and coding of indicators. We were only 40 minutes into the live trading session of emini sp500. The priceaction already hit ...
Random Walk (The unbeatable!)
- Random Walk (The unbeatable!)Started Apr 3, 2017|Trading Systems|354 replies

The markets are said to be random walk. Through the years of trading I really believe that the ...
- GoldTheHun replied Jan 10, 2017
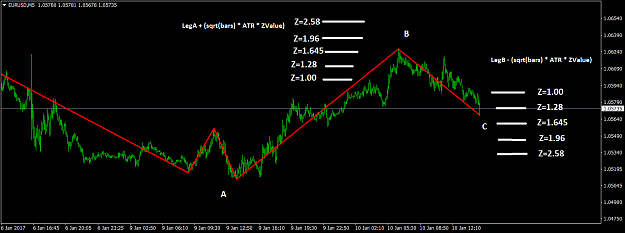
Khalil, Here is a dynamic version of Support and Resistance based on ZigZag image We again calculate ATR(1400) for 5 minute time frame. Than we do the calculations seen on the pic, counting the bars on ZigZag legs. This would be dynamic ...
Need Best Support and Resistance Indicator
- GoldTheHun replied Apr 17, 2016
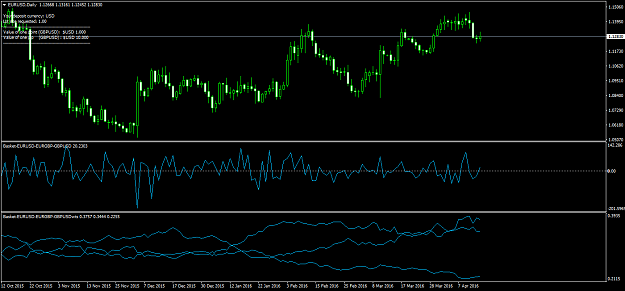
I have changed another indicator to show 3 circular pairs behaviour compared to look back period. I believe it gives interesting insights: image The first indicator shows how much money to be made or lost using eurusd, eurgbp, gbpusd, using ...
SketchBook - Sharing ideas on trading systems
- GoldTheHun replied Mar 25, 2016
Here is what I have done since last night. I have started a demo account with $10,000, using 3 circular pairs. The EA's have been running less than 12 hrs, all Asian session for now. EURUSD, Buy Only, Magic 227 EURJPY, Sell only, Magic 227 USDJPY, ...
Accumulative Profits Grid System
- GoldTheHun replied Mar 1, 2016
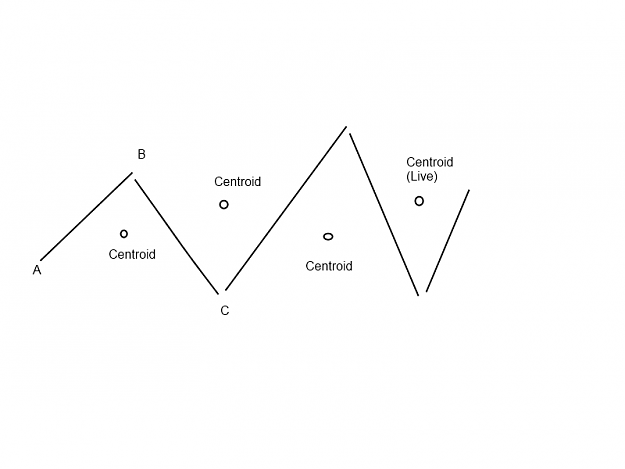
Sure. Here is my work of art drawing!!!! I hope it is clear enough...
New historical Forex models
- Trading Method with Conditional LotsStarted Jan 7, 2016|Trading Systems|4 replies
This a method that I have devised using different lot sizes for different conditions of the market. ...
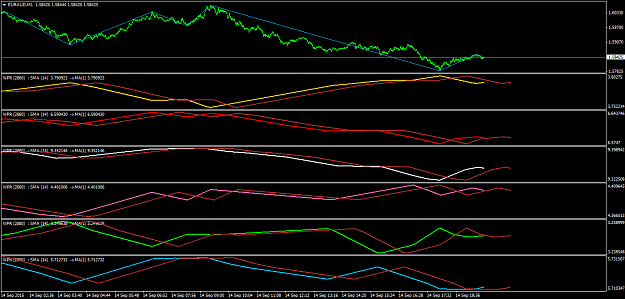
- GoldTheHun replied Sep 14, 2015
Here is a chart with zigzag using the currency index. Yellow= AUD, Red = EUR, White=GBP, Pink=JPY, Lime=NZD, Blue = USD. The brown on each indicator is displaced values(60) of the zigzag.. image
Quant basket trader? I need your help!
- Posts by Member Search: 'GoldTheHun'