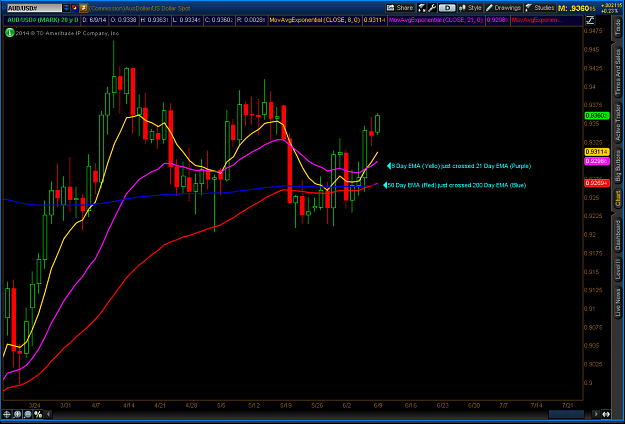
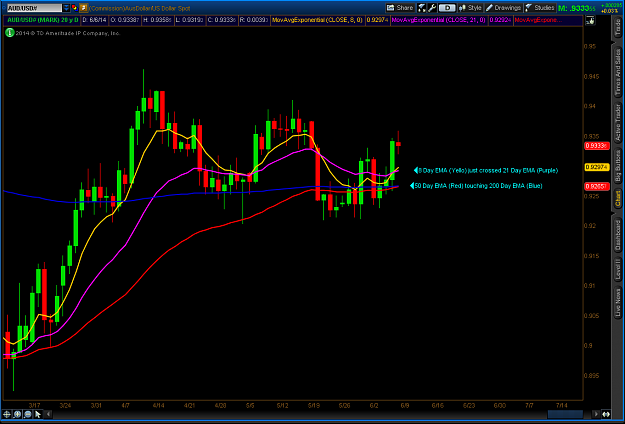
The 8 EMA just crossed the 21 Day EMA and the 50 Day EMA is just crossed the 200 Day EMA. Usually, when the 50 Day EMA crosses above the 200 Day EMA, this is a bullish sign. Any thoughts on this would be appreciated.
Sorry, this was my first post and just figuring out how to upload a chart. Here it is: