- Search Forex Factory
- 26 Results
- Londonpip60 replied Jul 22, 2021
Attached is chart pinpointing news releases through out today and yesterday. If you are a day trader I think it might be wise to follow these news releases, the main reason is liquidity - if liquidity dries up - price moves very quickly - also you ...
The brutal truth of day trading
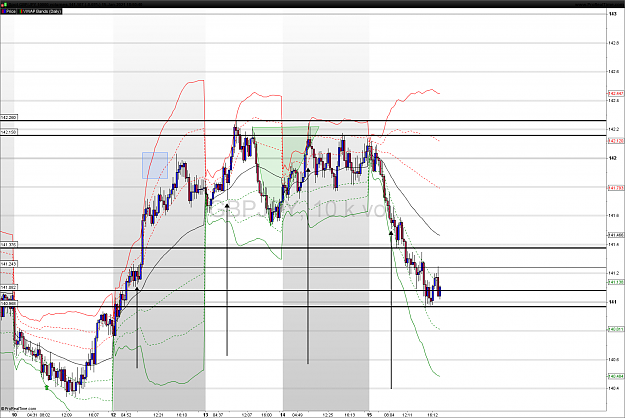
- Londonpip60 replied Jan 15, 2021
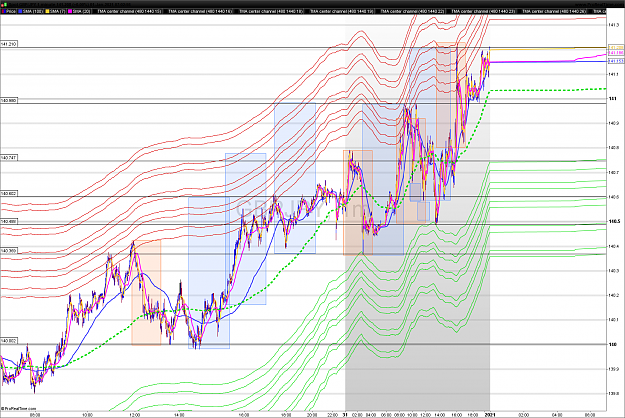
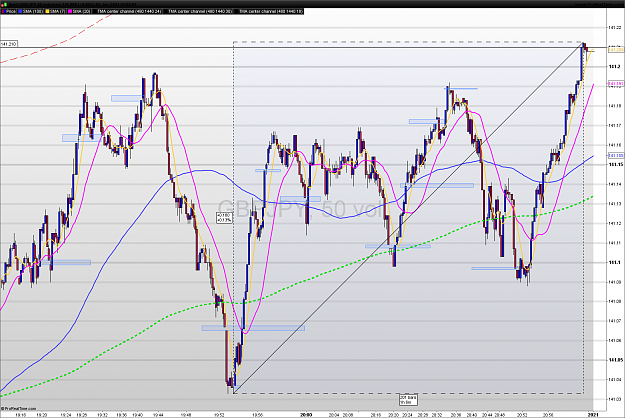
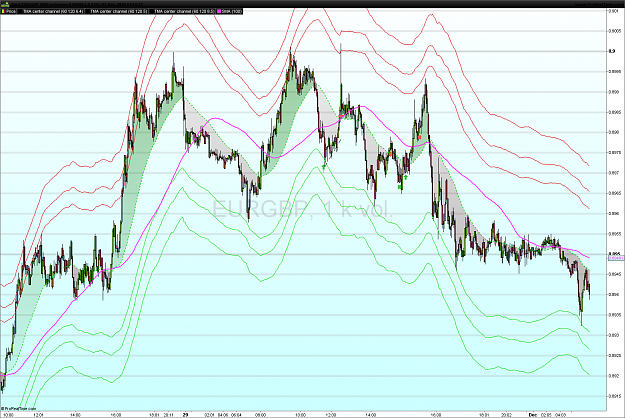
Attached is vwap bands and arrows show the 8am Frankfurt session. the advantages of these bands they are the same on the one hour chart to the 1 minute. Start at midnight and expand out.
Price action at the core = family members' discussion project
- Londonpip60 replied Jan 5, 2021
Hi, I thought I might share this with you for the ones which like to scalp. 10 second chart with 4 days data from gbpjpy. The black arrows come from the 1 and 4 hour chart - today if you were using the 1 minute chart - you would have had one entry ...
Price action at the core = family members' discussion project
- Londonpip60 replied Jan 1, 2021
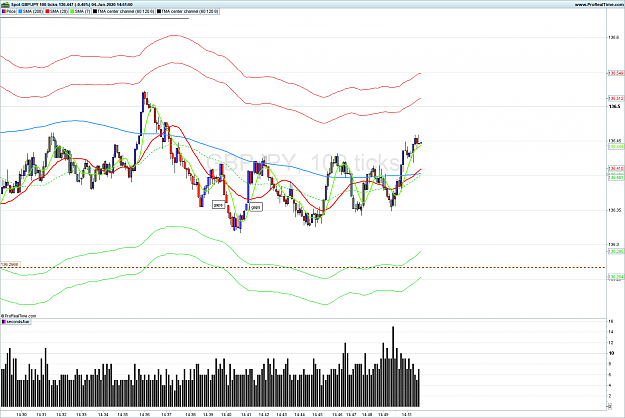
I'm a student of trading - but the market maker loads and unloads in key area's to him - but the main problem MM has is price just gets to thin and starts to gap. Attached tick chart with gaps - last hours of trading were transactions are fewer ...
Price action at the core = family members' discussion project
- Londonpip60 replied Dec 2, 2020
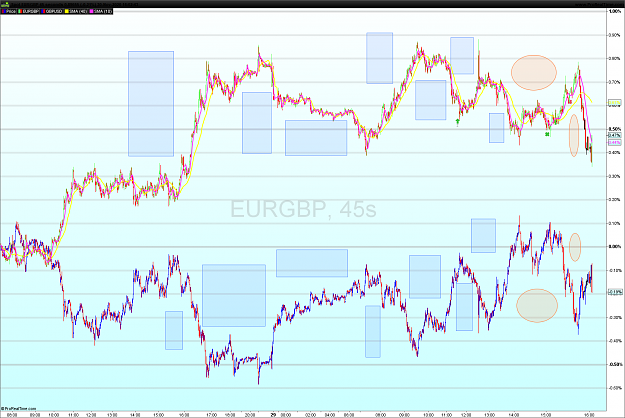
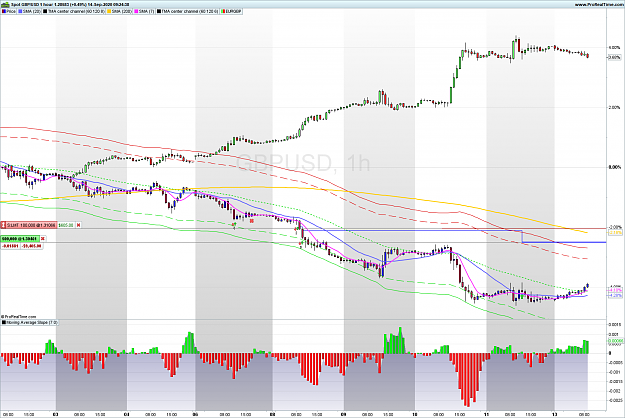
image I would look at volume candles - just counts transactions per candle. If I was trading today these candles - were arrows are would be interesting to me. 0% MAKES ME MORE CAUTIOUS. sma's on the 15 minute, 1 hour and 4 hour gives me direction. ...
eur/gbp
- Londonpip60 replied Dec 2, 2020
In some ways you are right, you don't know. But the big money on the gbpusd and eurgbp comes in within seconds of each other in the opposite directions. London session 8am to 14.00pm - dollar takes over as New York opens sometimes. I think a lot of ...
eur/gbp
- Londonpip60 replied Dec 1, 2020
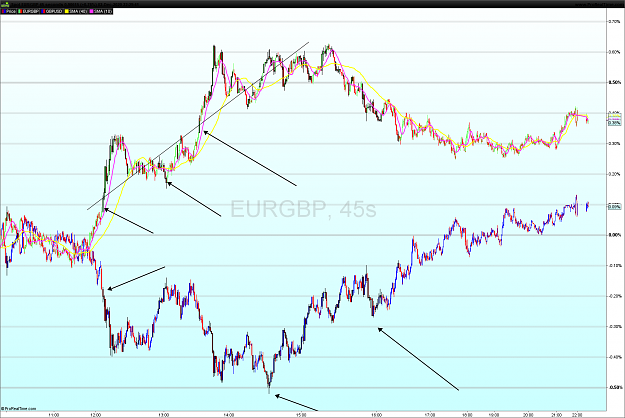
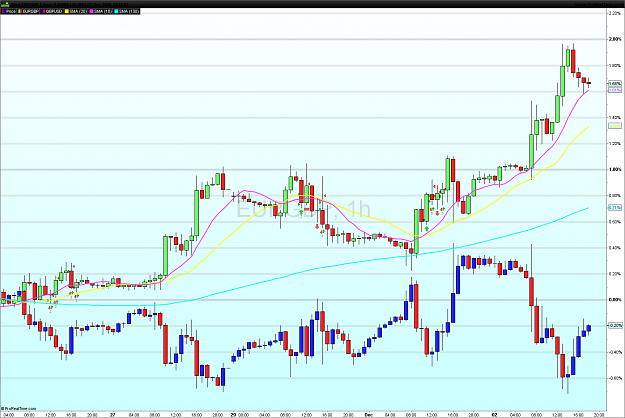
EURGBP is my favorite currency to trade. Have a look at this chart from yesterday.
eur/gbp
- Londonpip60 replied Oct 24, 2020
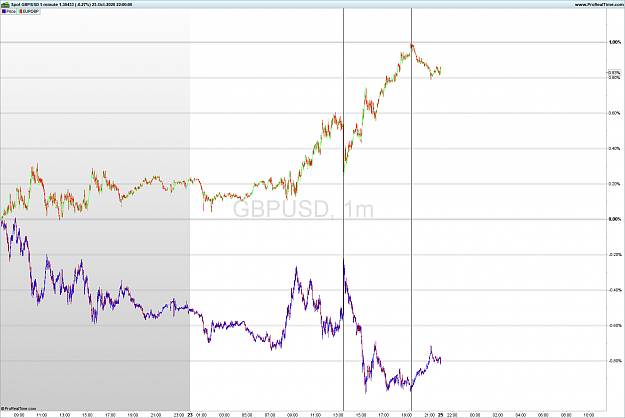
I have attached a 1 minute chart with opposite correlations - Fridays price action. What I think it shows that you have one or two main players moving the market to get as many pips as possible. eurgbp and gbpusd. They have different targets in ...
has anyone EVER seen a successful trader/trading system?
- Londonpip60 replied Sep 15, 2020
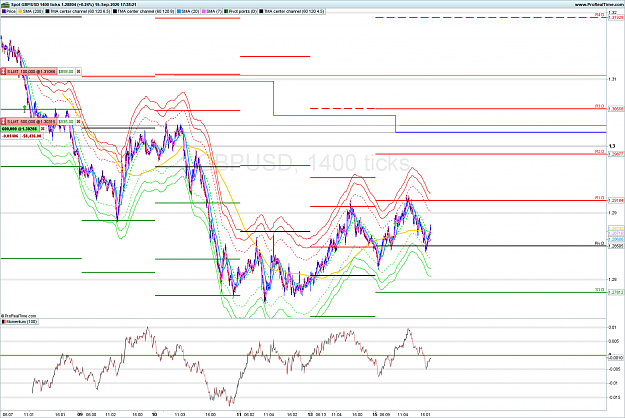
GBPUSD chart - I have attached a chart with pivots points on it. As you can see from the chart you can see were the targets for taking profits are. I wouldn't enter a trade because of pivot lines, but exiting a trade makes more sense. I think retail ...
What Is a 3:1 Reward to Risk Ratio?
- Londonpip60 replied Sep 14, 2020
Could be worth looking at the eurgbp and gbpusd chart. One is getting a little weaker and the gbpusd is getting stronger
Cable Update (GBPUSD)
- Londonpip60 replied Sep 9, 2020
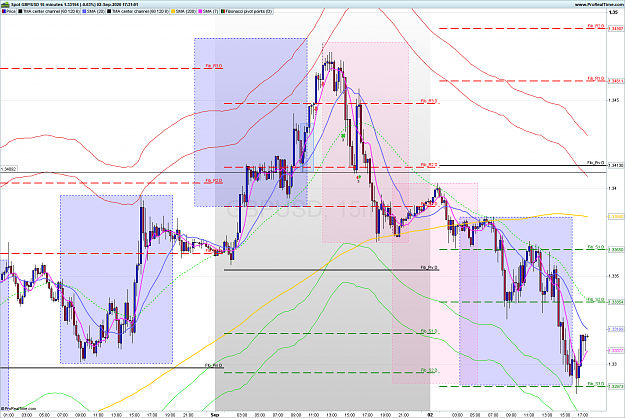
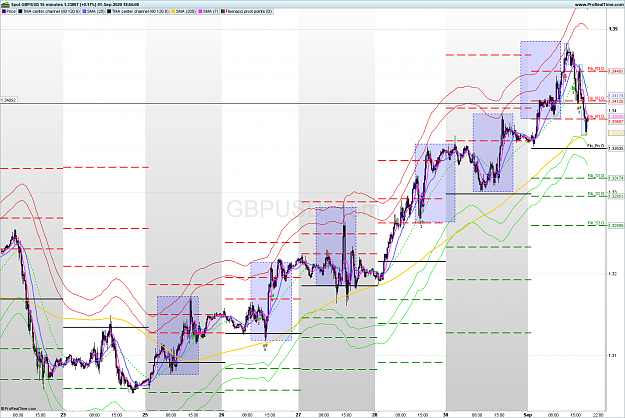
Little blue boxs - both boxes are the same size - hope it finishes today at 1.31208 - could be tomorrow at 10.00am
Cable Update (GBPUSD)
- Londonpip60 replied Sep 2, 2020
Hi Ceeso, dopamine is very difficult to control and I suppose thats why traders get the big bucks. I was told rightly or wrongly that there is an algo for banks to control price. The problem banks had in the past is they used to get clipped. Which ...
What I learned after losing $300,000 trading forex
- Londonpip60 replied Sep 1, 2020
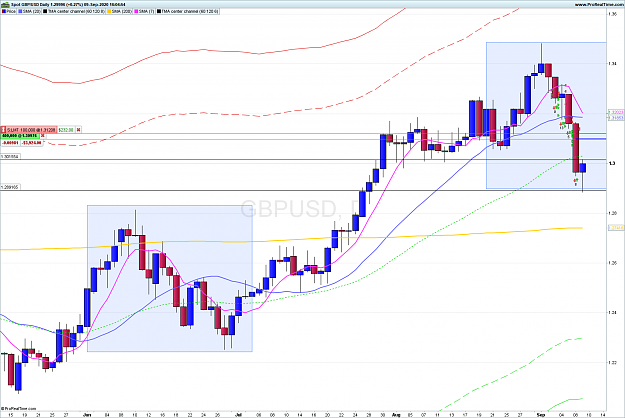
Ceeso - please don't get upset with this chart I have attached a chart - the most reliable thing on the chart are the top of the blue boxes. But if you wanted to trade into those boxes then r1 to r2 has 85% success rate. The stats. for price coming ...
What I learned after losing $300,000 trading forex
- Londonpip60 replied Jun 4, 2020
Enjoyable day trading on the GJ - gaps on tick charts - anybody like trading those
Real or Algo
- Londonpip60 replied Apr 23, 2020
i USE OPPOSITE CURRENCIES - CHART ATTACHED SHOWS HOW THE ALGO'S WORK - IT CAN BE USED FROM 1 HOUR DOWN TO THE 1 MINUTE. I CAN KEEP WIN RATE ABOVE 90% - SCALPING 10 TO 20 POINTS. image
Real or Algo
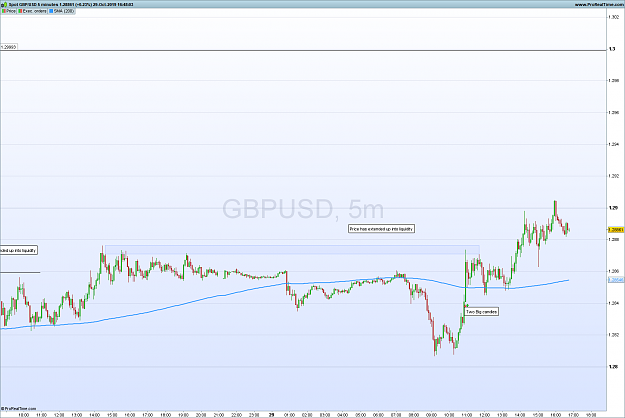
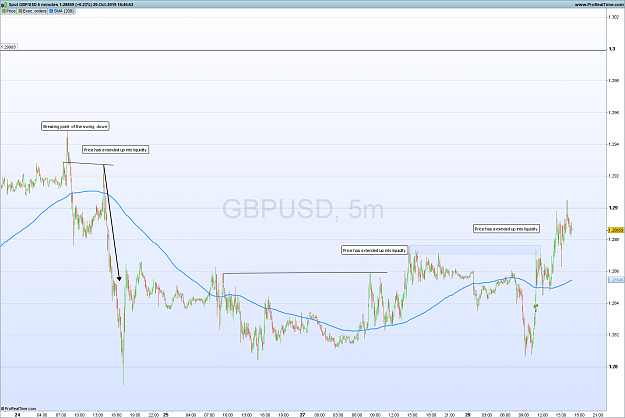
- Londonpip60 replied Oct 29, 2019
I am going to post two charts how Chris Lori likes to trade. if its off no interest please ignore - he likes to trade into price. Big candles are weak candles.
"Price - Structure - Flow"
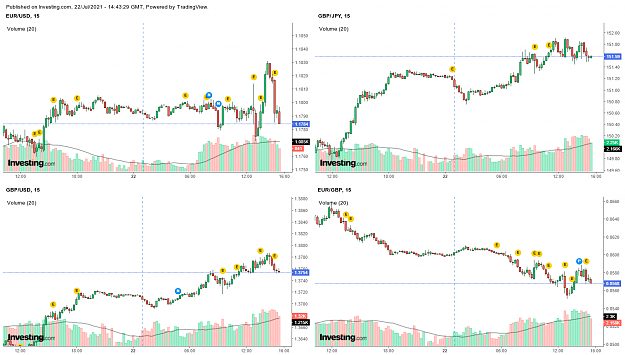
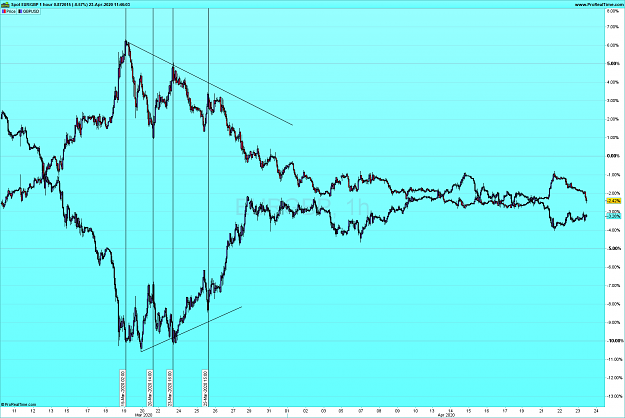
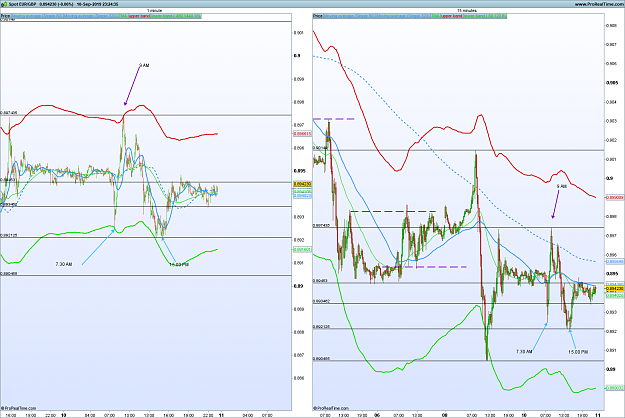
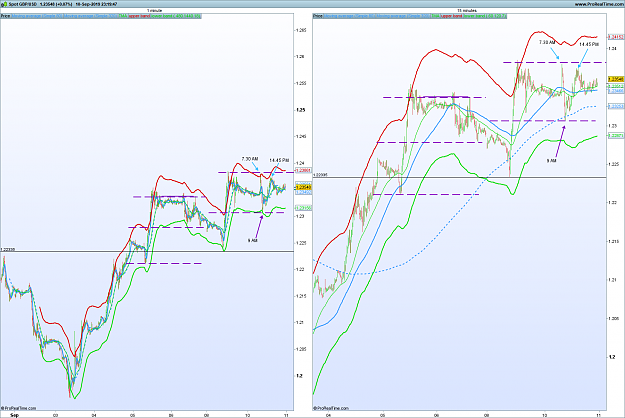
- Londonpip60 replied Sep 10, 2019
I think Daniel might trade like the 4 charts attached - GBUSD goes in the opposite direction to EURGBP. It helps to improve timing a lot and gives you an idea if the targets will be broken on the 15 minute chart. The dotted blue line 320 SMA - one ...
The Secret to Success and profitable trading - What is it?
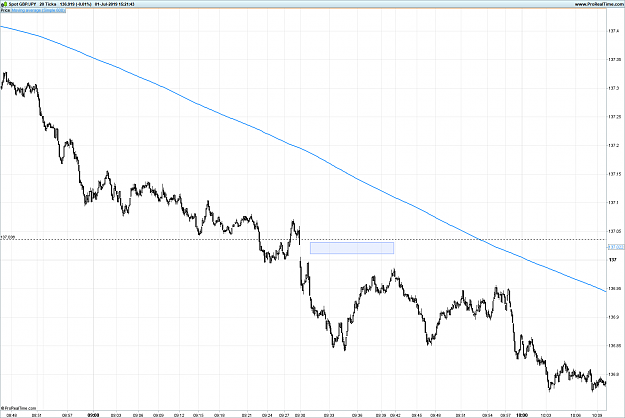
- Londonpip60 replied Jul 1, 2019
It took some finding this gap - eagle eye George. DOJI formed - order book filled - bank algo's kicked in - stops taken out from last friday - reversed and has taken out stops from today - 80% chance it will float back into the Asian range.
(binned per thread starter's request) The Lazy Trader Discussion
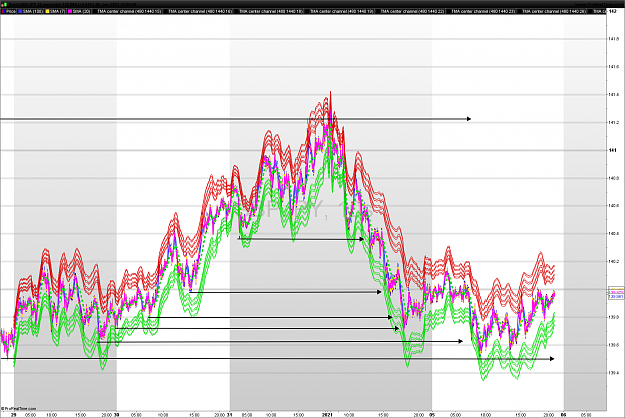
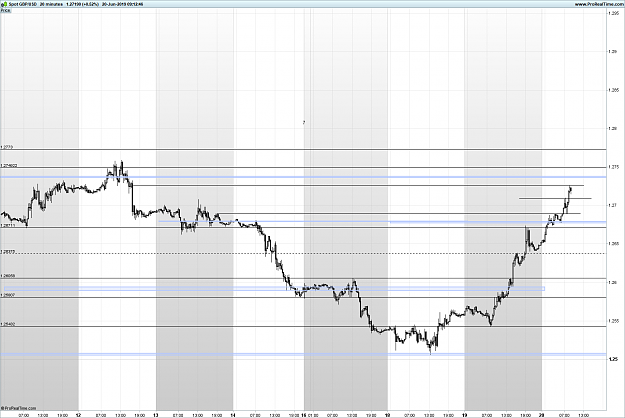
- Londonpip60 replied Jun 20, 2019
Hi All, Hope this might help on targets- the blue lines are drawn between the daily candles - the black lines should be explanatory. I was told the other day that the percentage of people winning in trading hasn't changed since 2001 - but the tools ...
Price action at the core / tma intra day
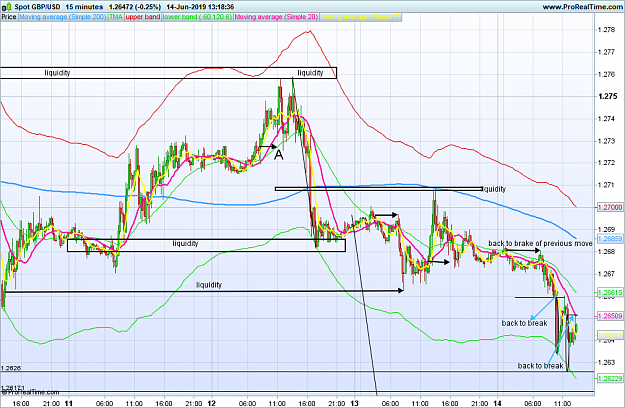
- Londonpip60 replied Jun 14, 2019
This might help some - two circles same size on chart. Prices pushdown to pressure zone and returns to point of release. A tells us there isn't many buyers around - prices pushes up too previous high and then comes down past the release point. When ...
Price action at the core / tma intra day