- Search Forex Factory
- 53 Results
- LuisRicardo replied Apr 4, 2019
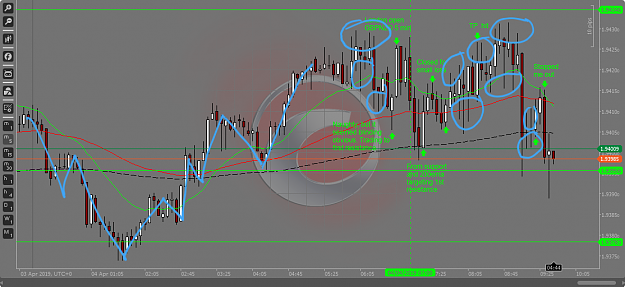
Hi Rub, There were better trading conditions before opening london than after. After opening london there are too many indecisions. For me it is better stay out. image
Strat's PASR Long Term, Stress Free Trading
- LuisRicardo replied Mar 2, 2019
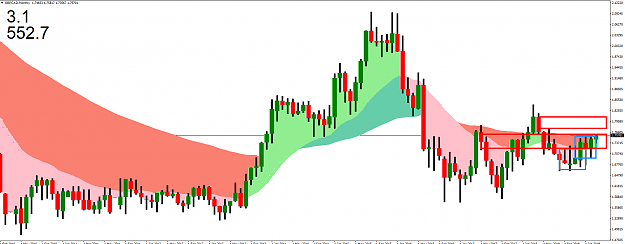
Hi Alesiosc, My comments to your chart: The consolidation area that you can see on worker came from the BigBoss. I marked two blue square. You can see how the first was broken just to pass to another, and the second one are not broken yet. The two ...
Strat's PASR Long Term, Stress Free Trading
- LuisRicardo replied Feb 27, 2019
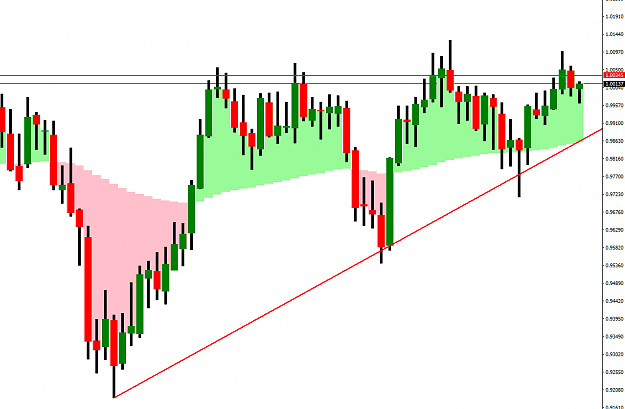
The BigBoss do not have a clear direction and the Boss is bouncing inside the triangle that I marked. Anyway, it's easier to trade long than short for all the rebounds you make going down unlike when they go up. But there is not much space to trade ...
Strat's PASR Long Term, Stress Free Trading
- LuisRicardo replied Feb 25, 2019
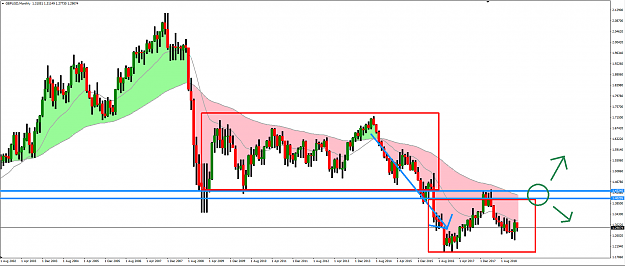
Ride to where? What you can do here is take the line that I marked blue as a target or wait to touch that line and trade short on lower TF image
Strat's PASR Long Term, Stress Free Trading
- LuisRicardo replied Feb 17, 2019
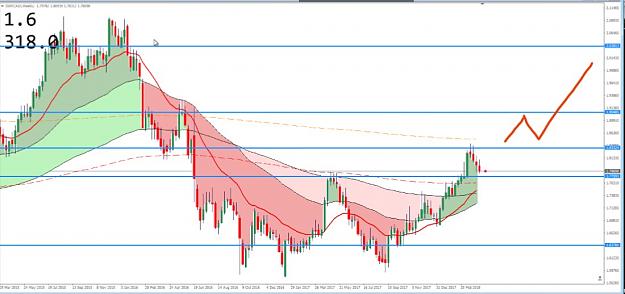
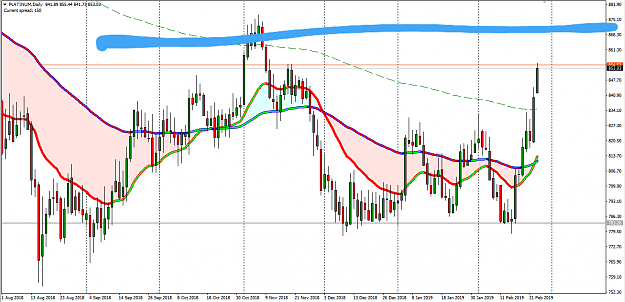
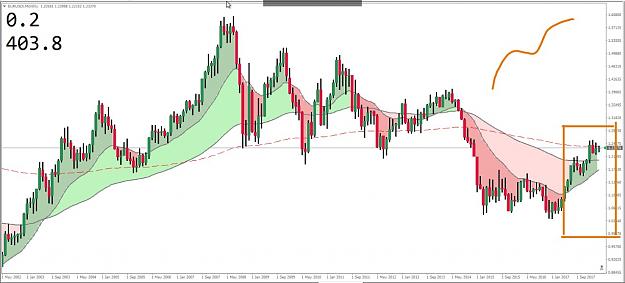
From my point of view, there is no trend in the BigBoss, the blue arrow was the trend breaking a strong support and moving from one consolidation area to another. I see very possible that the price will touch the resistance again. image
Strat's PASR Long Term, Stress Free Trading
- LuisRicardo replied Feb 17, 2019
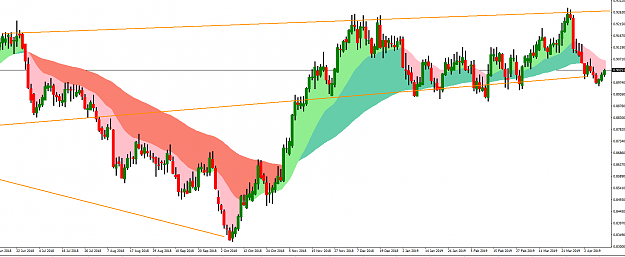
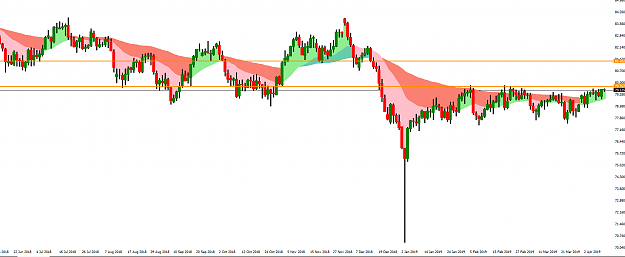
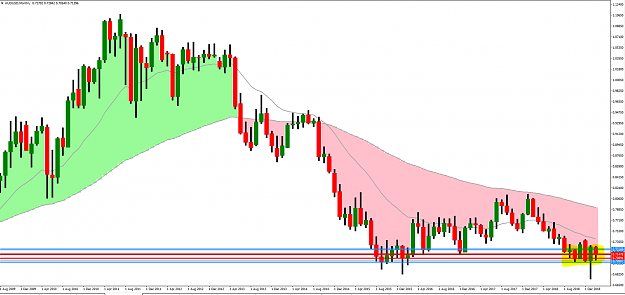
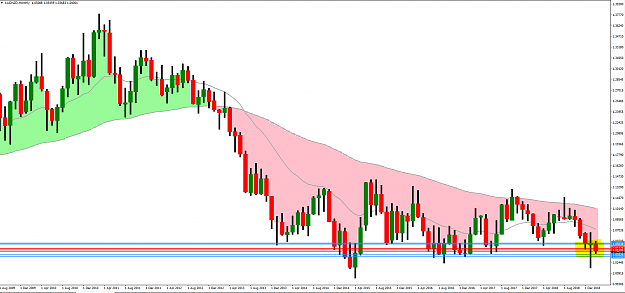
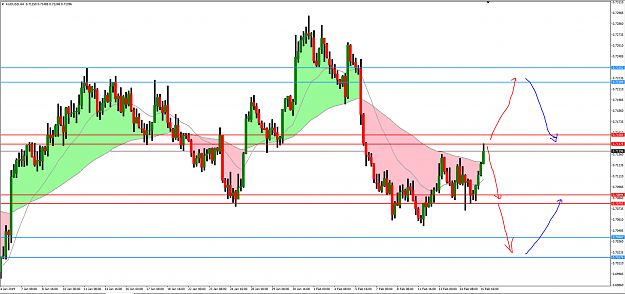
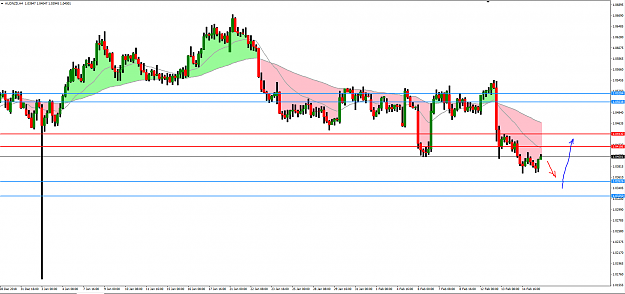
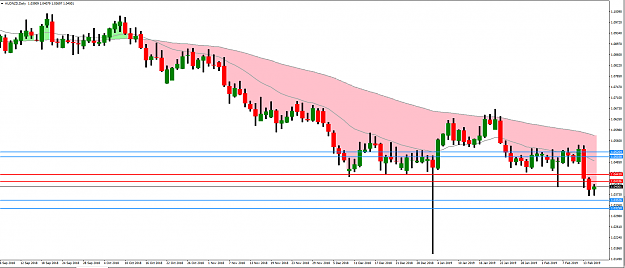
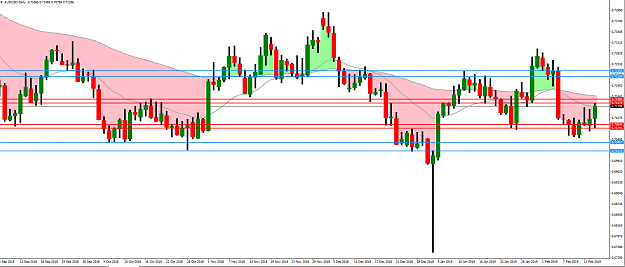
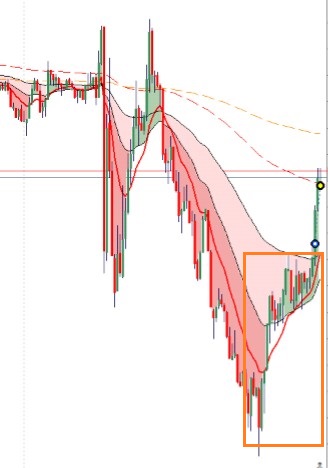
The price can be range in the yellow marked area for a while, A good entry can be find in H4 Month: AUDUSD image AUDNZD image H4: AUDUSD image AUDNZD image
Strat's PASR Long Term, Stress Free Trading
- LuisRicardo replied Feb 16, 2019
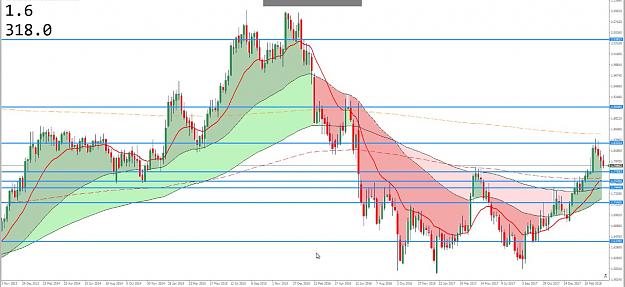
My point of view for AUDUSD and AUDNZD: BigBoss for both are in a consolidation area. Blue line for trade and target and red line only target. Better to trade on H4. image image
Strat's PASR Long Term, Stress Free Trading
- LuisRicardo replied Feb 16, 2019
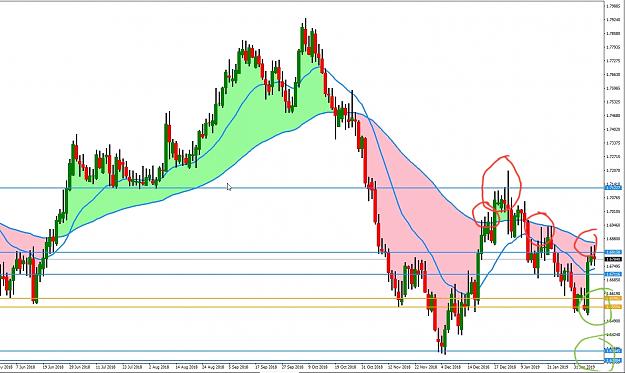
Hi Cj, this is what I think: With the way that I use to put a line, I can see strong SR on BigBoss, so I can't help too much there. But in the worker chart, I see a lot of strong resistance pushing the price down (Blue circle). In the bar that I ...
Strat's PASR Long Term, Stress Free Trading
- LuisRicardo replied Feb 13, 2019
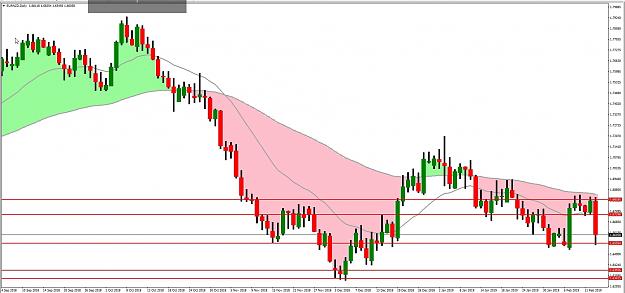
Rub, EURNZD go short, but was hard to catch image
Strat's PASR Long Term, Stress Free Trading
- LuisRicardo replied Feb 9, 2019
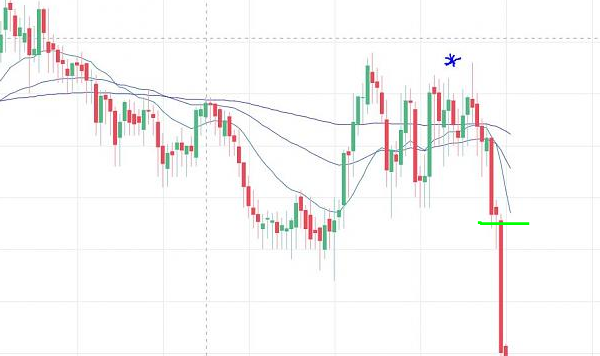
Hi Rub, I have different view on that pair looking for short Green circle are target image
Strat's PASR Long Term, Stress Free Trading
- LuisRicardo replied May 24, 2018
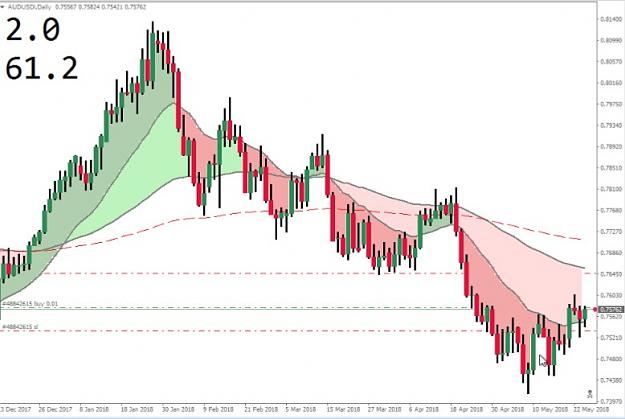
AUDUSD long for 60 pip target at next resistance, Big Boss and Boss Strat Shadow. image
Strat's PASR Long Term, Stress Free Trading
- LuisRicardo replied Apr 23, 2018
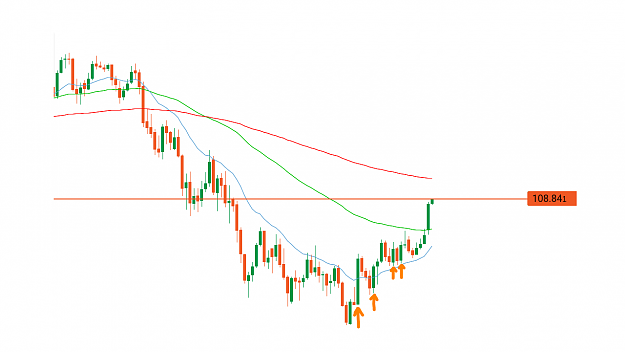
USDJPY Didn't take this trades, but post as example. All this entry are fine? image
Strat's PASR Long Term, Stress Free Trading
- LuisRicardo replied Apr 16, 2018
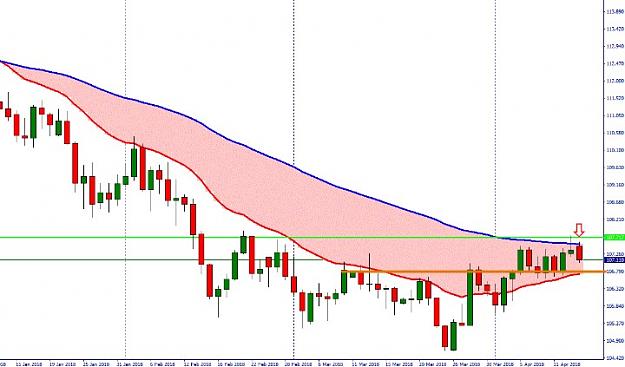
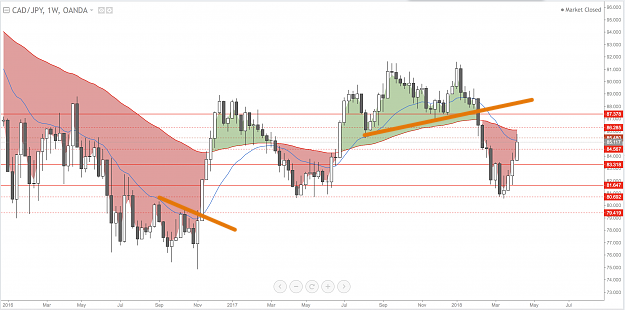
I draw with orange a support that can make reverse your trade. image
Strat's PASR Long Term, Stress Free Trading
- LuisRicardo replied Apr 15, 2018
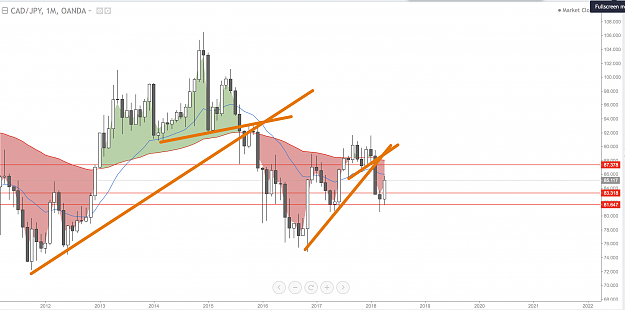
Just for help, I think there is a lot down break out to be on long image image However, I am not to good with trend line yet, but it's like changing up.
Strat's PASR Long Term, Stress Free Trading
- LuisRicardo replied Apr 14, 2018
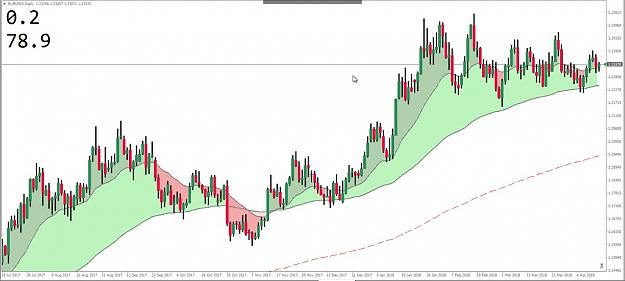
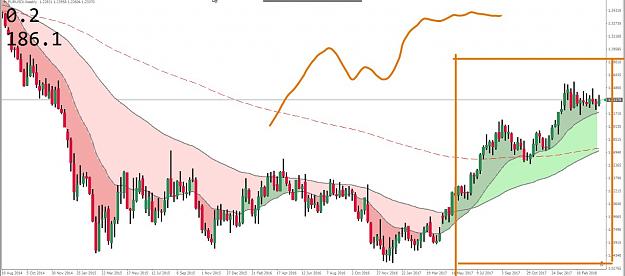
I will try to ilustrate what I am talking. And it's not over complicating, only knowing the tools. Worker Chart: image Boss Chart: image The square is the Worker Chart and the price move like the 20EMA of the Worker Chart Big Boss Chart: image ...
Strat's PASR Long Term, Stress Free Trading
- LuisRicardo replied Apr 13, 2018
You can't use the B or BB candle to trade or to confirm, if you do, you are late. Use B and BB chart only to see direction and place S/R, and use the W chart to trade. The point of WCC is not how to identify, but how to use it, when to use it and ...
Strat's PASR Long Term, Stress Free Trading
- LuisRicardo replied Apr 12, 2018
The entry point is in the mark i make, but in lower time frame. Not all pips have to be captured, or you'll end capturing pips where there's no. image
Strat's PASR Long Term, Stress Free Trading
- LuisRicardo replied Apr 11, 2018
Using what learned from you. I was only waiting a long position, now I added support and prepared for taking short too. Thanks again. image
Strat's PASR Long Term, Stress Free Trading
- LuisRicardo replied Apr 11, 2018
My GBPCAD BOSS Chart image
Strat's PASR Long Term, Stress Free Trading