- Search Forex Factory
- 139 Results (2 Threads , 137 Replies )
- Merka replied Apr 7, 2024
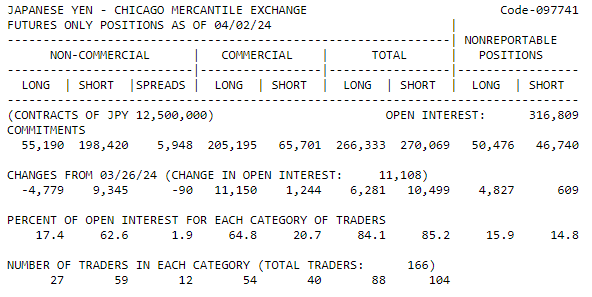
Hi,getting some different numbers from your. Can you please let me know where I'm wrong? Non commercial net long= 55190 Non commercial net short= 198420 Net positioning= 198420-55190= 143230 → short bias but you have long bias? Non commercial long ...
Special Thread: COT Data Analysis & Trading Signals
- Merka replied Apr 3, 2024
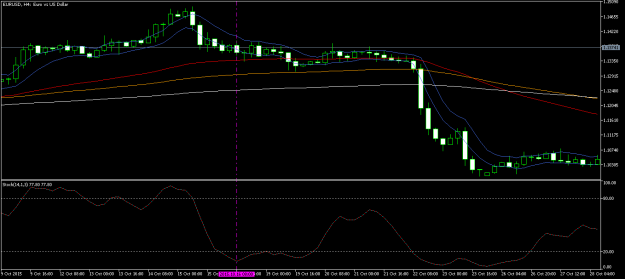
Price was clearly in a downtrend. Did you took the decision to enter just based on COT data?
Special Thread: COT Data Analysis & Trading Signals
- Merka replied Feb 28, 2024
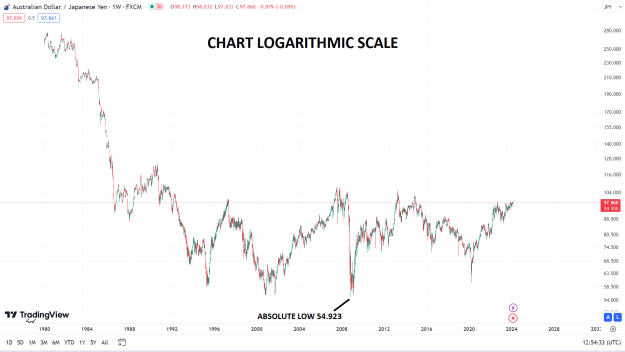
Thanks Ayax. do you count also monthly charts? Are you starting your count from the absolute low (on FXCM broker is 54.923)? Thanks
Elliott Wave Trading by Ayax
- Merka replied Feb 27, 2024
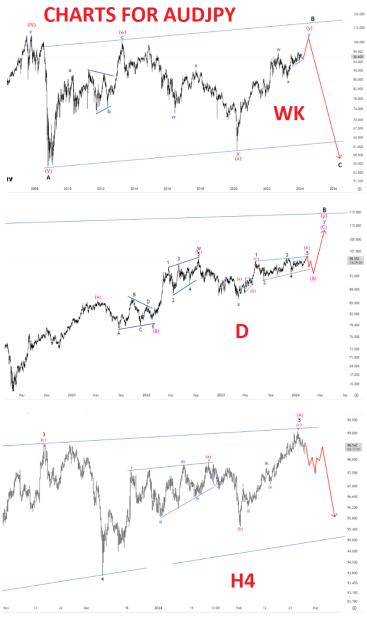
@Hi Ayax Would you mind to share your updated AUDJPY charts WDH4 please? Do you have also a Monthly view? I found this count on internet but not fully sure Thanks
Elliott Wave Trading by Ayax
- Merka replied Dec 9, 2023
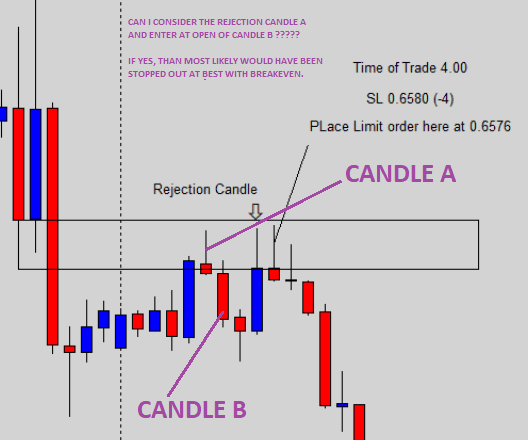
Why you didn't enter on this bullish candle rejecting your same resistance line?
No Indicator Trading System
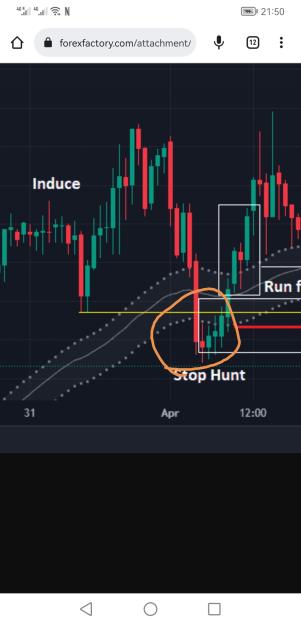
- Merka replied Nov 29, 2023
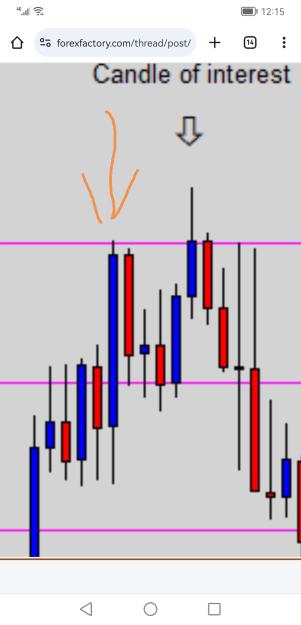
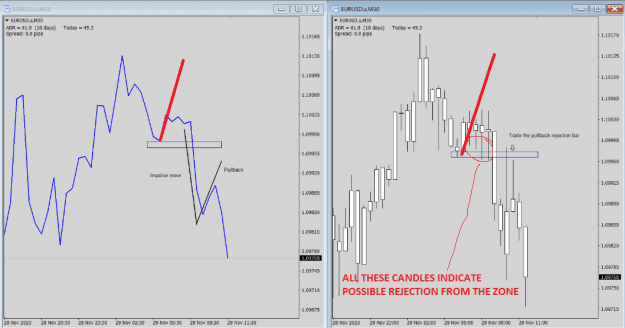
Why you didn't trade this zone upward? From where I marked, clearly price was bouncing upward, hence the question. You mark your SR lines and zones → all good but how you choose the direction of your trades is not very clear.
No Indicator Trading System
- Merka replied Jul 1, 2023
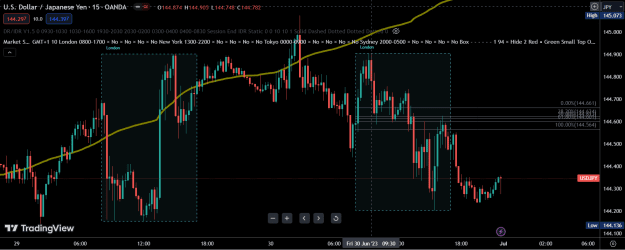
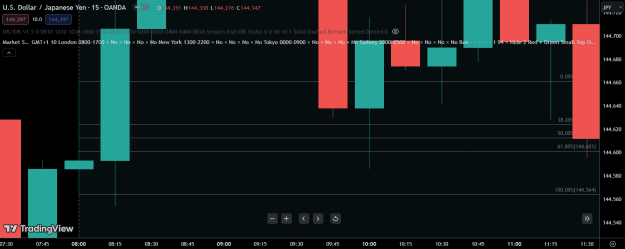
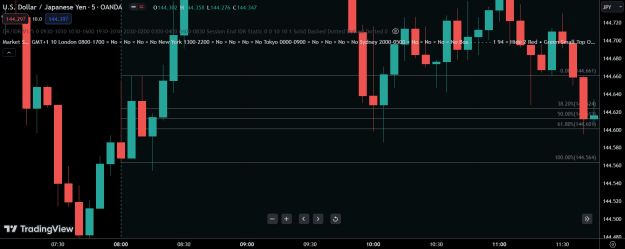
London session 15 minites range is 9.7pips price breaks the range low first and after moves upward. Can't understand if you enter short or long when price retrace back to fibs levels 38.2/50/61.8% ? Thanks Forex market time zone converter url
15 minute opening range Forex
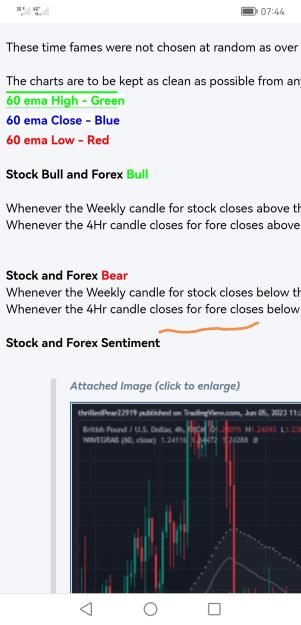
- Merka replied Jun 6, 2023
Price closes below so should be bearish. What happened next? Immediately after a complete reversal but sentiment was supposed to be bearish.
ISR Method
- Merka replied Jun 3, 2023
welcome back brother Can't extract this folder (see message errors below) Can someone upload as zip file?
(binned for possible virus) Updated trading advisor Grid MA ATR

- Merka replied May 13, 2023
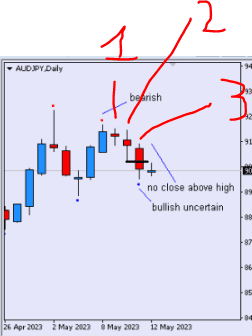
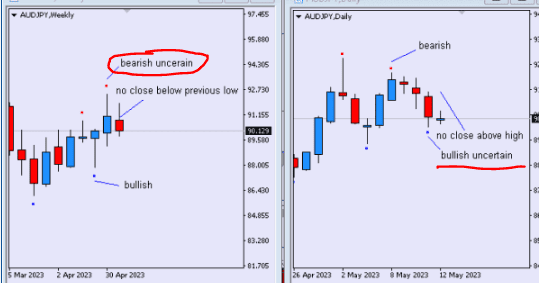
so, based on the same definition the daily is bearish because candle3 closed below candle2 and the fractal candles considered are as per picture. Correct?
SRTLfd Discussion
- Merka replied May 13, 2023
so, when a candle close above previous H → bullish trend → ok what role is playing the candle 1? because candle2 didn't close above candle1
SRTLfd Discussion
- Merka replied May 13, 2023
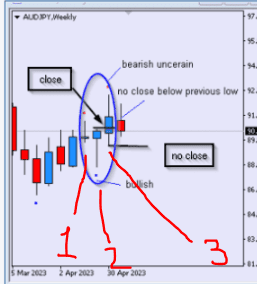
Thanks but have few questions what do you mean with bearish/bullish uncertain? On weekly you say bullish trend just because the last bearish candle didn't closed below the previous low? basicaly can't understand how this 3 candles fractal work for ...
SRTLfd Discussion
- Merka replied Feb 19, 2023
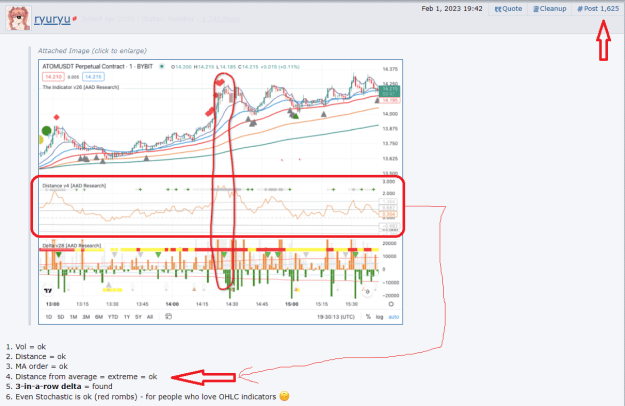
Hi @ryuyu I was reading this post #1625 but can't remember the 4) distance 2) Distance → [(High of EMA6)*100]/(Low of EMA6) 4) Distance from average → what average? Distance from where to where?
Most volatile EU/GU/XAU/BTC trading
- Merka replied May 28, 2022
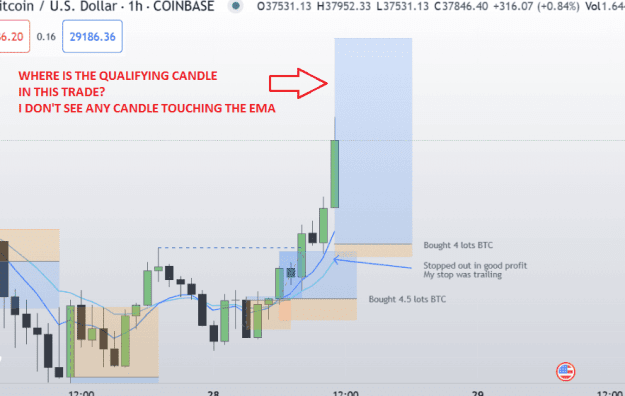
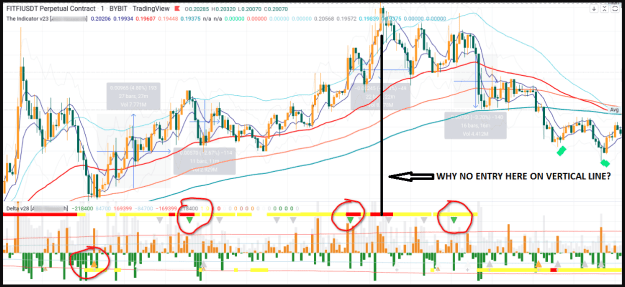
@ryuryu Why no entry where I marked in black with the vertical line? 1) price above EMA6 high --> Yes 2) you have distance from other EMAs --> Yes 3) you have delta flip --> Yes Maybe because your indicator at the bottom (I'm guessing is volume) is ...
Most volatile EU/GU/XAU/BTC trading
- Merka replied Jan 3, 2022
If price goes below point "E" than IDEA 3 is invalidated because wave2 cannot go below the start of wave1
Elliott Wave Trading by Ayax
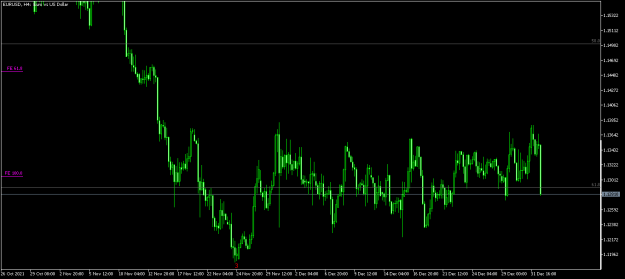
- Merka replied Jan 1, 2022
Is it correct this setup or just an unfortunate case? probably it's necessary to take the SL and move on. Isn't it? using EURUSD just as an example as I do not have crypto on this broker.
Most volatile EU/GU/XAU/BTC trading