- Search Forex Factory
- 605 Results
-
 OBsayMkMoney replied 17 hr ago
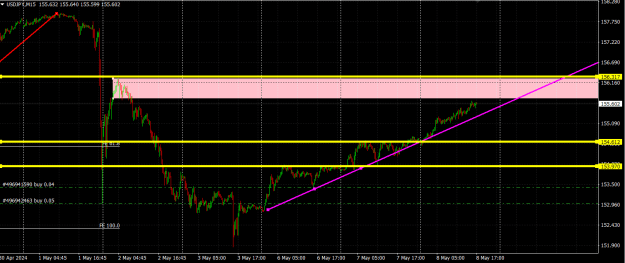
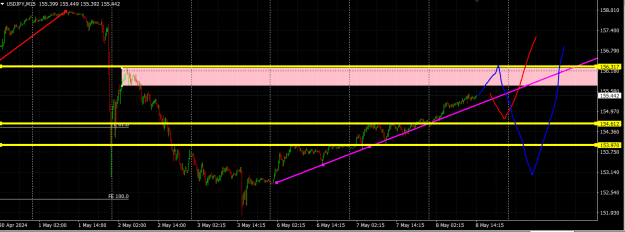
Still no break of trend.... Increasing possibility of us rejecting off of 156.3 area. Held these longs long enough (positive swap). I think I will TP them and come back in at the bottom again if I don't sell it on a retest on the lower time frames..
USD/JPY Discussion
- OBsayMkMoney replied 19 hr ago
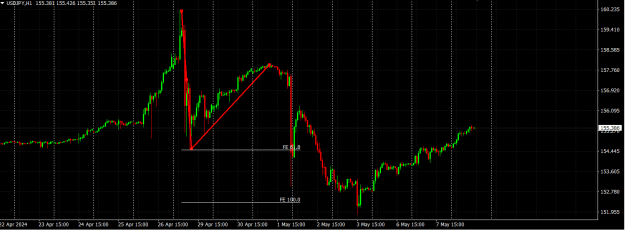
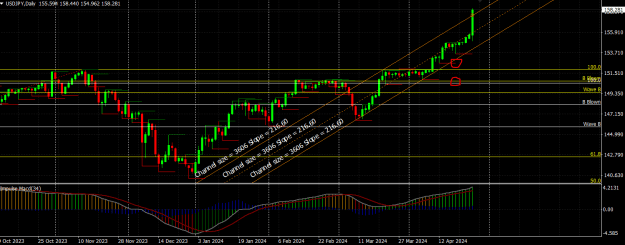
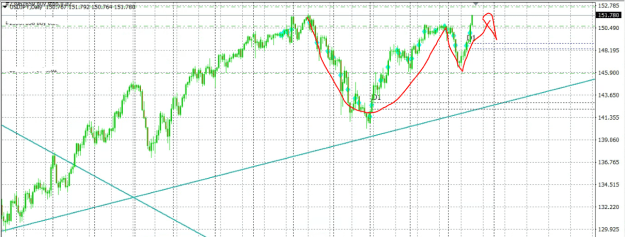
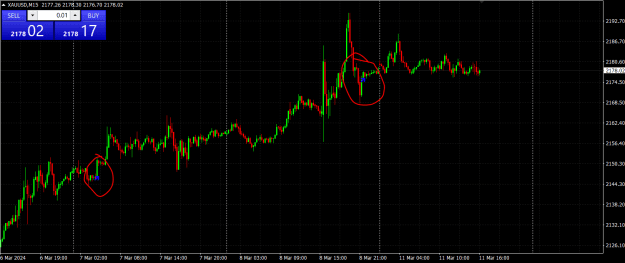
Shorter term... 1Hr Continuation patterns A bullish continuation is usually represented by price consolidating in an ABC pattern. This can be measured by using a Fib Extension and usually ends at the 100 percent area unless the news that made it ...
USD/JPY Discussion
- OBsayMkMoney replied 20 hr ago
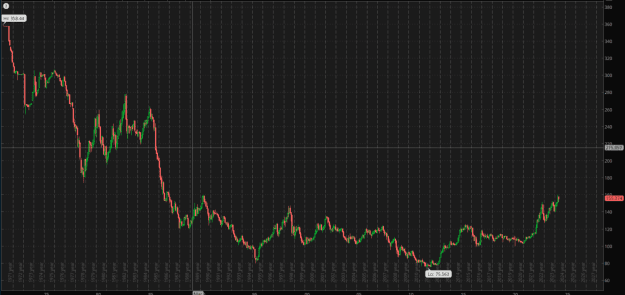
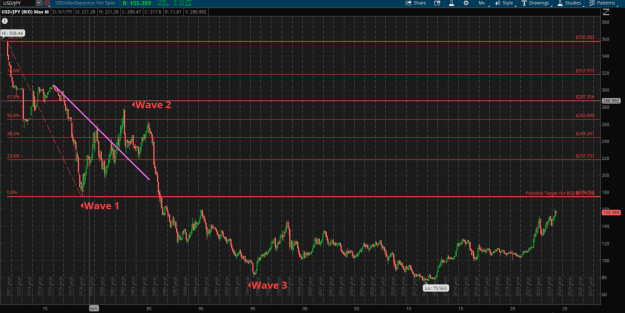
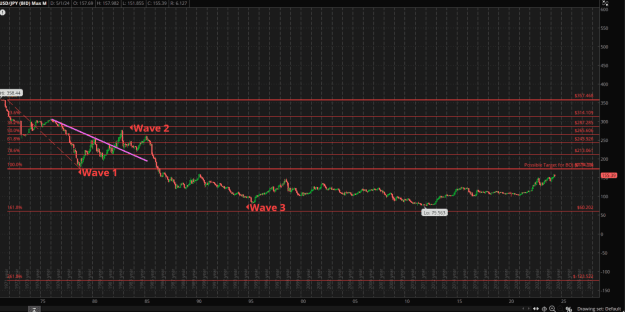
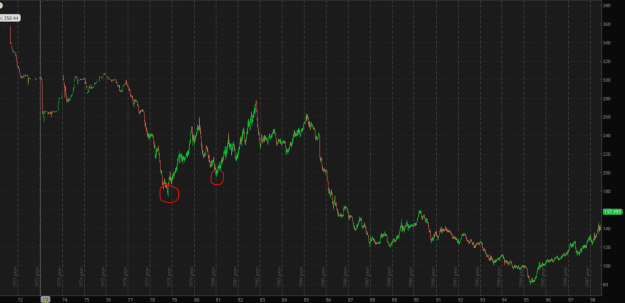
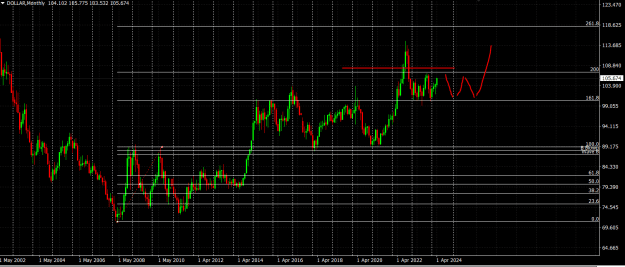
Edit.. Wave 3 moved to All time Low. I have seen more than a few of you claim "ALL TIME HIGHS" as we approached the current highs. In lieu of that, I would like to introduce you to the FULL history of USD/JPY. image Now, with that said, let's ...
USD/JPY Discussion


- OBsayMkMoney replied Apr 26, 2024
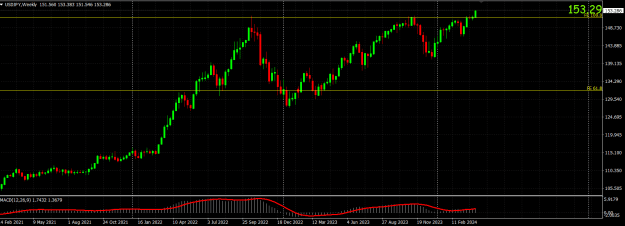
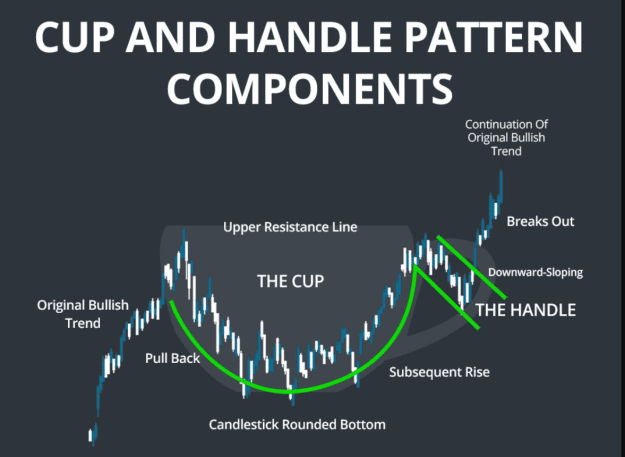
Daily and Weekly cup and handle. If we see any bearishness we could just be moving to these retest these areas. 157 is however the top of a range, so IF a drop is coming, it needs to come now. With the FED not making any changes until Sept (my GUESS ...
USD/JPY Discussion
- OBsayMkMoney replied Apr 26, 2024
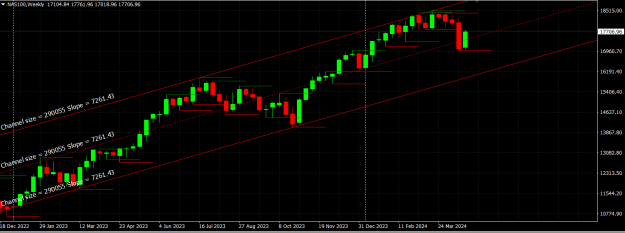
Maybe this will help you guys... Nas100 Weekly chart. We appear just below the previous area of balance. Retesting it. Should we enter that area we would be open to clearing the whole area of balance. I don't see it though. I believe next week we ...
USD/JPY Discussion
- OBsayMkMoney replied Apr 22, 2024
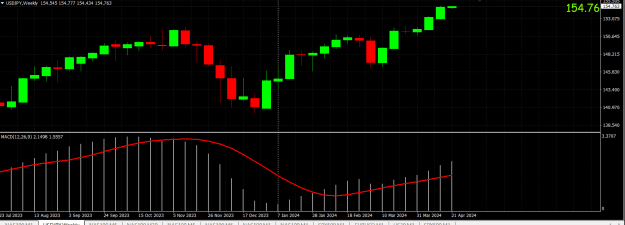
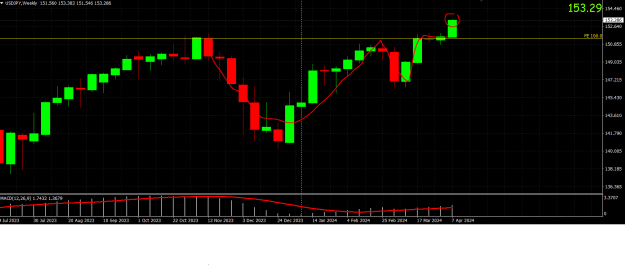
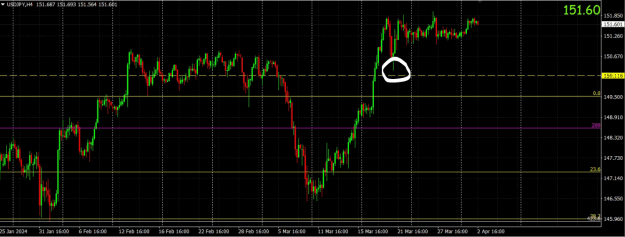
I don't know guys.. this doesn't look very bearish to me. image i mean this weekly chart looks very cup and handlish. Even has the small resistance at the top. Now I did say that I thought we would have some consolidation at these levels and ...
USD/JPY Discussion
- OBsayMkMoney replied Apr 13, 2024
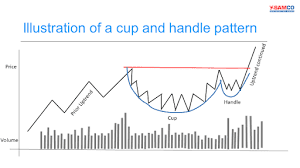
Non Sentimental analysis.. UJ on the Weekly chart appears to have not only formed a cup and handle, but now closed above the rim. image image If we pull the lens out it is almost identical to the Illustration. image Also this... image IF ...
USD/JPY Discussion
- OBsayMkMoney replied Apr 2, 2024
Indices appear to be rolling over. Short these levels, but only as a scalp. IMO more above to be had after small retracement. image
USD/JPY Discussion
- OBsayMkMoney replied Mar 20, 2024
UJ on higher time frames looking a lot like a cup and handle. If we break above and hold the target is the length of the cup. However if it fails 146 is the short term target. If it holds will buy on the retest of the highs. Otherwise on the retest ...
USD/JPY Discussion
- OBsayMkMoney replied Jan 24, 2024
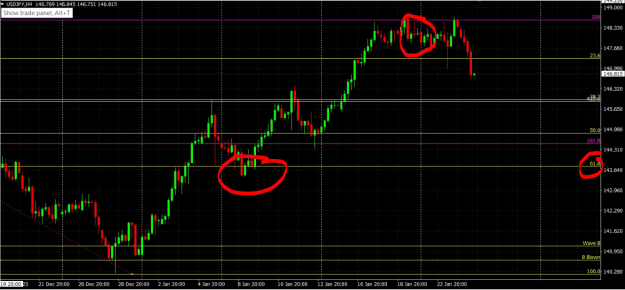
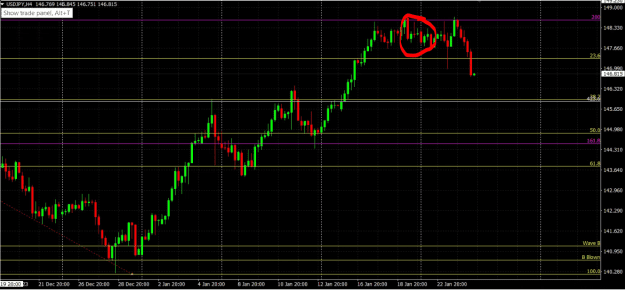
Short term short target. If this continues I am targeting the SECOND lower High. When price takes out two of the previous lower highs to me that signals a bearish turn. I don't think it will turn bearish on the medium time frames, so that is the ...
USD/JPY Discussion
- OBsayMkMoney replied Jan 24, 2024
UJ has a nasty habit of turning JUST when you think it is ridiculous that it will. The circle is where you posted and looks very much like a wave 3 finished. If so 144.9 area could see some support before 143 gets some love. image
USD/JPY Discussion
- OBsayMkMoney replied Jan 24, 2024
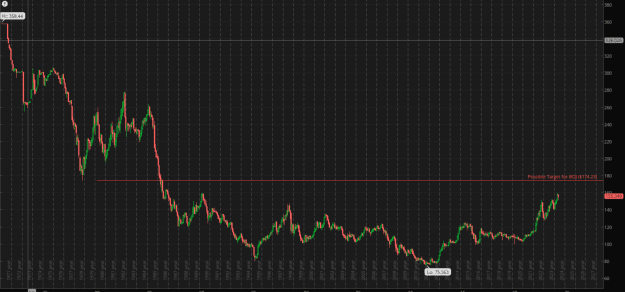
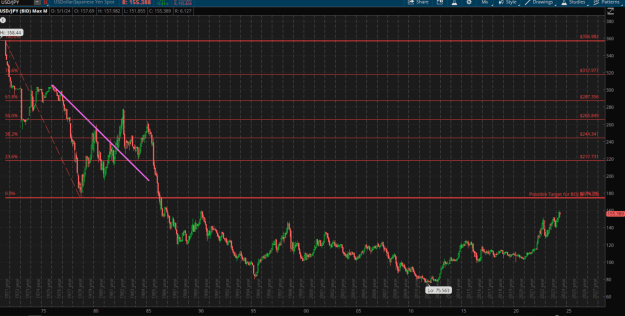
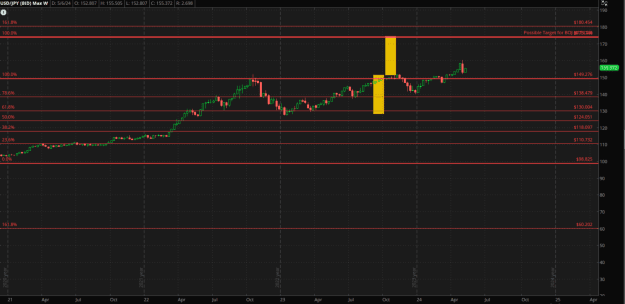
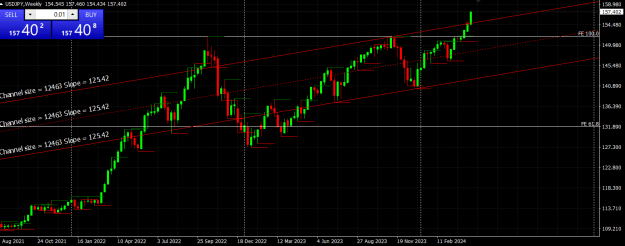
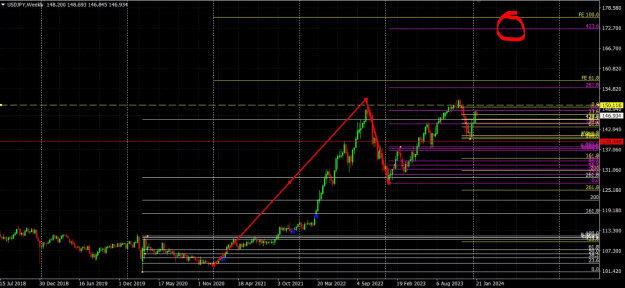
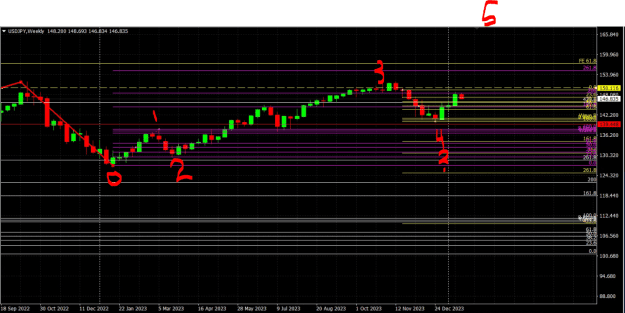
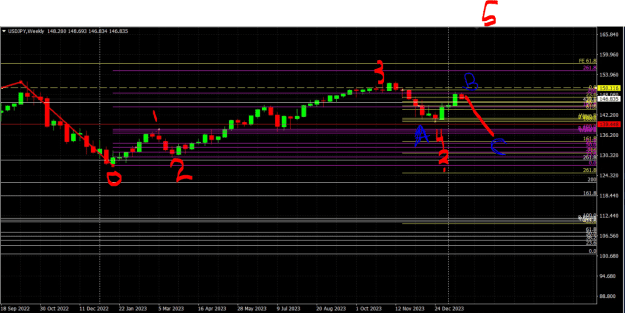
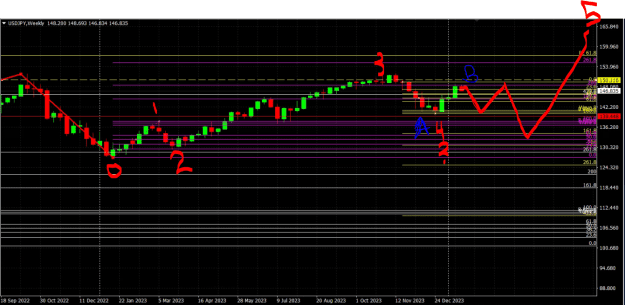
USD/JPY Weekly long target 172. We appear to be in Wave 5 of 5. 154.600-157 looks like a good place for a possible first rate cut to retest the current highs before finishing off. image image HOWEVER... Wave 4 also does not appear finished. If ...
USD/JPY Discussion
- OBsayMkMoney replied Jan 10, 2024
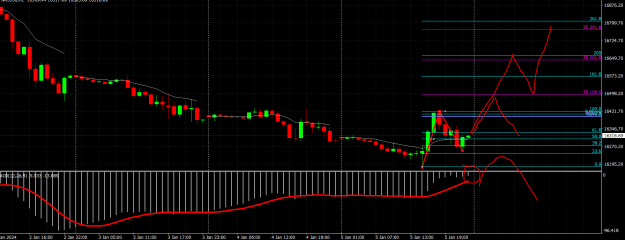
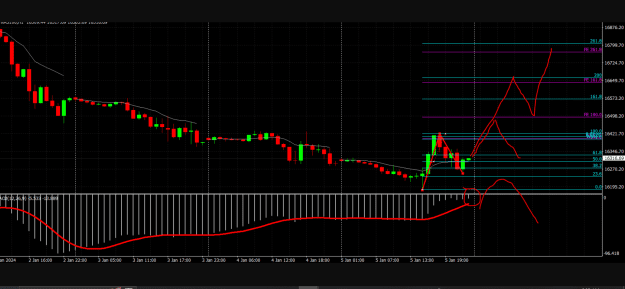
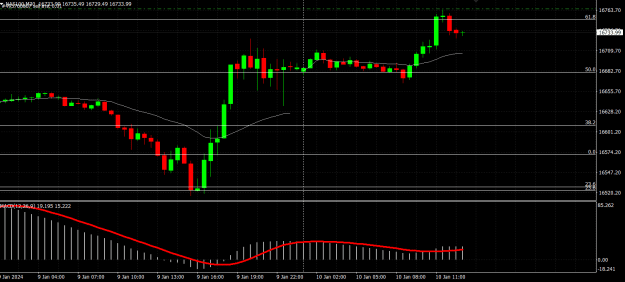
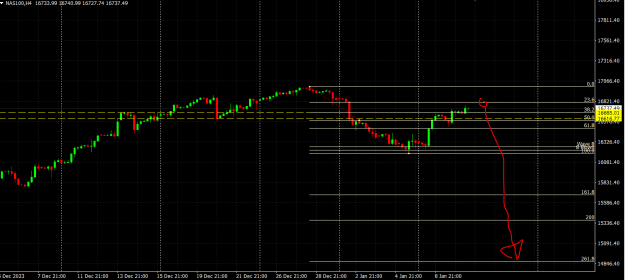
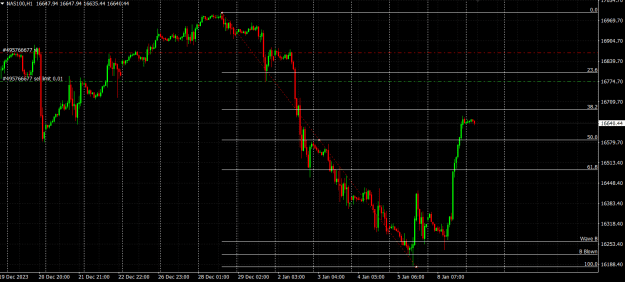
This was then... image This is now... image I believe 15000 is now on deck. Last week was bearish. The whole week. This is rarely a one time thing. I see us as having ended wave 3 on the daily/4hr and are now making wave B off of of it. If I am ...
Carpe diem: Intraday tactics for Dax and Dow
- OBsayMkMoney replied Jan 8, 2024
Remember this? Yesterday morning premarket.. image Why do I think it is important? We came down to the 23% a level where some thiought it would continue through the bearish behavior, yet it turned RIGHT around. Now we are headed up. What do we ...
Real Trading
- OBsayMkMoney replied Jan 8, 2024
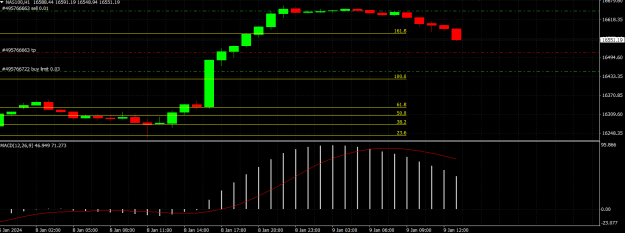
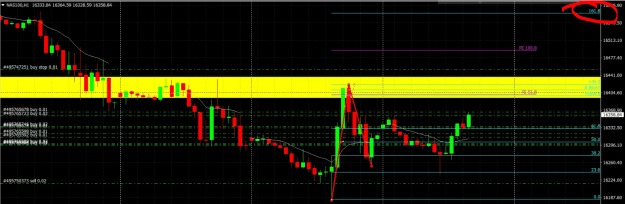
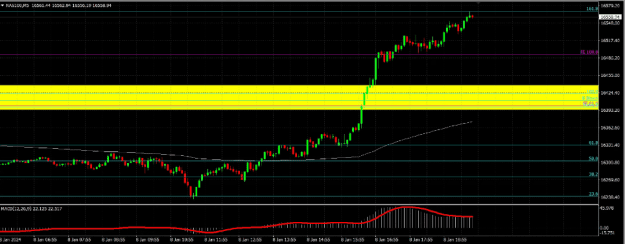
Then.... image Now... image I love how Nas100 respects the FIBS. Will see what we do above the 161. See if she wants to go to the 261.
Cable Update (GBPUSD)


- OBsayMkMoney replied Jan 8, 2024
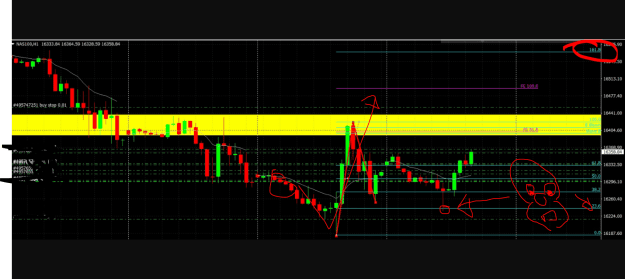
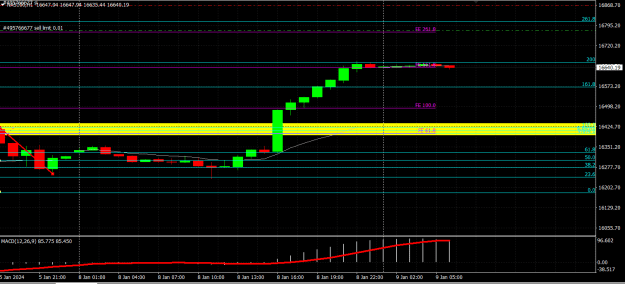
NAS100 Long for the UK market. I am amending my level. 261 is a bit overzealous I think. Target set to the 161. Will add more once we cross the yellow sea. (IF) image After.. image Market close I played it safe.. Too many open trades to F around.
Real Trading
- OBsayMkMoney replied Jan 7, 2024
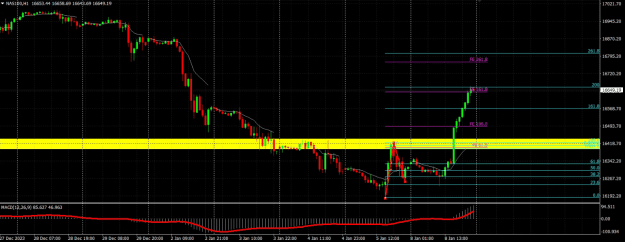
NAS100. We had our first weekly bear candle. It engulfed three weeks of trading signaling to me that there is more to come. However the week ended with some buying pressure that i do not believe is finished. The 1HR chart also appears to be alluding ...
Real Trading