- Search Forex Factory
- 134 Results
-
 Pleiadian replied Jun 29, 2019
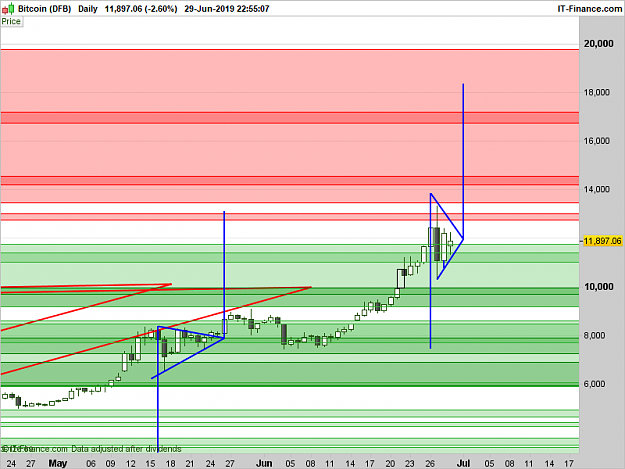
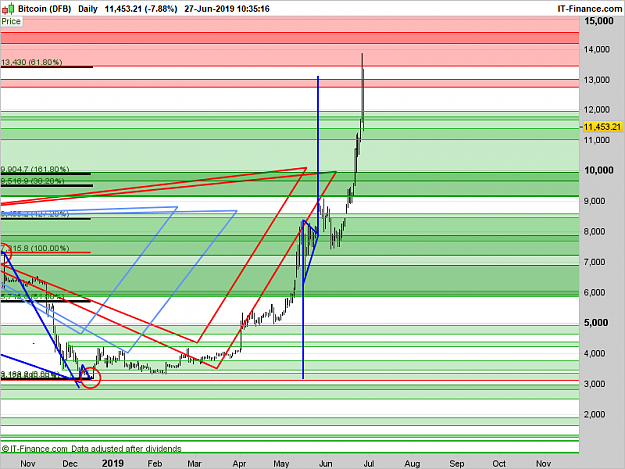
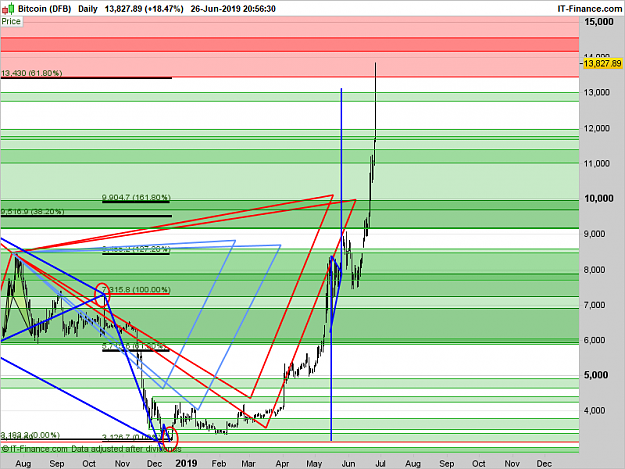
The Structure Support Zone is holding up well! Here is my forecast for the next price move on the Daily chart. Looks like there is going to be another Flag Pole rally i.e. equidistant move. The breakout will probably happen on Monday 1st of July. ...
The rise of CRYPTO - Bitcoin, LTC, Ether, Dash, Monero
- Pleiadian replied Jun 28, 2019
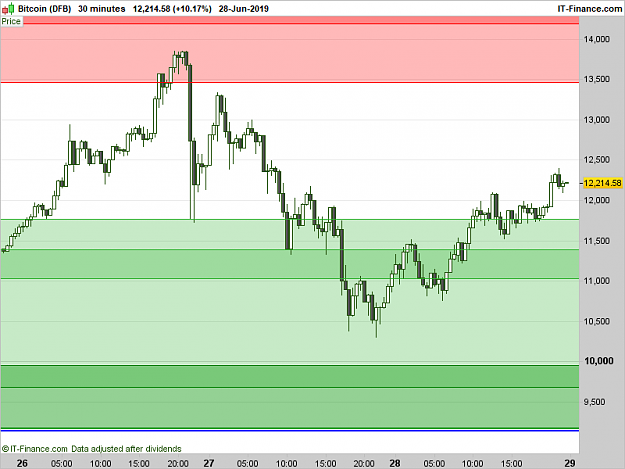
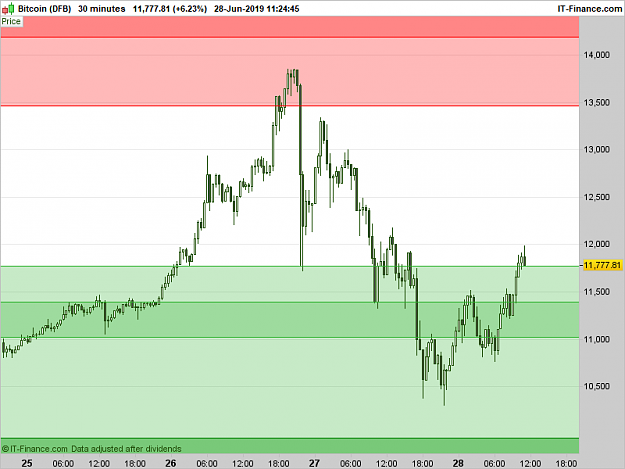
Support held up price during today at the current Structure Support Zone on this 30 min chart
The rise of CRYPTO - Bitcoin, LTC, Ether, Dash, Monero

- Pleiadian replied Jun 28, 2019
The market did not want to go to $10,000, so instead price made a Double Bottom, clear to see on 30 min chart, retested the Structure Resistance Zone at $11,000 a couple of times, which has now become a Structure Support Zone and looks like the ...
The rise of CRYPTO - Bitcoin, LTC, Ether, Dash, Monero
- Pleiadian replied Jun 27, 2019
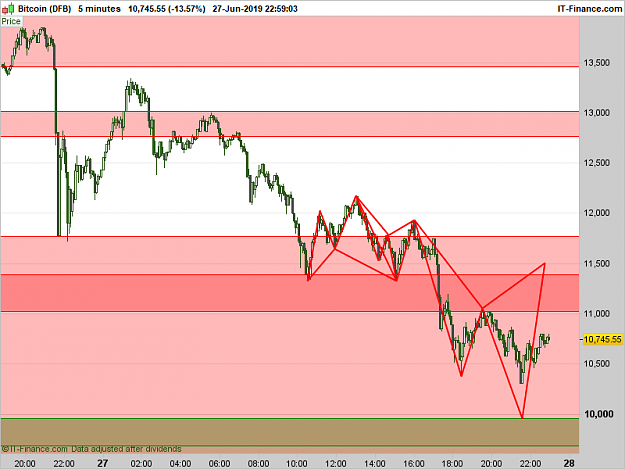
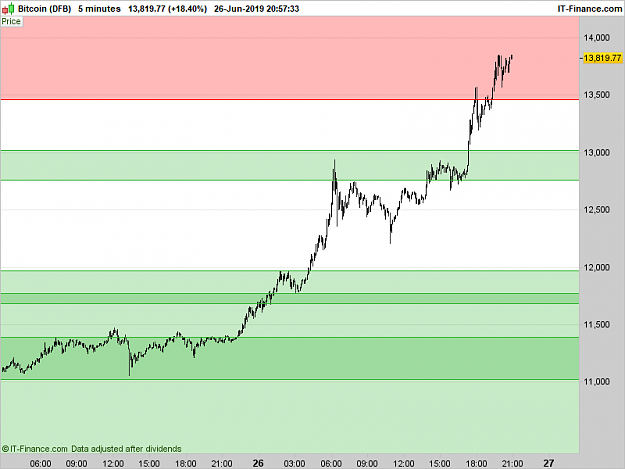
Price is stepping down in a series of harmonic patterns, on this 5 min chart, all Cypher Patterns, and testing structure zones on the way down. The last pattern is a forecast, and as you can see the swing high on this forecast is bang on $10,000, if ...
The rise of CRYPTO - Bitcoin, LTC, Ether, Dash, Monero
- Pleiadian replied Jun 27, 2019
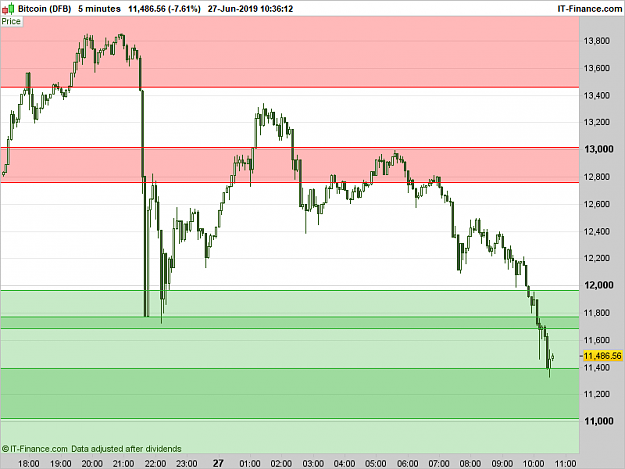
Price retested Structure Support Zone, a little deeper that expected, so the $13,000 zone I have change back to a Structure Resistance Zone. Price has retested two lower Structure Support Zones, see 5 min chart. Did anyone fall for the FOMO trap ?
The rise of CRYPTO - Bitcoin, LTC, Ether, Dash, Monero
- Pleiadian replied Jun 26, 2019
Hi All. I was reviewing my Structure Analysis Zones and discovered I had deleted one of the Structure Zones. but I have reprinted it where it is supposed to be, that narrow Structure Zone at $13,000. It did provide resistance to price action, see ...
The rise of CRYPTO - Bitcoin, LTC, Ether, Dash, Monero
- Pleiadian replied Jun 22, 2019
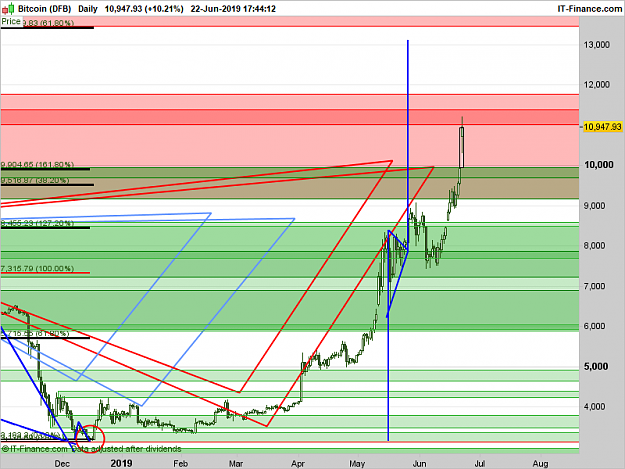
Here is my my analysis, that is over two years old, and price is following it beautifully. All of the green was Structure Resistance Zones, so now has become Structure Support Zones. The last four days has been pushing up into the current Structure ...
The rise of CRYPTO - Bitcoin, LTC, Ether, Dash, Monero
- Pleiadian replied Jun 5, 2019
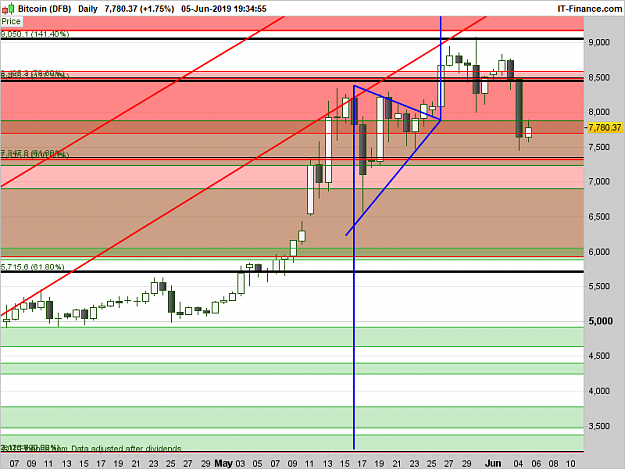
[quote=Pleiadian;12296345]Price has pushed up through all of these Structure Zones, from different time frames, so I have changed two zones from red to green. I am 3 days premature on one of the zones as it is a monthly time frame zone, the month of ...
The rise of CRYPTO - Bitcoin, LTC, Ether, Dash, Monero
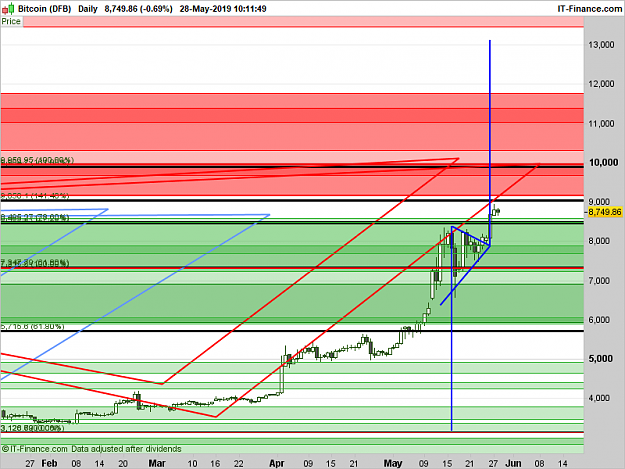
- Pleiadian replied May 28, 2019
Price has pushed up through all of these Structure Zones, from different time frames, so I have changed two zones from red to green. I am 3 days premature on one of the zones as it is a monthly time frame zone, the month of May, the other zone a ...
The rise of CRYPTO - Bitcoin, LTC, Ether, Dash, Monero
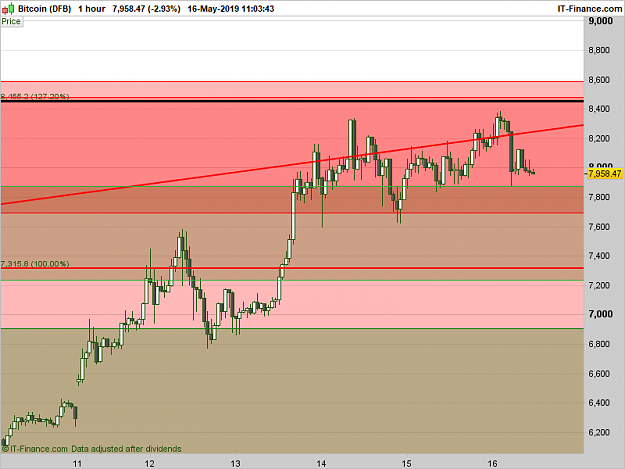
- Pleiadian replied May 16, 2019
[quote=Pleiadian;12271131] Bitcoin price action is taking a breather, on this 1hr chart, and consolidating on these overlapping Support/Resistance Structure Zones, from different time frames, before making its next move.
The rise of CRYPTO - Bitcoin, LTC, Ether, Dash, Monero
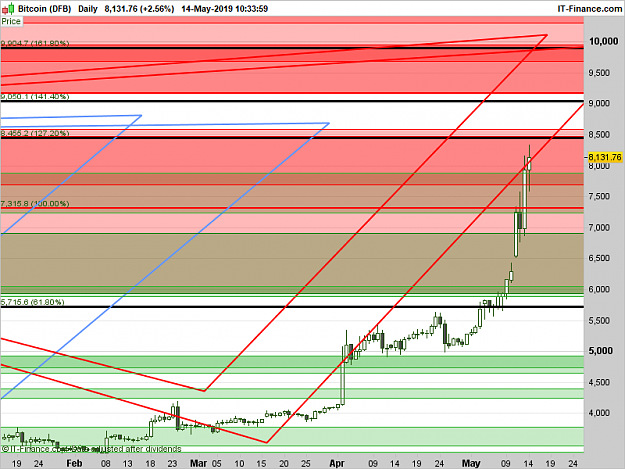
- Pleiadian replied May 14, 2019
[quote=Pleiadian;12267142] Price is still following my forecast. Yesterdays' price action closed above another Structure Resistance Zone, so changes from red to green, a Structure Support Zone. Notice that there is a red band inside the green zone, ...
The rise of CRYPTO - Bitcoin, LTC, Ether, Dash, Monero
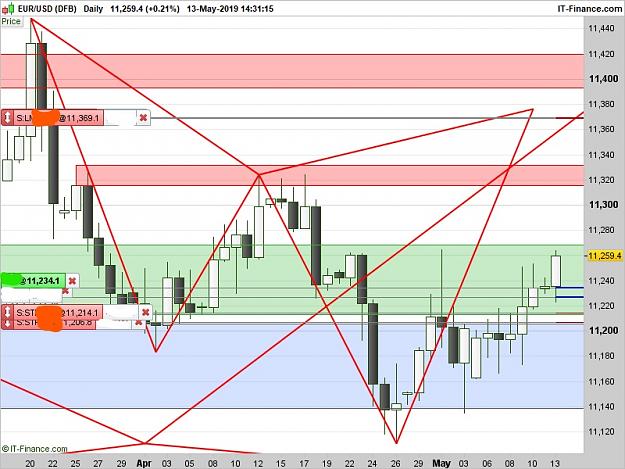
- Pleiadian replied May 13, 2019
Price is still following this harmonic setup on the Daily.
EURUSD only
- Pleiadian replied May 12, 2019
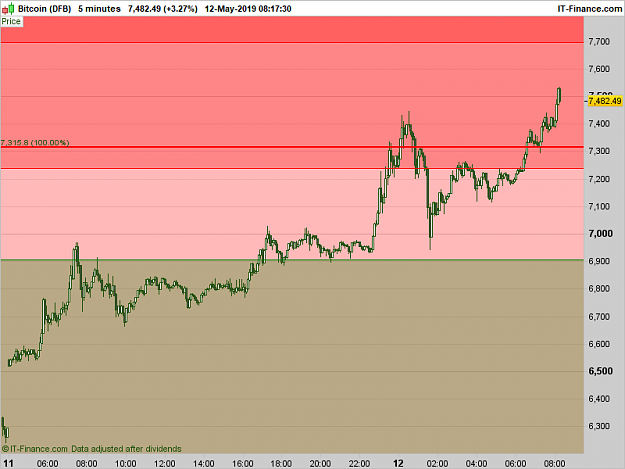
[quote=Pleiadian;12267142] Yesterdays' price action closed inside the next Structure Resistance Zone and todays' price action retested previous Structure Resistance Zone, see 5min chart , which is now a Structure Support Zone and pushing up into the ...
The rise of CRYPTO - Bitcoin, LTC, Ether, Dash, Monero
- Pleiadian replied May 11, 2019
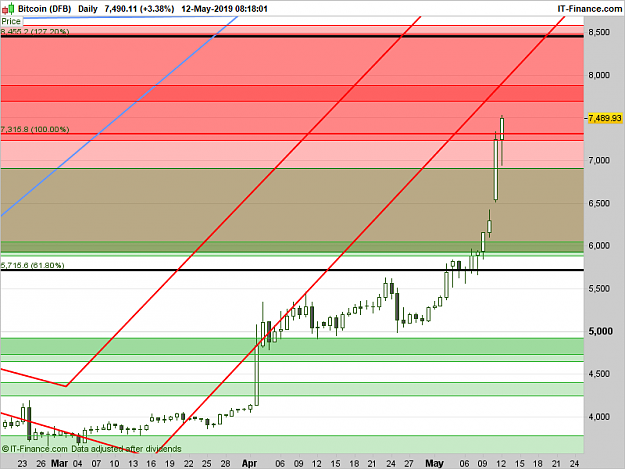
[quote=Pleiadian;12262137]Hello all, time I posted some stuff now that there is some momentum developing in the crypto space Here is what todays' price action looks like on my Daily chart Structure Resistance Zones forecast. May see a retest of this ...
The rise of CRYPTO - Bitcoin, LTC, Ether, Dash, Monero
- Pleiadian replied May 8, 2019
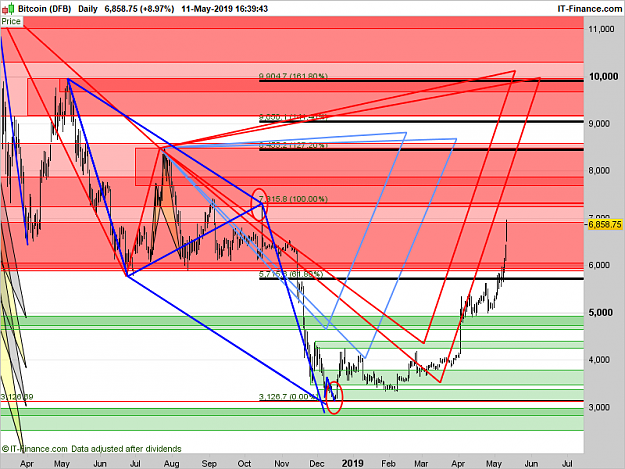
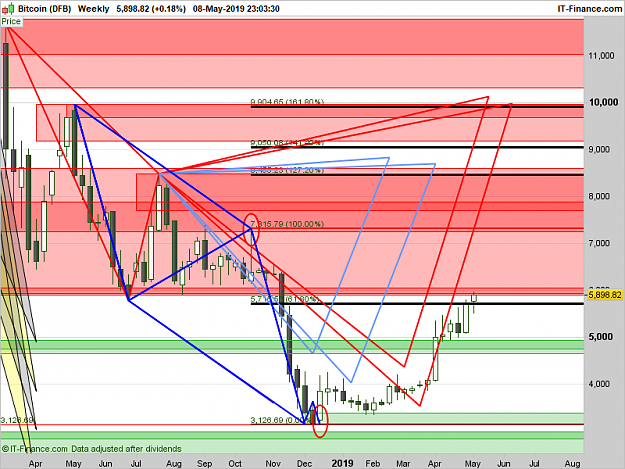
Hello all, time I posted some stuff now that there is some momentum developing in the crypto space. Here is my BTCUSD harmonic forecast that are now 5 months old and following nicely. All of the red stuff is Structure Resistance Zones, on different ...
The rise of CRYPTO - Bitcoin, LTC, Ether, Dash, Monero
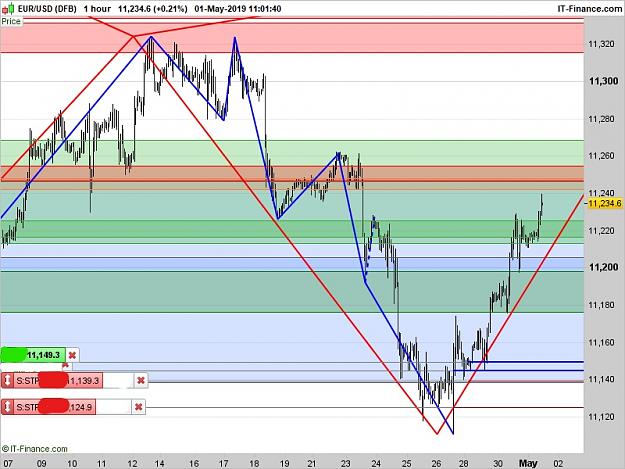
- Pleiadian replied May 1, 2019
Price has pushed up through a couple of structure zones, the latest is the narrow green one, which I changed from red to green and is now support. Next is that red structure resistance zone. The zones displayed on this chart are from different time ...
EURUSD only
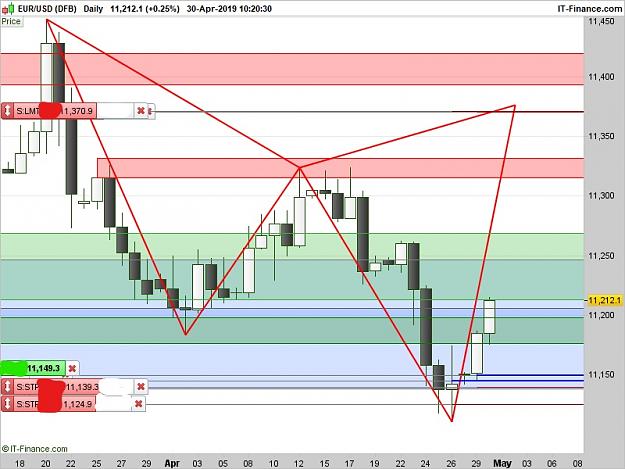
- Pleiadian replied Apr 30, 2019
I left my Friday 26th position open over the weekend and added to my position on Monday 29th @ 00:30 BST as direction looked to be confirmed as price is following the predicted direction of the Cypher Pattern. Currently 129 pips total in profit, ...
EURUSD only
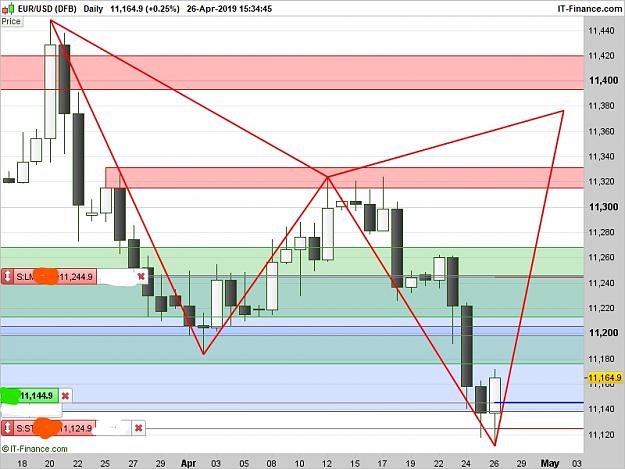
- Pleiadian replied Apr 26, 2019
Potential Cypher Pattern setting up on the daily chart at Demand Zone. Managed to get in early enough!
EURUSD only
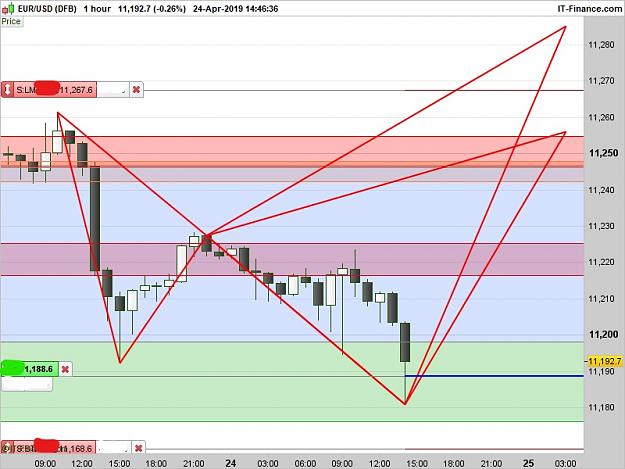
- Pleiadian replied Apr 24, 2019
Potential Bear Shark Pattern setting up on 1 hr chart. Whilst I was out and about in my capital city of London yesterday, yesterdays' price action hit my target of 50 pips @ 1,1207.8 @ 15:10 BST. NICE
EURUSD only
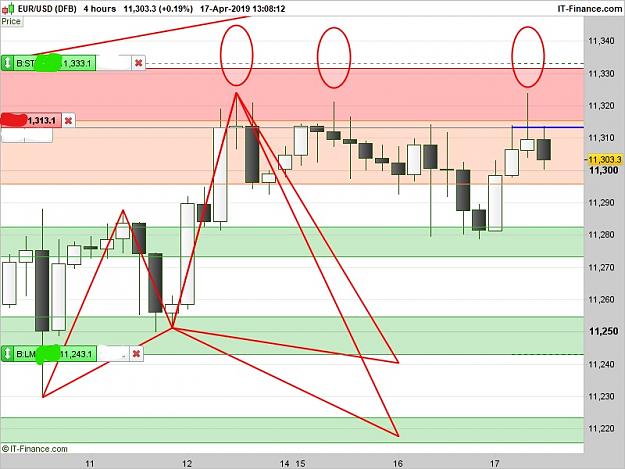
- Pleiadian replied Apr 17, 2019
In addition to the Shark Pattern there is also a Triple Top on this 4 hr chart, also clear on 1hr chart. This is quite a good confirmation that we are heading south
EURUSD only