- Search Forex Factory
- 14 Results
-
 Royal146 replied Dec 29, 2020
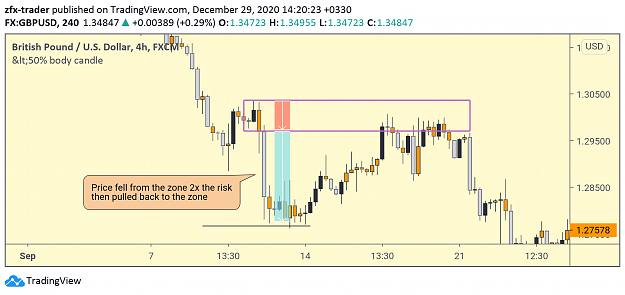
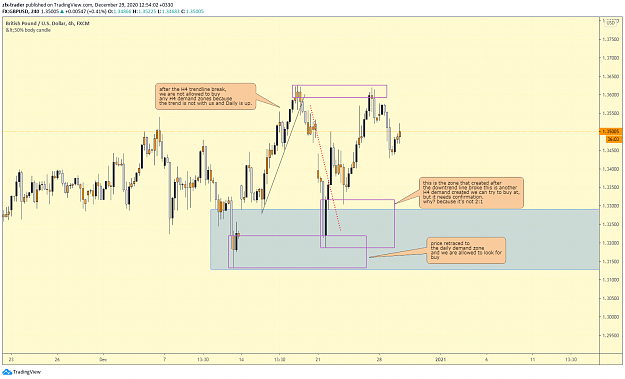
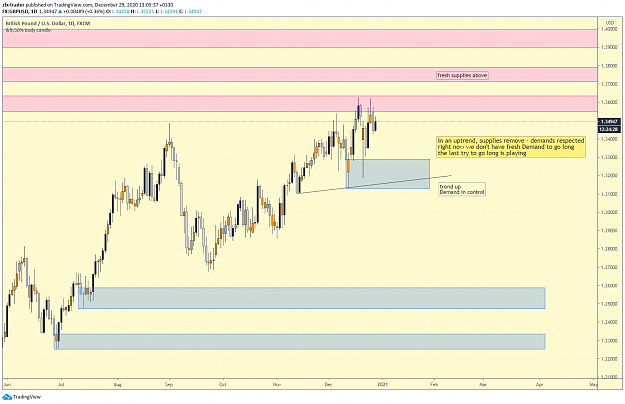
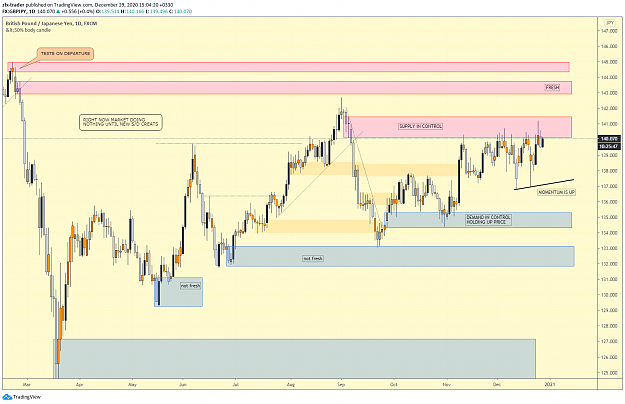
Hi, This is what I think on GBPUSD please correct me if I'm wrong. I will share more. D/H4/H1 is my sequence. image image GBPJPY - DAILY nothing much to do now I think sideway, momentum up image .
Trading Institutional Order Flow
- Royal146 replied Sep 7, 2020
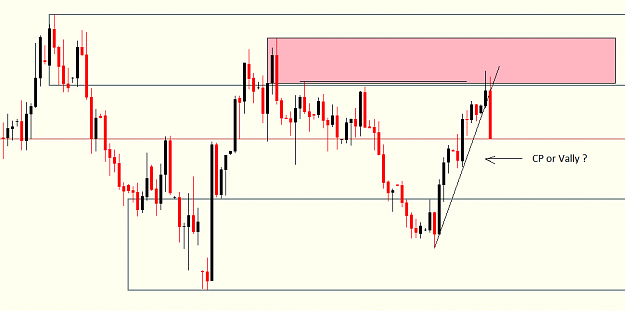
Hey guys, Do you take this zone as CP or Valley? Thanks image
Trading Institutional Order Flow
- Royal146 replied Aug 27, 2020
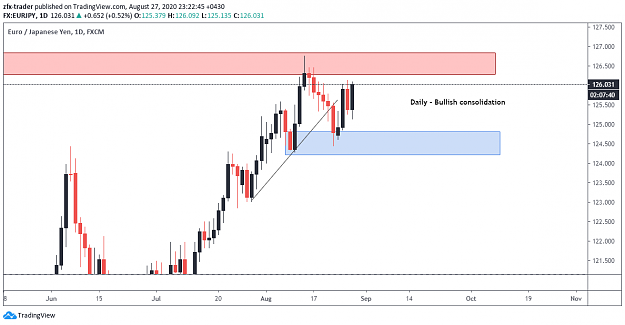
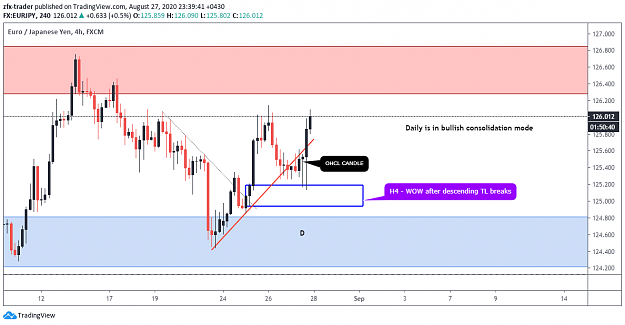
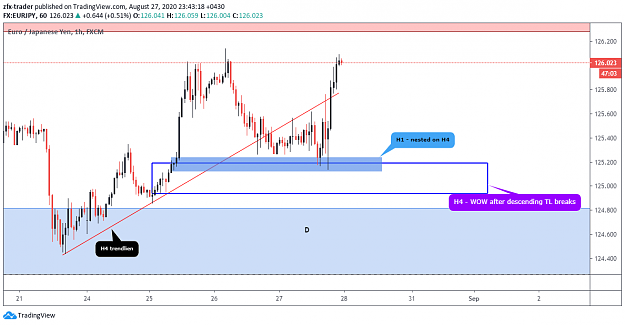
Hello guys, I'm a bit upset about the recent decisions that I've taken. I explain why. I set a buy limit order on H1 EURJPY yesterday. and the reason I set the pending order was that. Daily ( curve) was in a bullish consolidation. ( in consolidation ...
Trading Institutional Order Flow
- Royal146 replied Aug 22, 2020
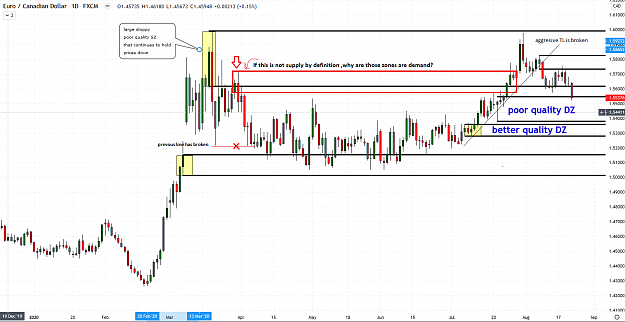
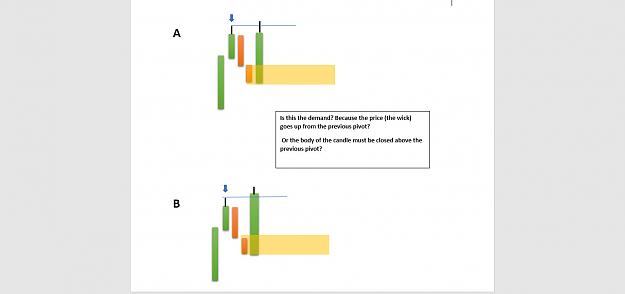
Thank you very much AKT, but I don't understand why those little zones are demand? because they didn't remove any valid supply .the only valid one is holding price down as you said but its still not taken out! so I assume they are buying (very weak) ...
Trading Institutional Order Flow
- Royal146 replied Aug 22, 2020
Hello Traders I'm a little confused about finding current supply and demand(in control) on EURCAD daily TF as the curve. we know a valid supply must remove a valid opposing demand zone or supply is created after ascending TL is broken vise versa for ...
Trading Institutional Order Flow
- Royal146 replied Aug 18, 2020
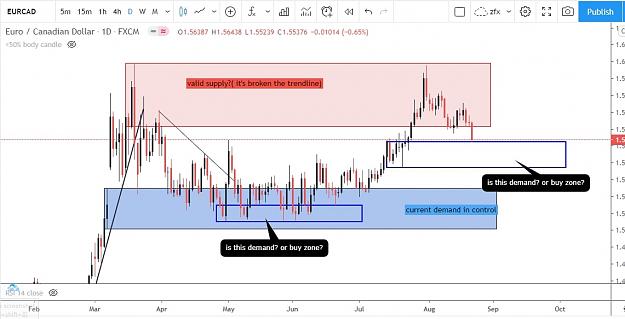
Hey guys Are these the current valid Supply and demand on the daily? (EURCAD) correct me if I'm wrong. thanks, url
Trading Institutional Order Flow

- Royal146 replied Aug 9, 2020
Hey guys, I use MT4 platform, after updating to 1280 buid 4 version. some of my indicators not working, (=< 50% basing candles), anybody can help me to solve this problem or re writing the code?
Trading Institutional Order Flow
- Royal146 replied Aug 9, 2020
Hello guys I want an indicator that puts a dot on basing candles 50% or lower body. after updating MT4 to 1280 my current 50% body candle not working.the indicator is .ex4 format and can't recompile it, I wonder if someone can write new codes. ...
Looking for 50% of candle indicator

- Royal146 replied Aug 9, 2020
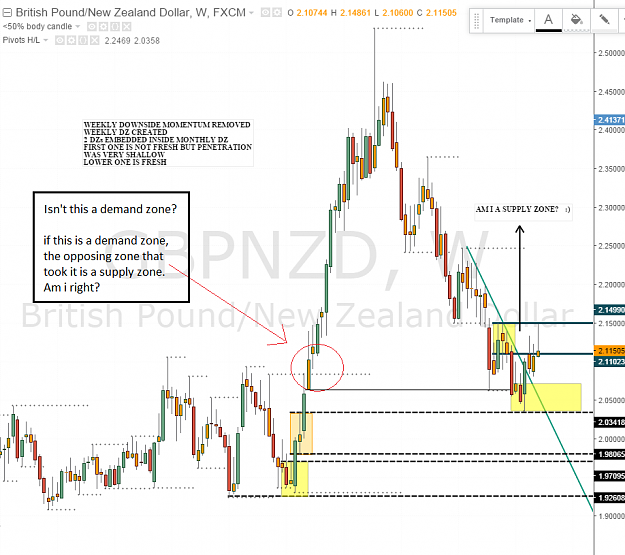
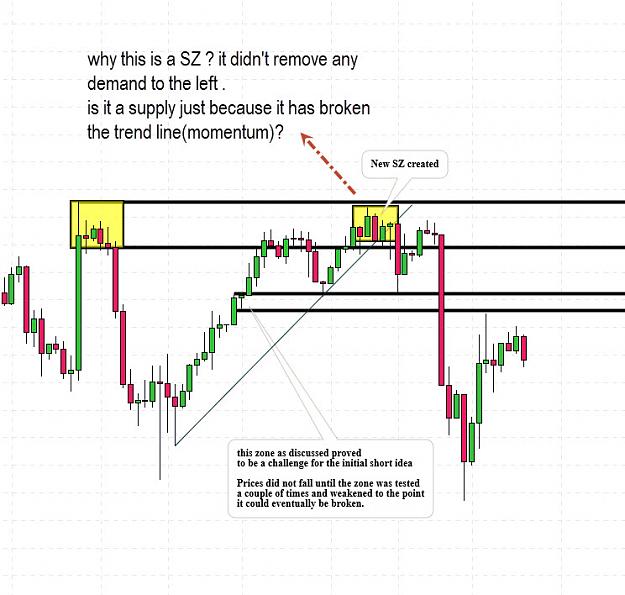
Hello Traders, I have a question in regard to an old AKT post. Is it a supply zone(W -SZ)? I think it is (if the basing zone on the left considered as demand) that took out by supply. I attach the picture. Please correct me if I'm wrong. What is ...
Trading Institutional Order Flow
- Royal146 replied Oct 14, 2019
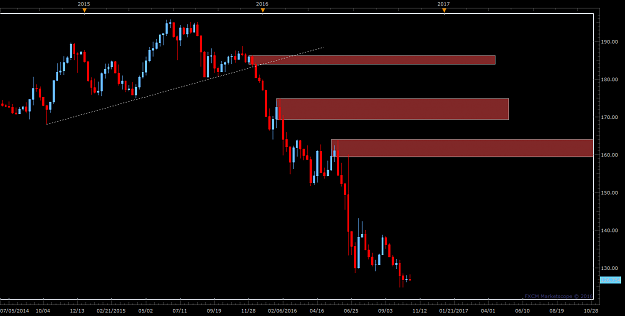
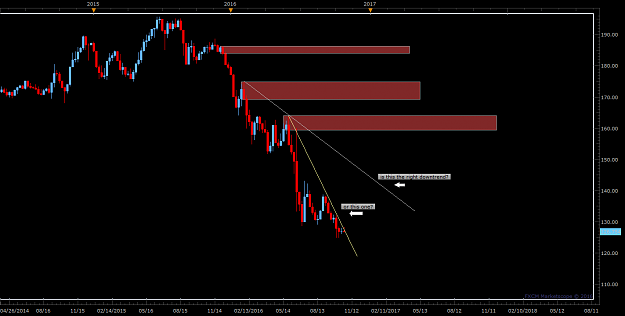
Hey guys, I have a problem to find the right peaks to draw the downtrend here, this is a weekly chart of GBPJPY (2016). I'm so confused. please help!
Trading Institutional Order Flow
- Royal146 replied Sep 30, 2019
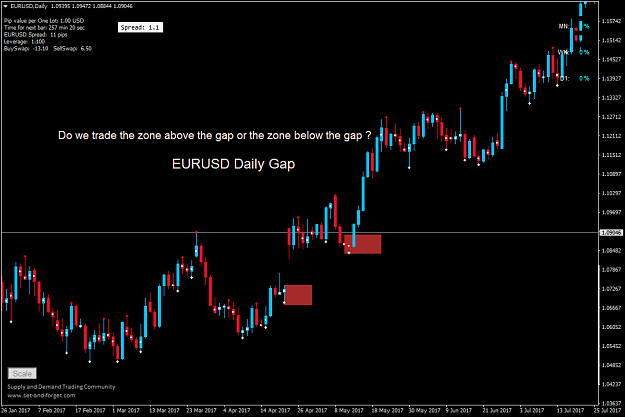
Hey guys, I have a quick question! it's about the gap. which zone do we take as demand when there is a pro gap in the chart? the zone above the gap or below the gap? EURUSD daily Thanks
Trading Institutional Order Flow
- Royal146 replied Aug 27, 2019
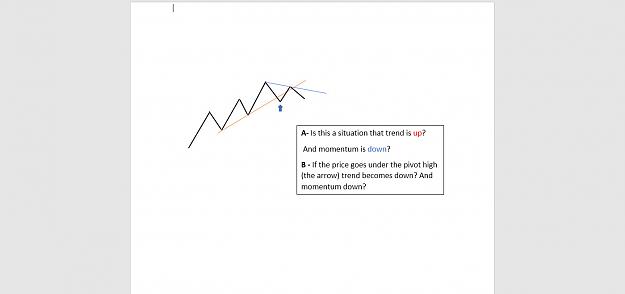
Thanks, dear Michael, I've drawn a pattern about trend and momentum, what do you think about it?
Trading Institutional Order Flow
- Royal146 replied Aug 23, 2019
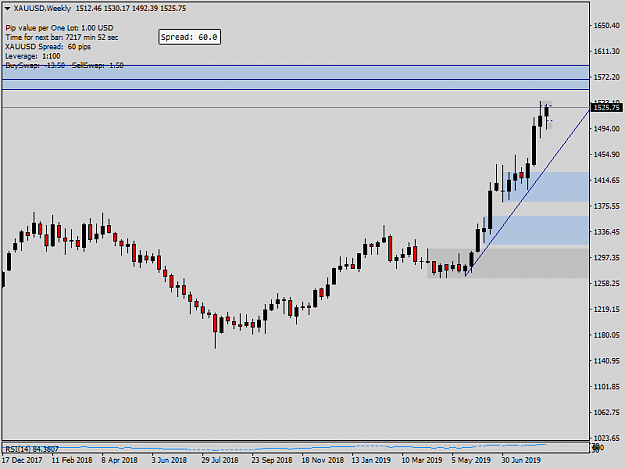
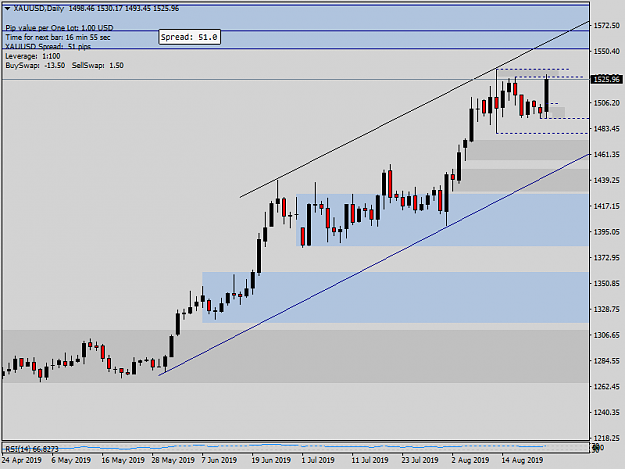
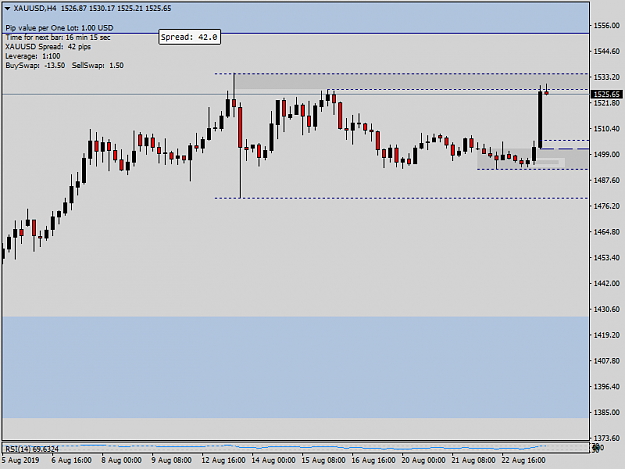
Hello guys and dear Akt! I'm new to this thread and glad I found it. really helpful. please give me your thoughts on Gold, my timeframe sequence is W-D-4H my analysis is, Weekly is up ( near fresh Supply) - Daily is kinda sideway but up! - H4 is ...
Trading Institutional Order Flow
- Posts by Member Search: 'Royal146'