- Search Forex Factory
- 26 Results (2 Threads , 24 Replies )
-
 Thruline replied Jul 29, 2021
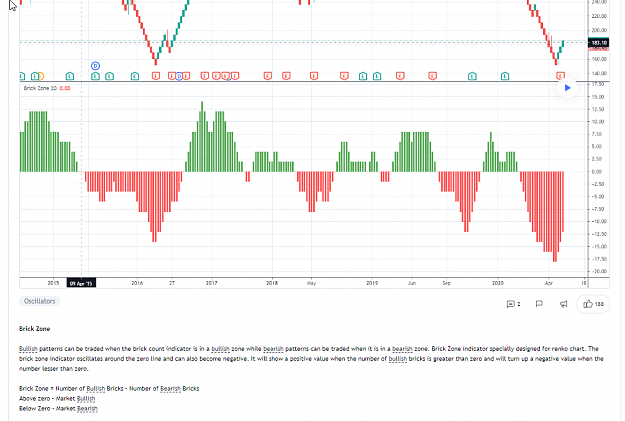
Hi all: I'm looking for a 'brick zone indicator'. It's an oscillator that is the difference between x number of bullish renko bricks and bearish bricks. The picture is from a version for trading view. It shows momentum changes pretty well. Anyone ...
I will code your EAs and Indicators for no charge
- Thruline replied Dec 9, 2015
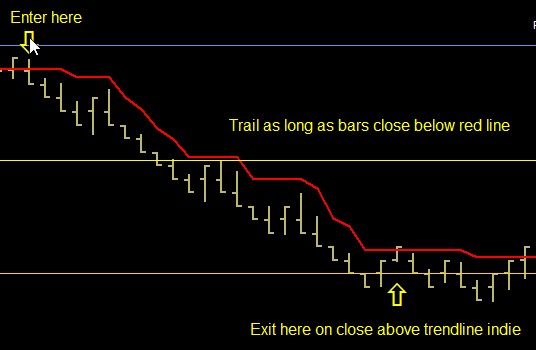
Can anyone point me to a trailing stop EA that will let you: 1) Take partial profits x number of pips into profit 2) Move stop to breakeven + x number of pips 3) Trail x number of pips from price on remaining lots 4) Exit once price has touched or ...
I will code your EAs and Indicators for no charge
- Thruline replied Oct 26, 2015
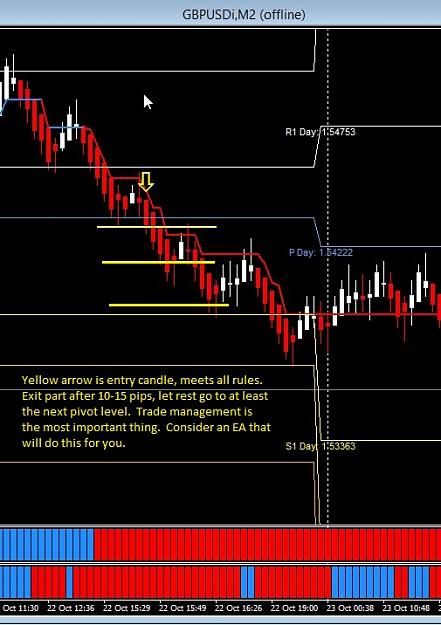
This screenshot shows a sell entry on 7 pip renko that meets all the rules. Patience is required. This method keeps you out of transitioning markets that might chop you but also misses some good moves as a result.
TPT - Trend pullback trading
- Thruline replied May 20, 2015
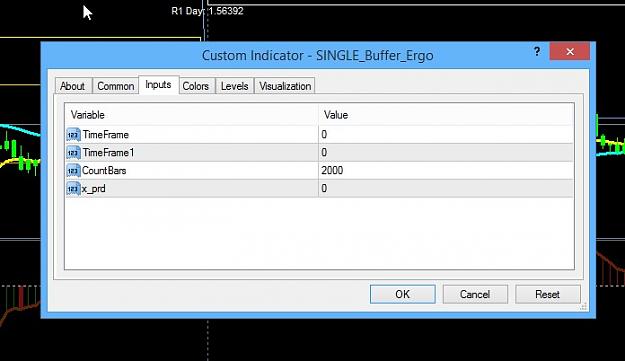
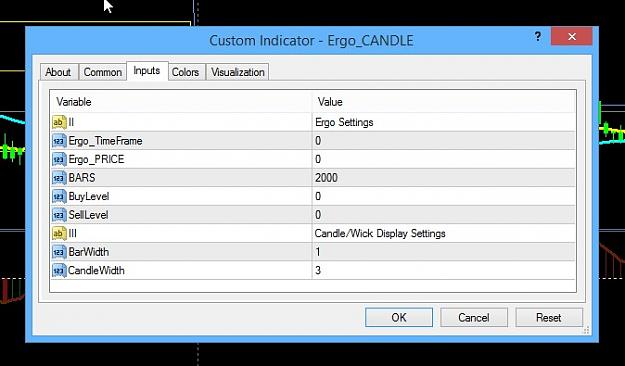
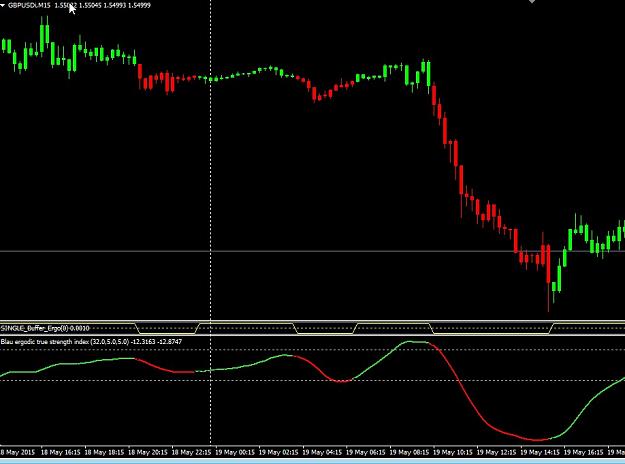
[quote=Richard Ong;8272443] Here ya go... build 765... I did notice when I tried to change ergodic and maybe other settings it was glitchy.
I will code your EAs and Indicators for no charge
- Thruline replied Feb 16, 2015
Nice job, Mr. Ma. I was also watching price action around pivots when it was choppy. Remember you can sometimes get a better entry by going in at the next lower time frame. When the market collapsed after, there were some great moves. Take a look at ...
TPT - Trend pullback trading
- Thruline replied Oct 1, 2014
EURJPY later during NY trading session. Two really clean 15m sell setups. The first one follows an ABC correction. When the fractal breaks after a visible ABC correction, it can be a big move. Wait for quality signals and search for them on various ...
TPT - Trend pullback trading
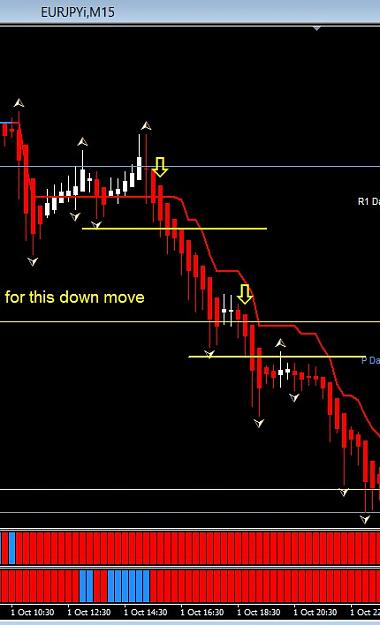
- Thruline replied Oct 1, 2014
Hey Pilot: Are you sure that's EurJpy? I have different price levels and action on my chart. But just looking at the set up, the problem with it is the market appears to have gone in to a trading range. JPY pairs can be ok during Asian market but ...
TPT - Trend pullback trading
- Thruline replied Sep 29, 2014
Hi Ni: The second arrow is the one where I entered a little bit early on a lower TF. See all the white bar shadows to the left? I'll go in on the shadows sometimes if there's a fractal on a lower TF (see charts below). The rules are to wait for a ...
TPT - Trend pullback trading
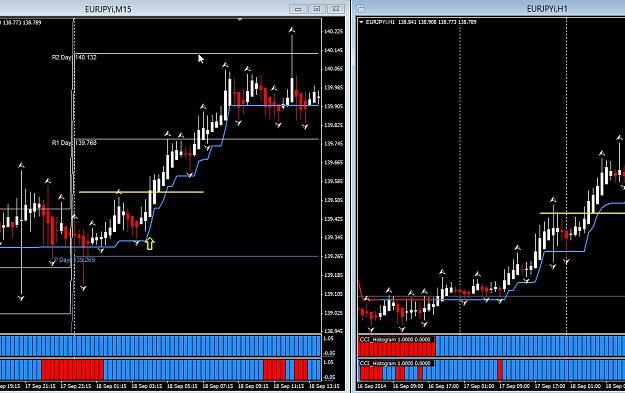
- Thruline replied Sep 19, 2014
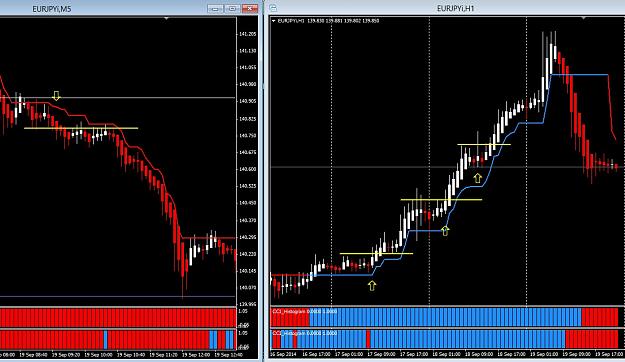
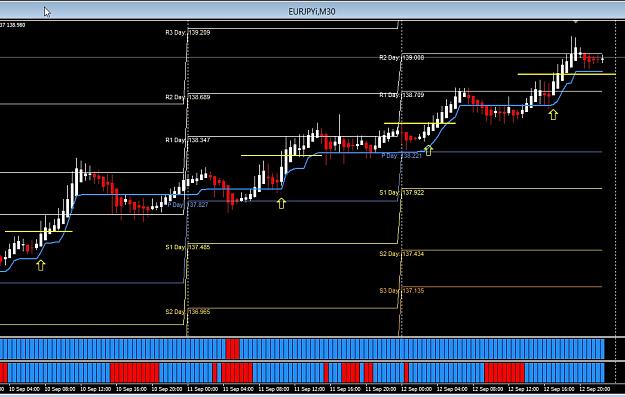
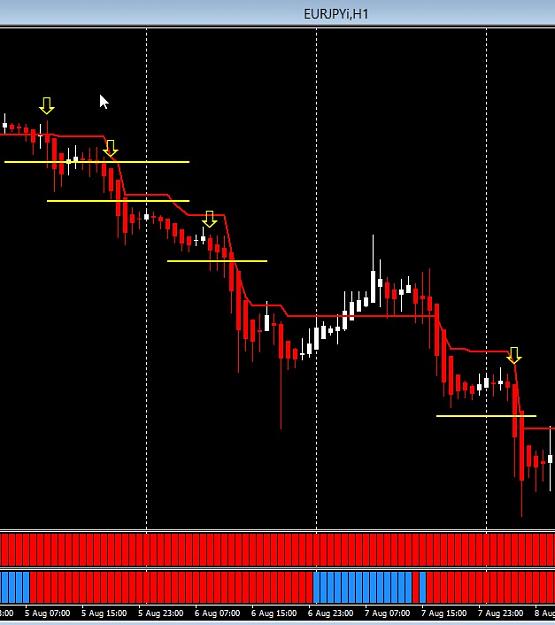
Hey Ned: The ideal TF is defined by the market action. I'll keep several TFs like 15m and 1hr and look for a clean signal based on the rules. The up move in the Euro Yen was big and looked good on an hourly. The down move reaction was best viewed on ...
TPT - Trend pullback trading
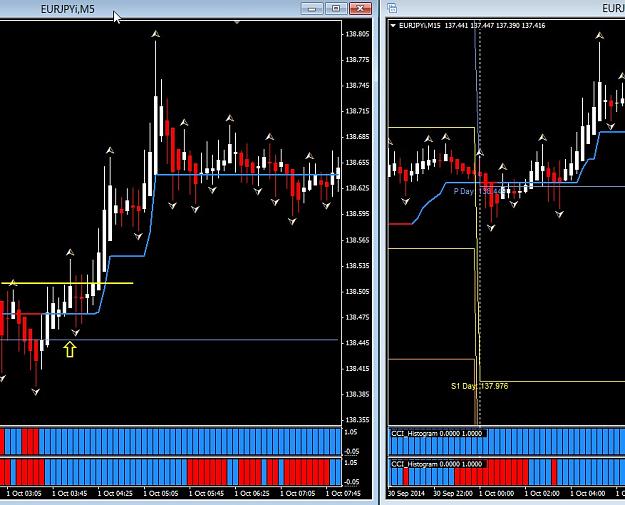
- Thruline replied Sep 15, 2014
Example of going to lower time frame to get valid entry and better price. I like that CCI 15 changes color. There's also a valid earlier entry on 5m chart at 9:50am (broker time) that I haven't talked about yet.
TPT - Trend pullback trading
- Thruline replied Sep 15, 2014
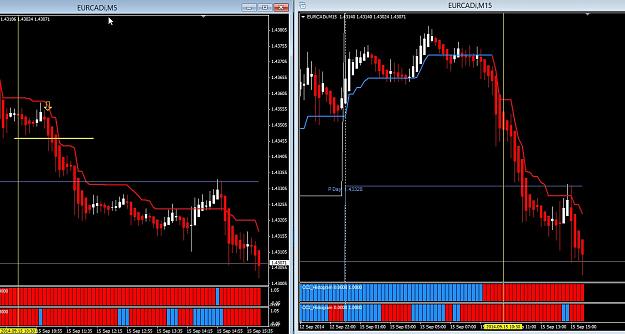
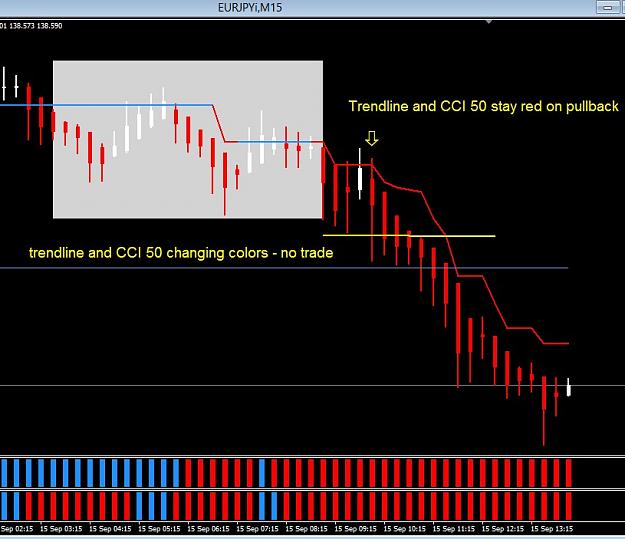
Example of ranging no-trade and valid trade today. image
TPT - Trend pullback trading
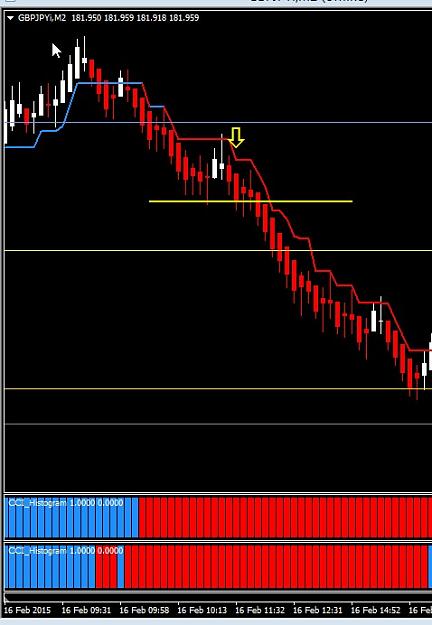
- Thruline replied Sep 14, 2014
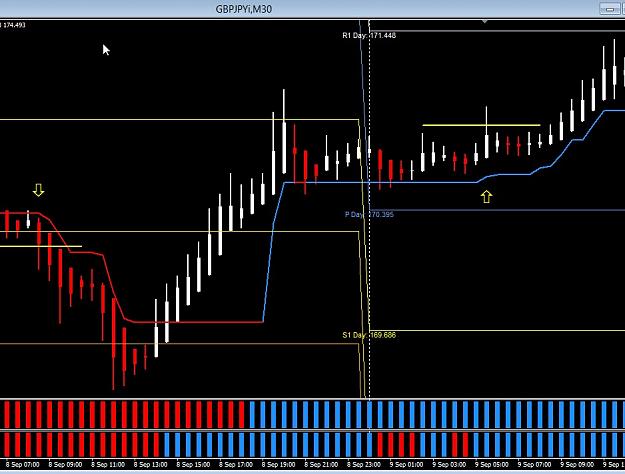
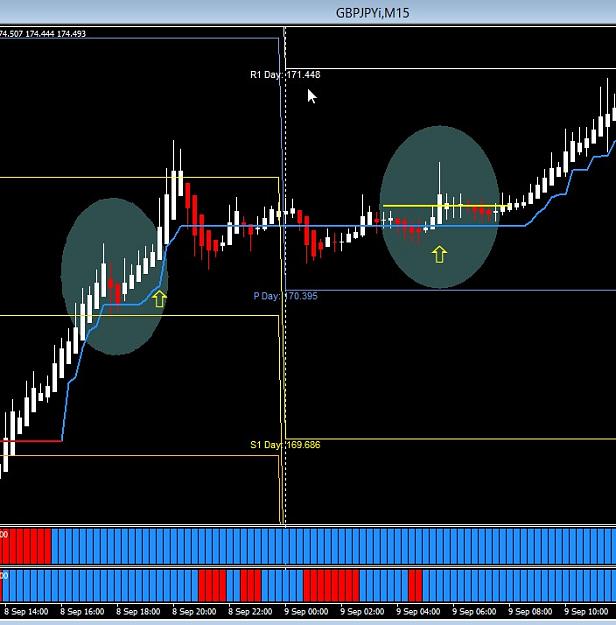
A sell and a buy on 30m GPBJPY. image The same buy on a 15m chart gives a better entry and shows another valid signal from the day before (ellipses). image
TPT - Trend pullback trading
- TPT - Trend pullback tradingStarted Sep 13, 2014|Trading Systems|49 replies

This is a profitable method if you follow the rules. Any time frame from 15mins up. Buy: 1) Blue ...
- Thruline replied Nov 11, 2013
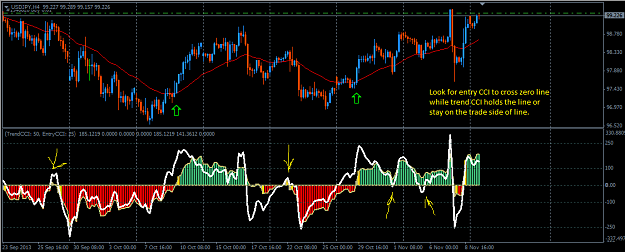
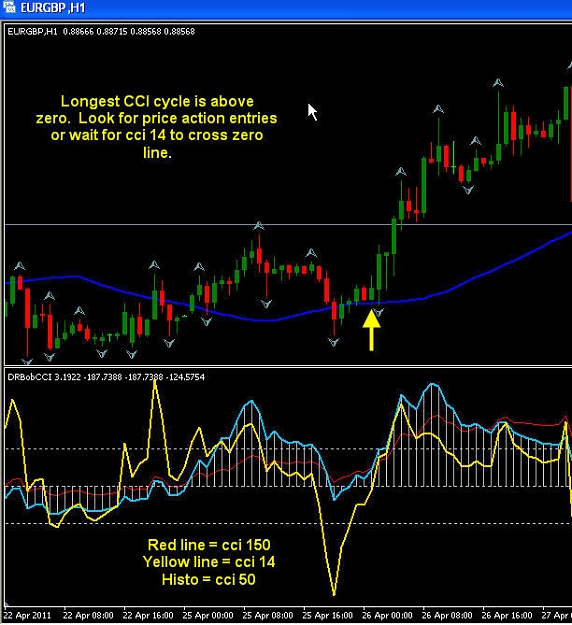
The best CCI setups IMHO are when the entry CCI pulls back beyond the zero line and there are four examples from Chamane's pic. The trend CCI must hold the zero line. Once the entry CCI breaks back on the trade side of the zero line, you're in. This ...
CCI 50 System
- Thruline replied Apr 30, 2011
I also look at pullbacks to the 'other side of zero'. For example, if the 150 is above zero, I'm looking for the 14 to pullback to zero or below, then enter on price action triggers (eg engulfing, hammers, reversal bars, trendline breaks).
4H CCI Strategy (Catch most of PIPs from Trend)
- Thruline replied Dec 25, 2008
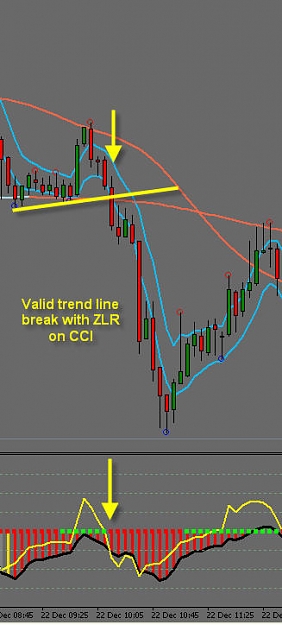
CCI ZLR with TLB — This is 5 minute chart where everything lines up. CCI settings are 34/14
Neurus Psar Demark System- 5 Min
- Thruline replied Sep 21, 2007
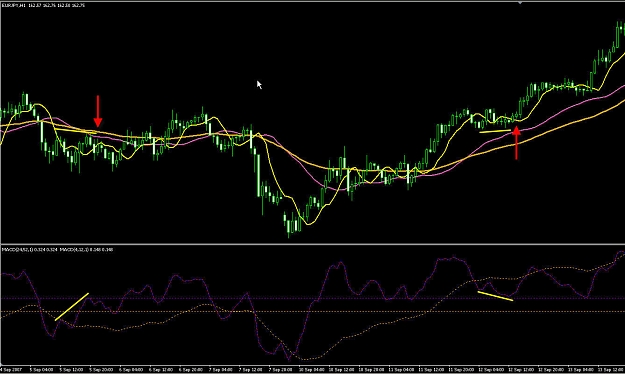
Here's the template and a more recent chart. The sell is an example of a trade that doesn't work out. There was still plenty of time to make some pips there depending on your entry/exit strategy.
Dual MACD Method
- Dual MACD MethodStarted Sep 20, 2007|Trading Systems|11 replies
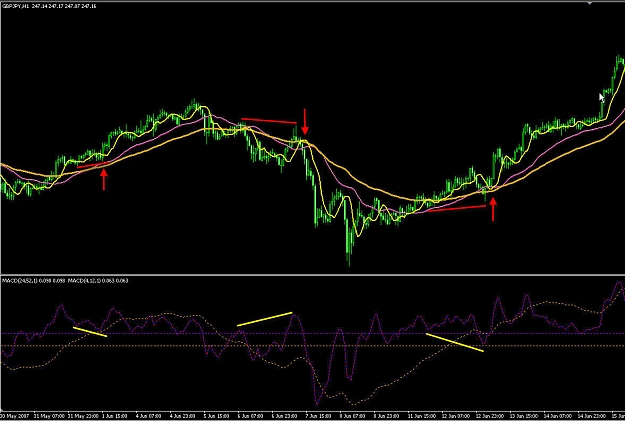
Thanks to everyone who's inspired, shared knowledge. Here's a method that works pretty well. I ...
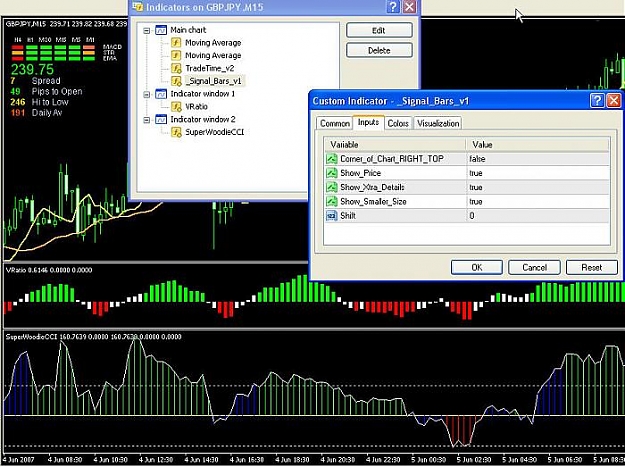
- Thruline replied Jun 10, 2007
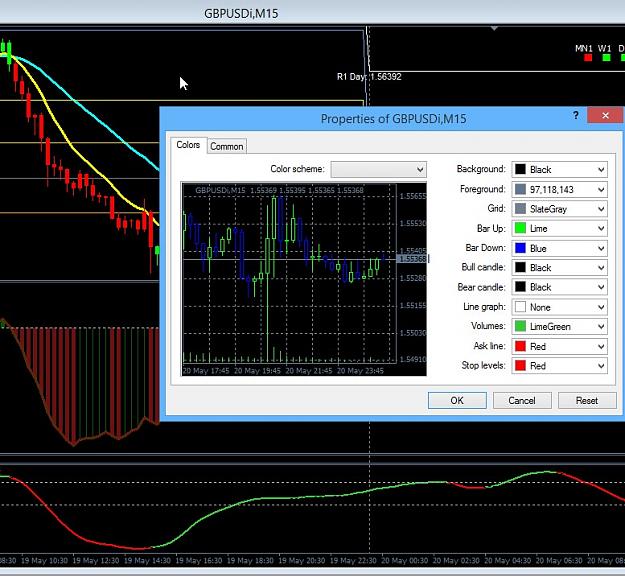
See pic. Right click on chart background, left click on 'indicator list'... then you can edit.
Fib Retracement