- Search Forex Factory
- 85 Results
-
 Thtpro replied 8 hr ago
HI Great questions The analogy was a generalised comment, however, I am happy to answer in greater detail If you apply the "Gold Ball" to your set-up, then you might have multiple set-ups and you could (i do) apply the gold ball to each set-up - ...
My Biggest Problem
- Thtpro replied 10 hr ago
Just to add to the SP500 comments and put in my 2 pence worth My composite cycle Index of the SP500 is at this position seen below - trade what you see NOT what you think/expect - but just be aware we have a lot of cycles that the SP500 works to, ...
Trading Made Simple(r)
- Thtpro replied 33 hr ago
Yep absolutely - That's why Gann created all those squares of....... using Fib ratios as the fan will work too as the markets are working through all the building blocks to their final destination Price and Time do some weird things - If you take ...
New Cable Thread & Other Pairs
- Thtpro replied 34 hr ago
Fibonacci is a geometric growth/decay system, depends what you want out of your analysis, but the other geometric growth/decay systems are the square, cube, 2 adjacent squares etc which make up platonic solids and is why you can find the maths of ...
New Cable Thread & Other Pairs

- Thtpro replied May 9, 2024
I would be very very wary of anyone claiming to be a guru and I would never ever pay anyone - the other problem you have especially on these forums, is the pretenders, who need to massage their ego's We all know that we make money by being right on ...
My Biggest Problem
- Thtpro replied May 7, 2024
I've used Indicators to trade since 2008 I would read Robert Miners Book High Prob trading strats - It is Elliott Wave, but, there's a bigger picture if you sit and think about it, there he tells you how to use Indicators at reversal points - you ...
How to properly use indicators

- Thtpro replied May 2, 2024
Here's a practical use of Jenkins Remember markets are DYNAMIC and not static, which means that they [price action] is twisting and turning on higher dimensions than we are able to see - this is WHY nothing works all the time, as it spins in and out ...
Michael S. Jenkins teachings
- Thtpro replied Apr 30, 2024
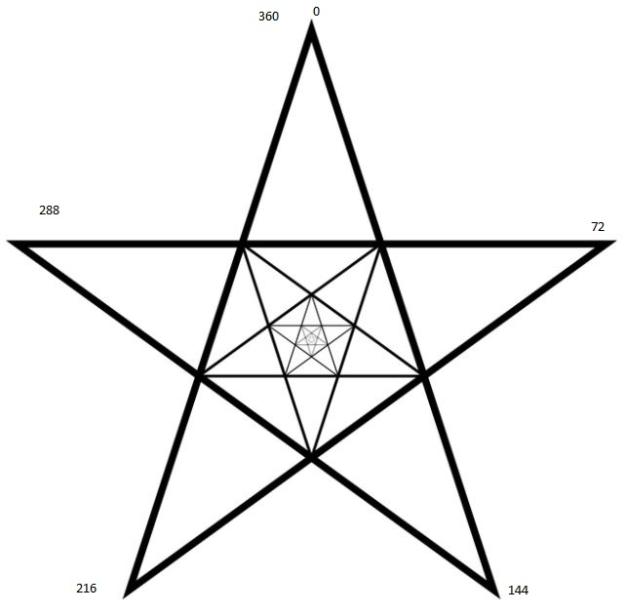
Then when you harmonically drill down the 72 degrees, a harmonic is 18 degrees and the following can be seen (note I took this screen shot in 2018, hence why not up to date price action wise) image You will be stretched to find this harmonic ...
Michael S. Jenkins teachings
- Thtpro replied Apr 30, 2024
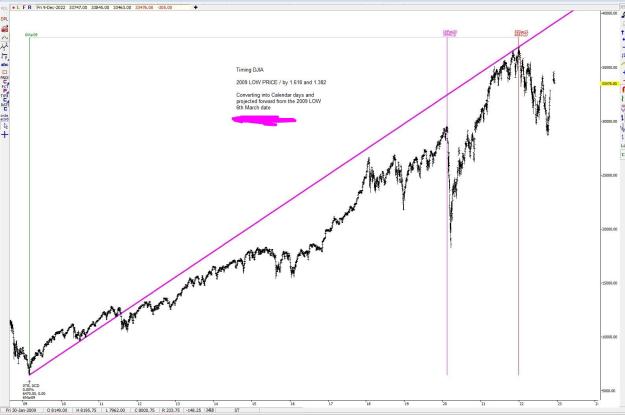
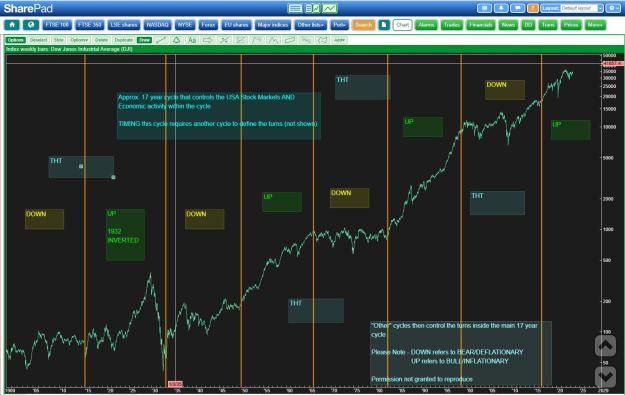
From the DJIA data look for this cycle - This is the CYCLE - notice the repetition UP/DOWN....... From there, you can mark the BIG LOWS 1942,1974 & 2009 and note the timing between - If you are still alive when the next one occurs = BEST time to buy ...
Michael S. Jenkins teachings
- Thtpro replied Apr 30, 2024
This is from TODAY Another multiple R profit trade Daily was in a position for the p[ast few days for a "pop" higher based on everything discussed image Then it wasn't until TODAY that the 15 min chart got its act together and formed a tradable ...
Indicator to identify tops and bottoms?
- Thtpro replied Apr 30, 2024
Don't try to understand why - it will drive you insane! There's not always a reason - the market is definitely working out to geometric %'s, but trying to piece it all together all the time is Impossible At times you can, but 95% of the time you ...
Michael S. Jenkins teachings
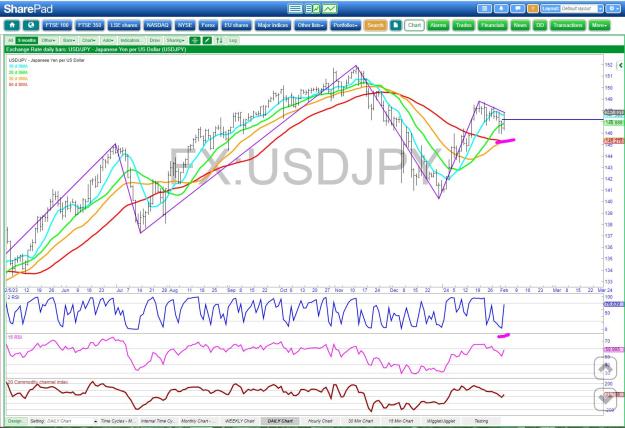
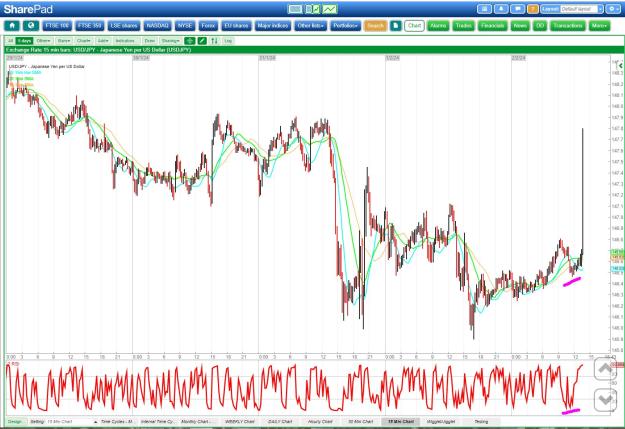
- Thtpro replied Apr 29, 2024
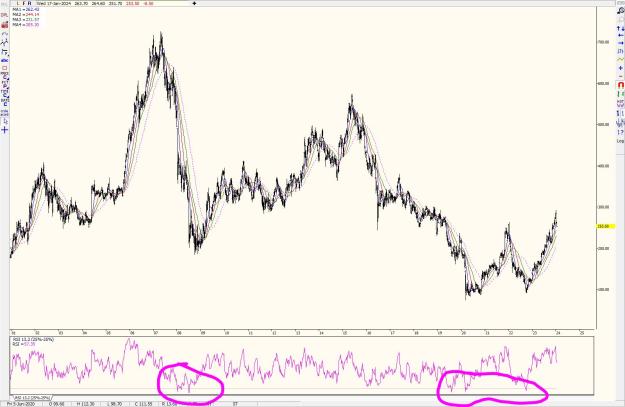
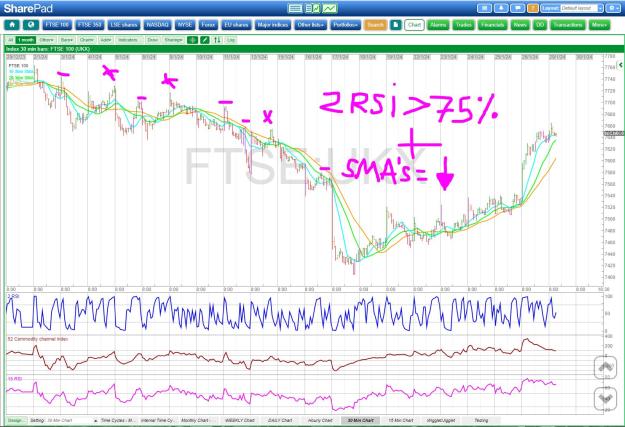
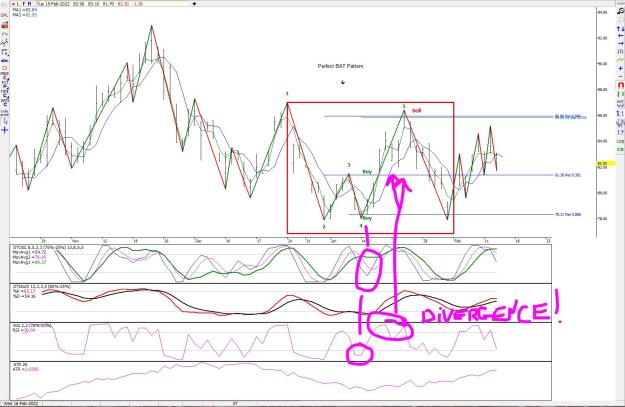
This is what I meant about dual time-frames DAILY - This chart shows the explosion bar, the PRIOR bar, was 2RSI <25% = get ready for a possible up move reversal of some degree image Intra-day - Look for set-up and get in if possible image Your ...
Indicator to identify tops and bottoms?
- Thtpro replied Apr 27, 2024
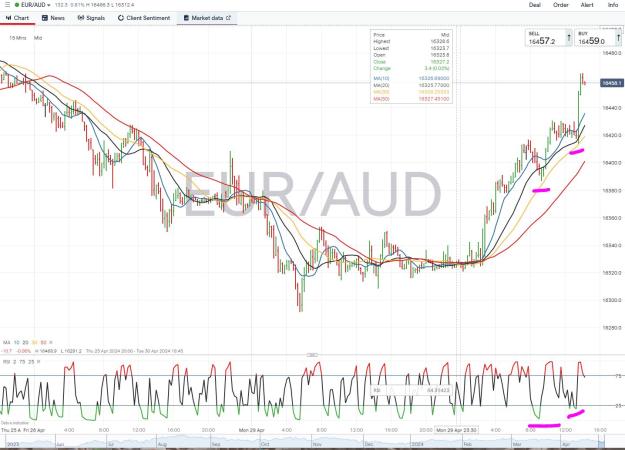
You can alter the settings of any indicator to use it to move with the markets price cycles - some of these price cycles will be poor, but some of them will be brilliant - I've used this method for years to amazing success The key is to use it in ...
Indicator to identify tops and bottoms?
- Thtpro replied Apr 26, 2024
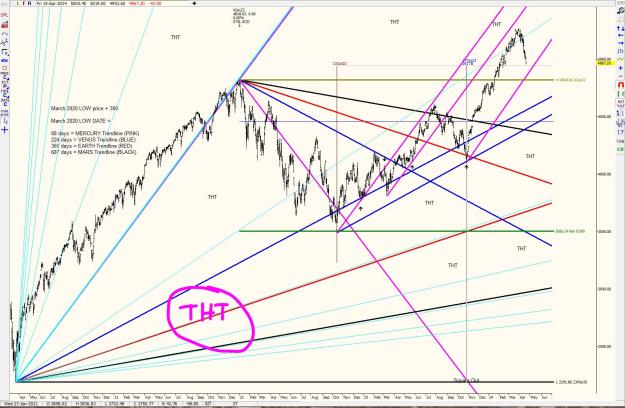
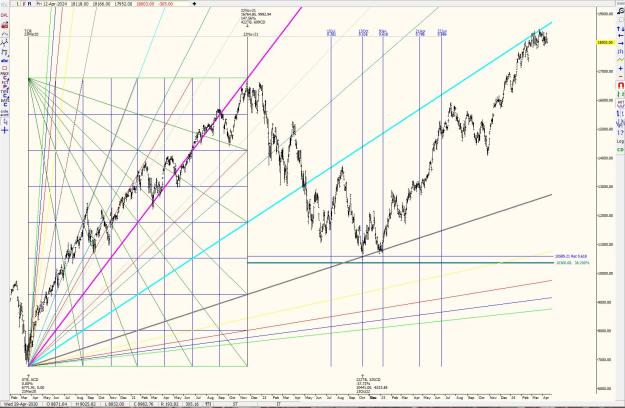
I'll shove this here - its Gann/Jenkins esq sort of Nasdaq100 from 2020 rally See how everything fits together? Draw the Gann Box around price action / Draw Gann Angles using the 1 x 1 as the diagonal of the box / run retracements AND also GEOMETRIC ...
Michael S. Jenkins teachings
- Thtpro replied Apr 26, 2024
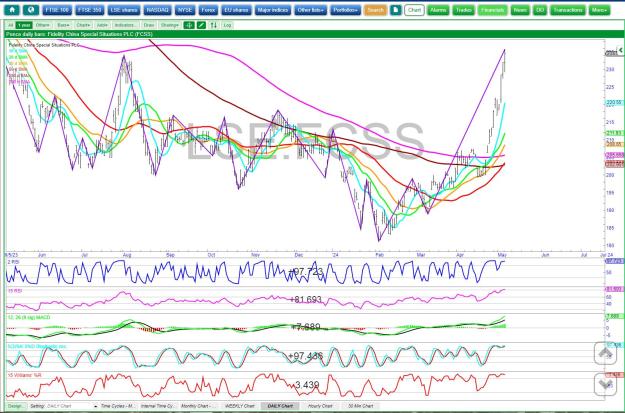
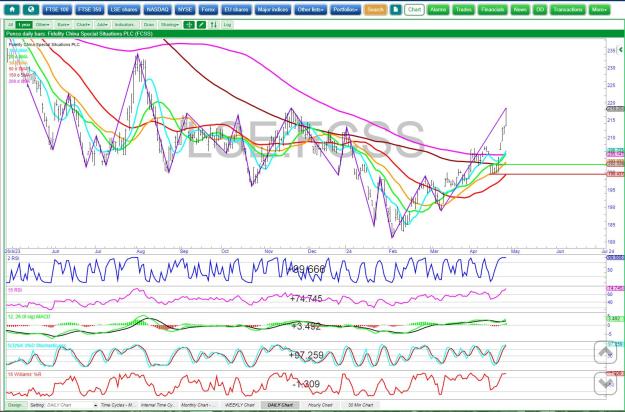
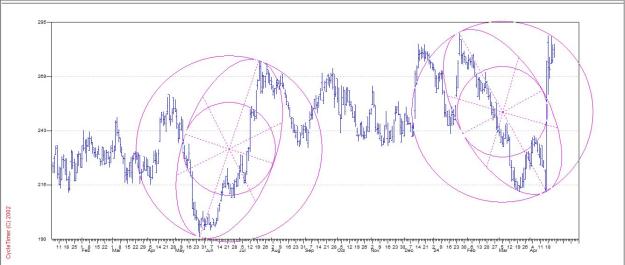
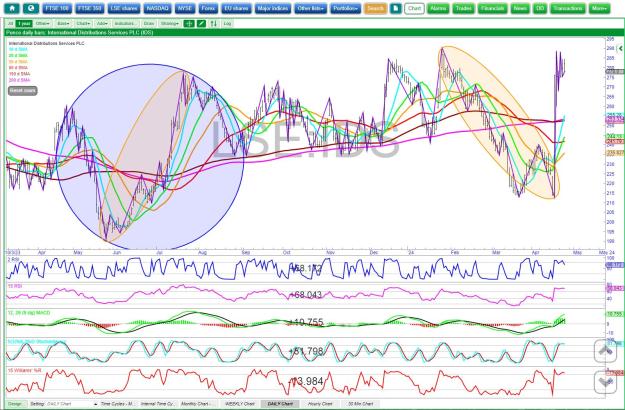
Fingers crossed I've never got on that well with Ellipses for trading The chart below is the same market as above LSE:IDS - I just used DT software to analyse the timing What I did was took the LOW 191.2, doubled it and ran TIMING out by the same ...
Michael S. Jenkins teachings
- Thtpro replied Apr 25, 2024
I have no idea on building the Ellipse's - I'm far from an Engineer - although my 2 sons would know I've drawn the same Ellipse on Cowans software the same as above and note there's differences - I would trust Cowans software here more than the ...
Michael S. Jenkins teachings
- Thtpro replied Apr 25, 2024
The S is an ellipse - hard to find then all the time, but occasionally they show up We are forced to look at price action on a 2 dimensional screen - price action is moving in 4 dimensions, hence all the distortions and missed timing etc - price ...
Michael S. Jenkins teachings
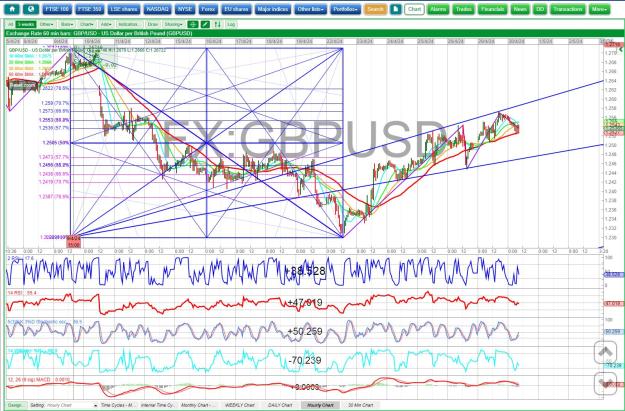
- Thtpro replied Apr 23, 2024
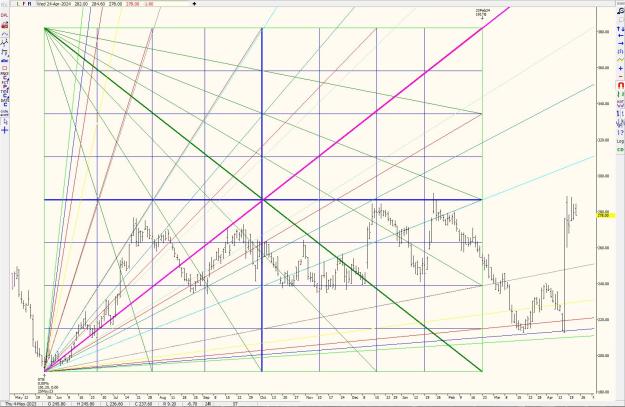
Bounce off the 70.7% retracement level (SQUARE) and off the 75% Gann Box 75% angle image
Michael S. Jenkins teachings

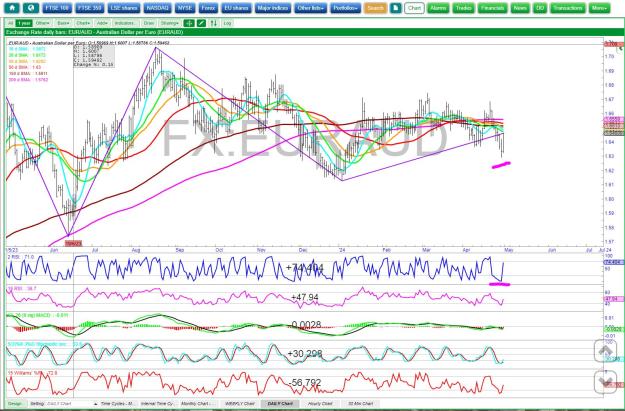
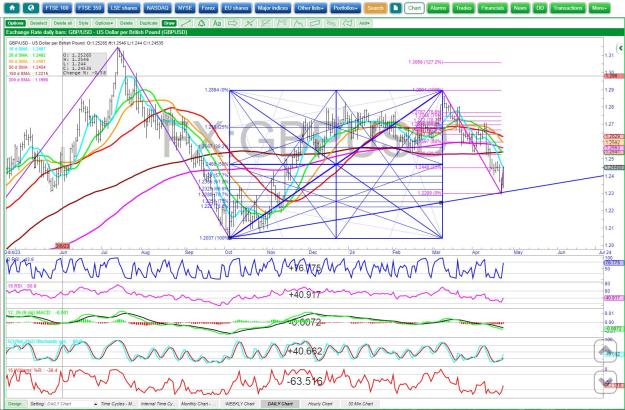
- Thtpro replied Apr 23, 2024
I traded it using moving averages, retracement and Indicator - completely non Gann or Jenkins - The DAILY chart turned up at the 70.7% Retracement level (related to the SQUARES ratios) + an extended Gann Box angle from the 75% level of the box ...
Gann Analysis
- Thtpro replied Apr 17, 2024
This is one way I use Jenkins and Gann - Very simple image Then apply a little Jenkins (not everything is shown on the chart) image Notice the EXTENDED Gann Box angles - 66.6% retracement levels called the top #2 AND correction from #2 = CUBE ...
Michael S. Jenkins teachings