- Search Forex Factory
- 65 Results
-
 Whistlepips replied Jun 26, 2013
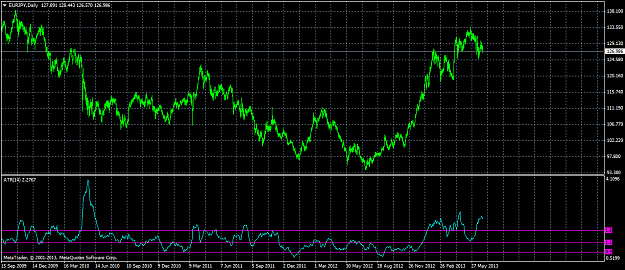
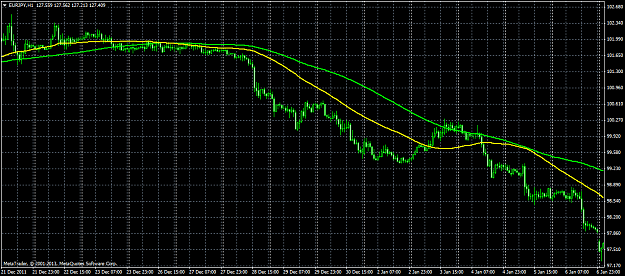
Hmm. ATR14 =1.3 on EJ D1 chart is a good level to divide statistics. Values over it will probably produce larger intraday swings and those under it will produce smaller swings. Looks like on EJD1 other good levels to divide statistics are 1.8 and ...
Drill yourself quickly into pairs you prefer: Zig zag statistics
- Whistlepips replied Jun 26, 2013
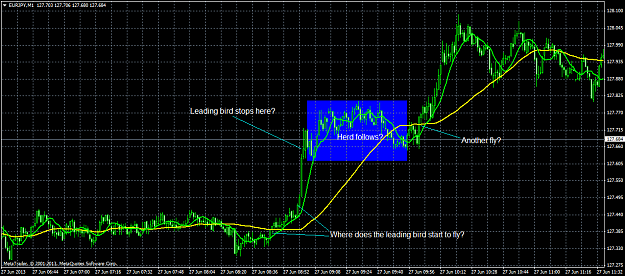
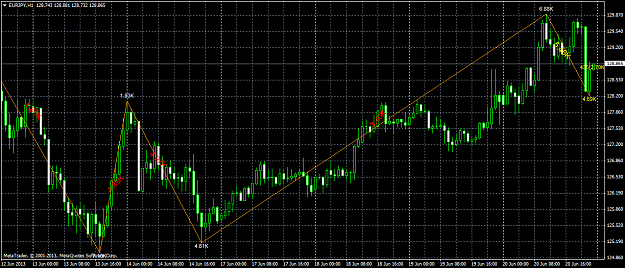
The starting point of this phenomenon can be identified and is pretty much the same every time and on every timeframe. It begins near moving averages. Trend => consolidation => trend........
Extracted Thread (per thread starter's request)
- Whistlepips replied Jun 20, 2013
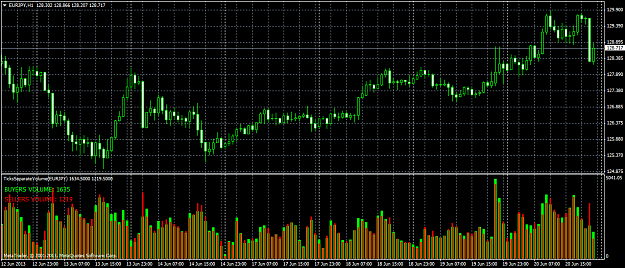
There is volume combined on zig zag swings on this one, but it shows the average volume on swings, not cumulative.
Drill yourself quickly into pairs you prefer: Zig zag statistics
- Whistlepips replied Jun 20, 2013
This one seems to separate buyers & sellers vol. It may be beneficial to also separate buyers & sellers in swing volumes.
Drill yourself quickly into pairs you prefer: Zig zag statistics
- Whistlepips replied Jun 20, 2013
Phew....
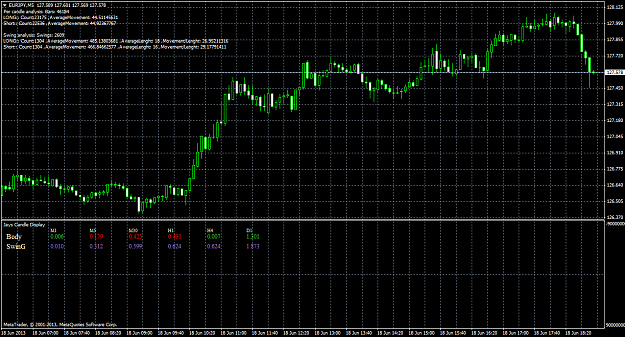
Drill yourself quickly into pairs you prefer: Zig zag statistics I made extensive searches on the net and it seems that there isnt many statistics indicators around. At least not publicly available. So there is definitely a need to develop ones. This one I found earlier. It seems to be based on some ...
- Whistlepips replied Jun 18, 2013
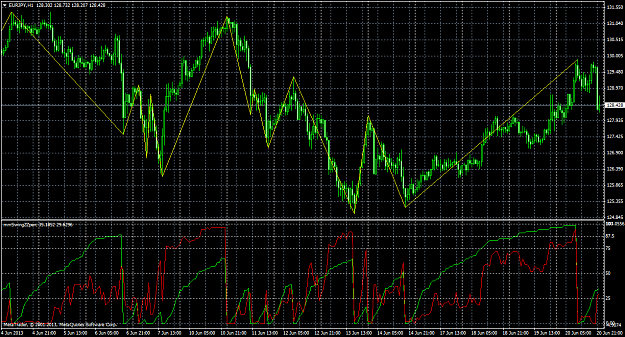
It seems that the info Im after can be collected from bits and pieces. Here´s couple indis, that show something. If only there could be a way to combine these into a single one. Its crap not to be able to code.......
Drill yourself quickly into pairs you prefer: Zig zag statistics Both the candle indi ...
- Whistlepips replied Jun 17, 2013
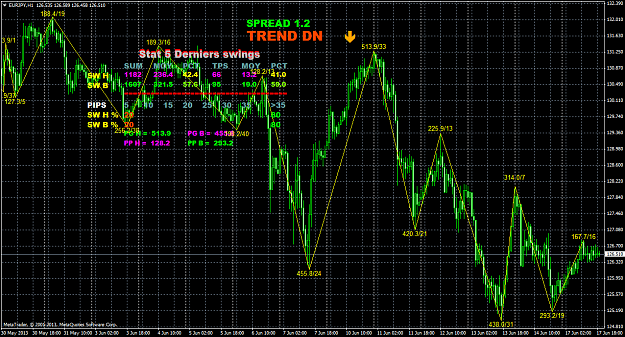
This one comes close to what Im looking for. Doesnt have all features from the first post, but looks interesting. Looks like I have to study this one a little more. Maybe those features could be added to this one?
Drill yourself quickly into pairs you prefer: Zig zag statistics
- Whistlepips replied Jun 16, 2013
Here is something that I found. It uses zig zag and has some similarities with the ideas I presented in the previous post. However, it does not collect statistics and not having much options for the analysis.
Drill yourself quickly into pairs you prefer: Zig zag statistics
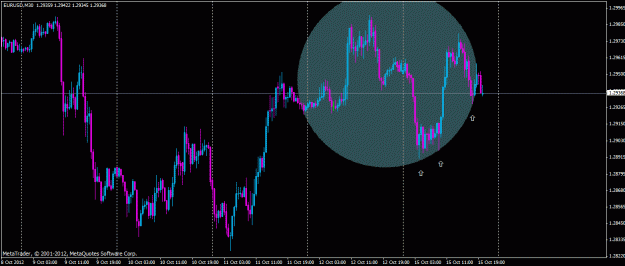
- Whistlepips replied Oct 15, 2012
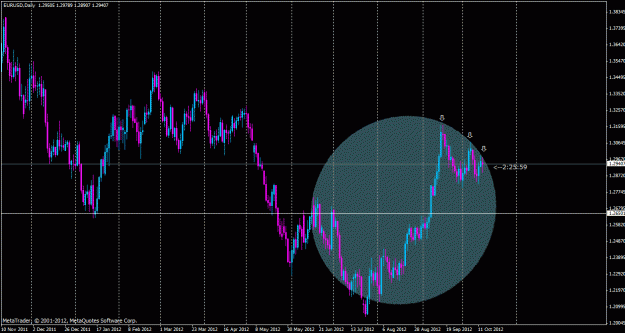
This is one scenario on D1. If it goes with it, will drop hard. Not yet any confirmation on the smaller timeframes H4, H1.... This goes with my yesterdays idea of weekly not finding a bottom yet.
Trading EURUSD only
- Whistlepips replied Oct 14, 2012
Some considerations..... - W1 hasnt found a meaningful bottom yet? (no reversal candle, last week was a hammer, but not on a level!) - D1 hasnt found a top? (no reversal candle) If these are correct, then D1 has to go up and then down in order for ...
Trading EURUSD only
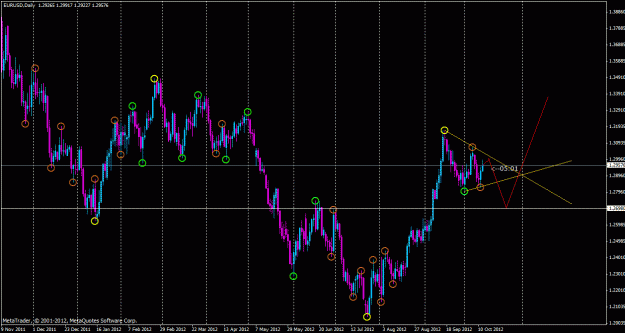
- Whistlepips replied Oct 13, 2012
This may be supporting the idea of a (small?) pullback down. Looks like it has rejected the exponential growth path. At least for a while. Edit: Well the week ended....
Trading EURUSD only
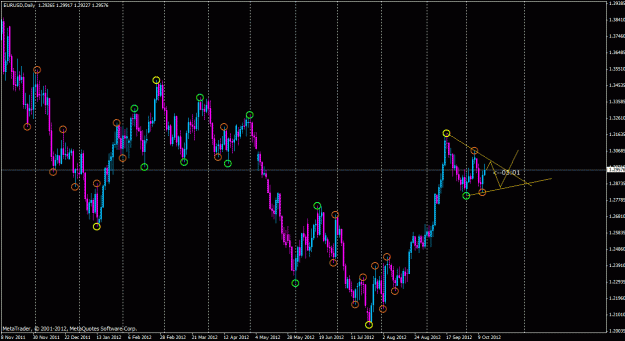
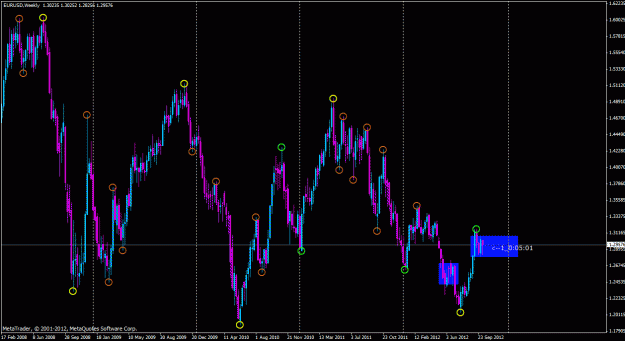
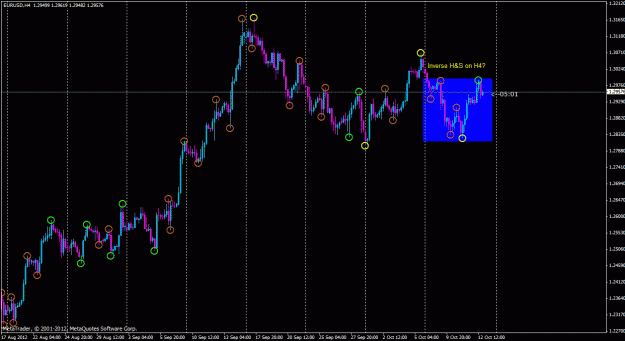
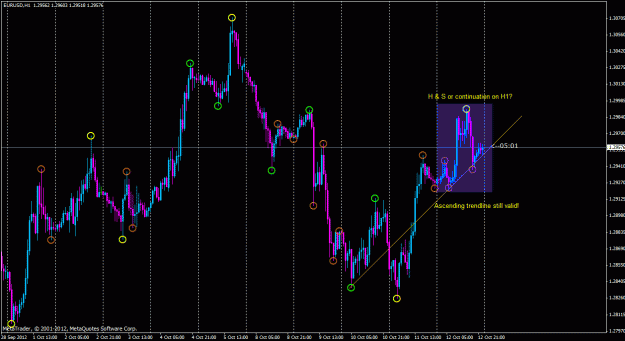
- Whistlepips replied Oct 13, 2012
Couple of pics to illustrate my previous points. Weekly looks like a ranger? D1 bull flaggish? H4 inverse head & shoulders H1 head & shoulders, but ascending trendline still valid.
Trading EURUSD only
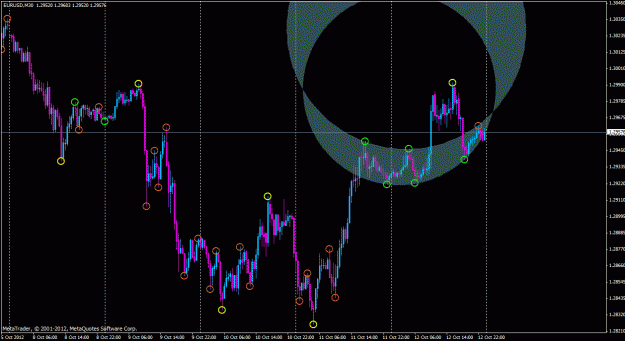
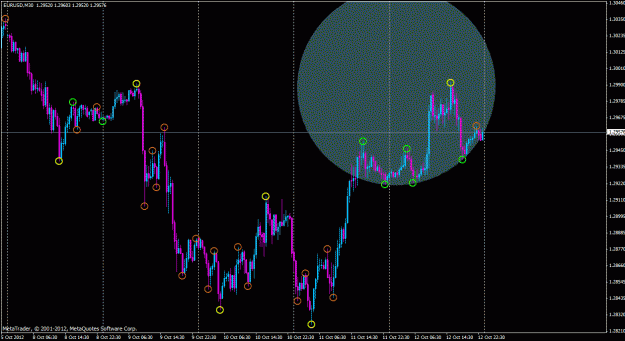
- Whistlepips replied Oct 2, 2012
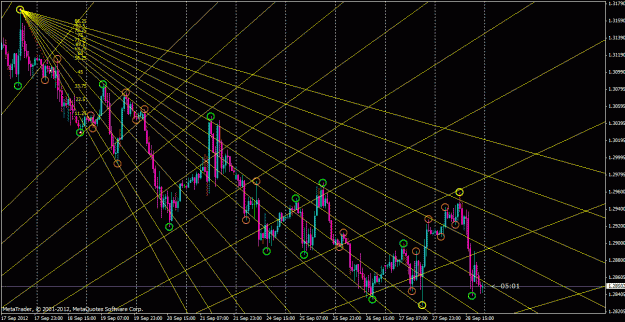
GM. Im kinda expecting it to range today as D1 looks a bit mixed up as in the rectangle marked areas in the pic, but there is pretty much room to range. Edit: Maybe the bigger moves later in the week with the news?
EURUSD
- Whistlepips replied Oct 1, 2012
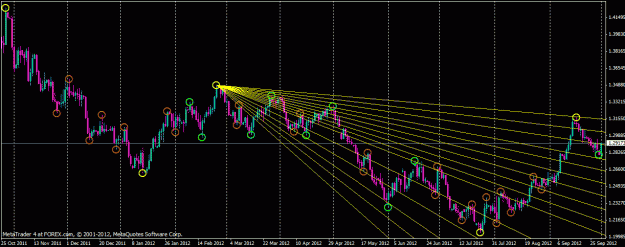
These fans on M5 I put in yesterday night based on the original gann angles discussed here on weekend. The other one is the daily chart. They seem to give pretty good view and I may have found something that stays in my charts. At the moment I dont ...
EURUSD
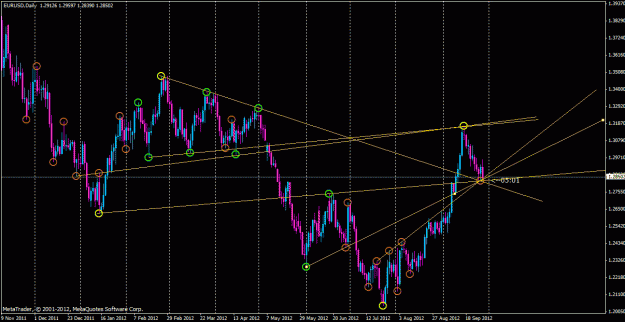
- Whistlepips replied Sep 29, 2012
Ha
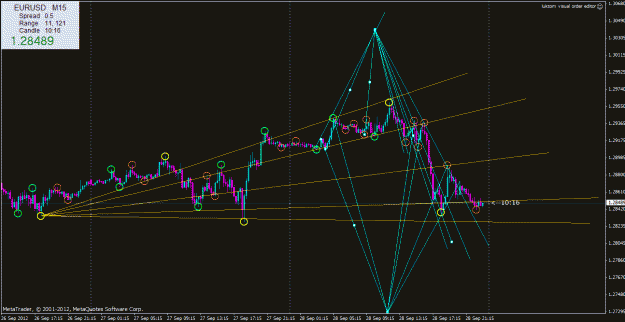
EURUSD (to me!). This one with a couple of Gann fans from different directions. Used fib fan function on the MT basic features with original gann angles. Maybe I dont need to handdraw them anymo'. 11.25 22.5 33.75 45 56.25 60 63.75 67.5 71.25 ...
- Whistlepips replied Sep 29, 2012
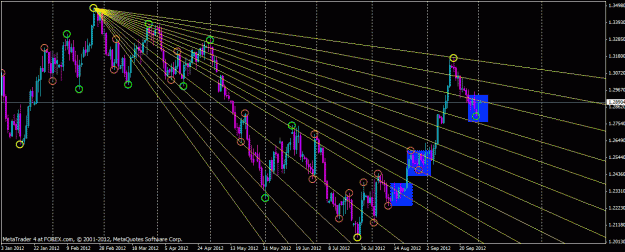
Pure coincidence? I dont know...... But I have a hunch. As I look the daily, it may go geometric, when something is about to happen....the patterns you know....
EURUSD
- Whistlepips replied Sep 28, 2012
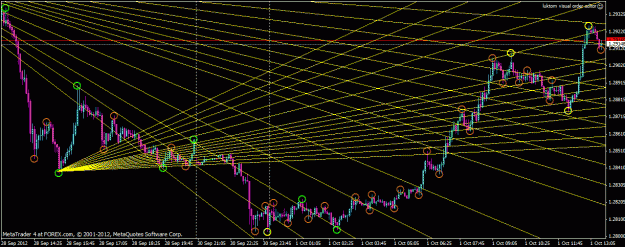
Market symmetry....and time....I think Im getting somewhere with this.....
EURUSD