- Search Forex Factory
- 88 Results
-
 cliffjaded replied Mar 6, 2024
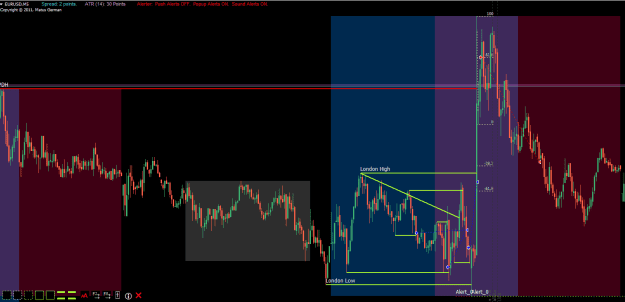
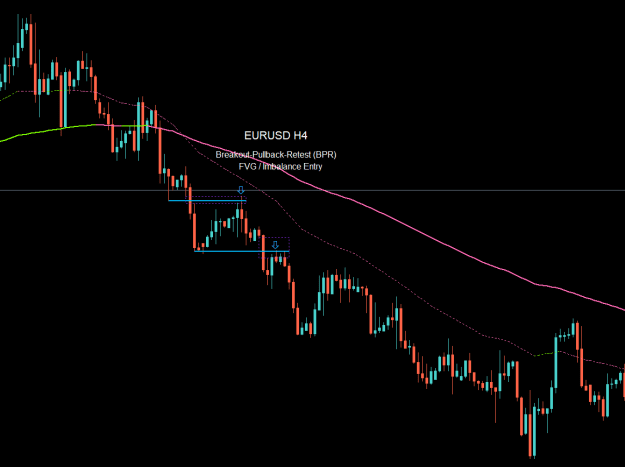
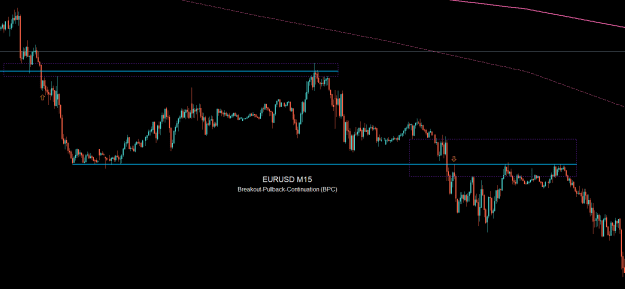
Back again now testing a M5 averaging strategy. Apologies since this isn't M1 and EMA based though you can certainly incorporate M1 price action and EMA-based targeting. Rules: Draw key levels Session Levels PDH / PDL Significant Swing High / Low ...
M1 Countertrend Scalping Strategy

- cliffjaded replied Sep 25, 2023
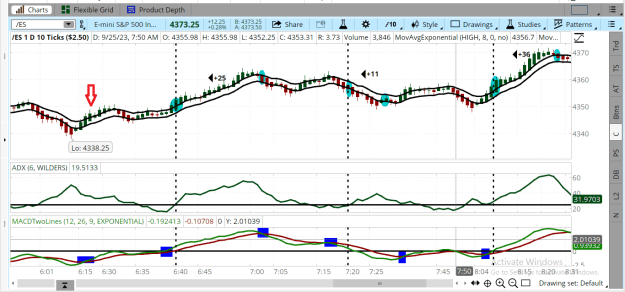
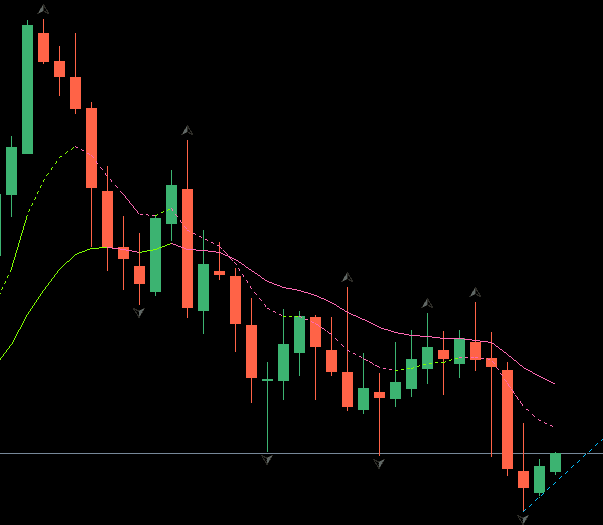
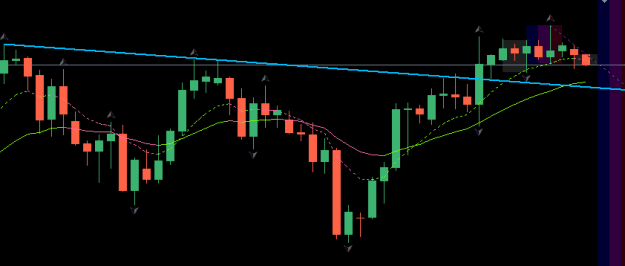
Hi Rocky, out of curiousity to understand your system and thought processes better, why didn't you take the trade highlighted by the red arrow? MACD has crossed, ADX above 30 and green candle has printed above the MA bands. image
rocky reboot: revisiting rockypoint's renko HA with ema method
- cliffjaded replied Sep 1, 2023
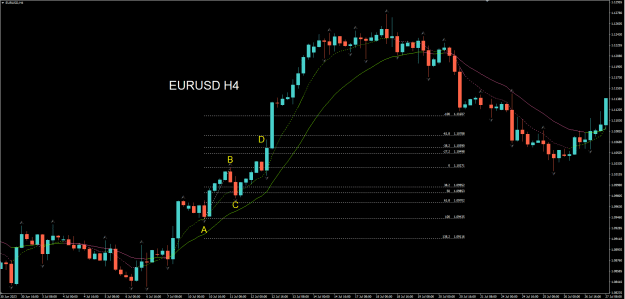
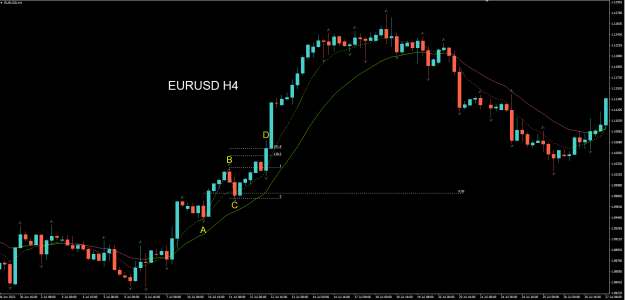
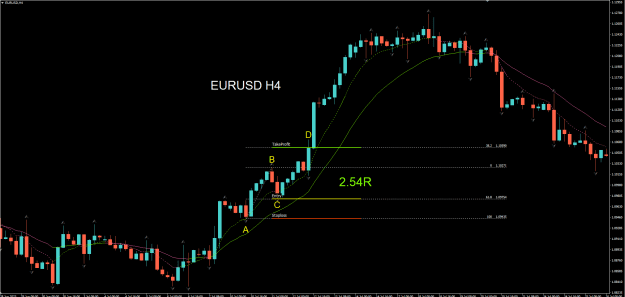
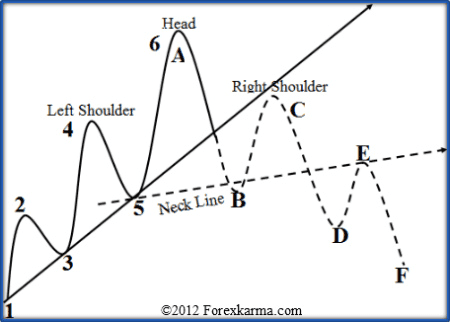
There's 2 ways of calculating fib projections and they depend on how you draw the fib. Method 1 - Measuring the Impulse Wave The standard way would be to draw the fib from the start of the impulse wave at point A at 100% to point B at 0%. Point C ...
MA Crossover System that works for me
- cliffjaded replied Aug 29, 2023
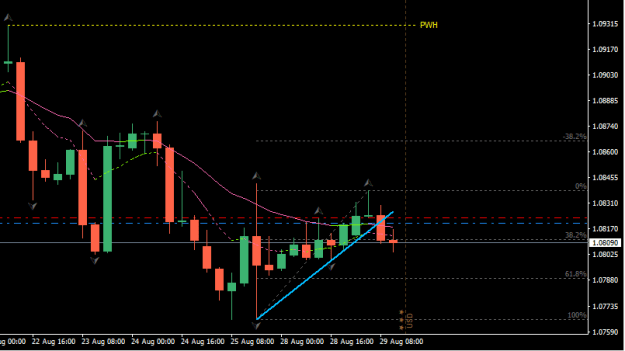
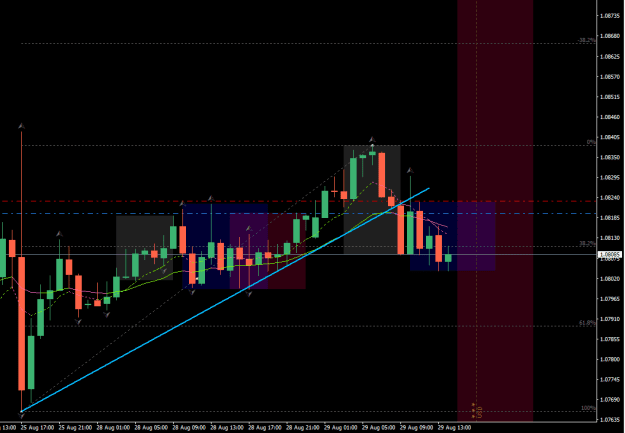
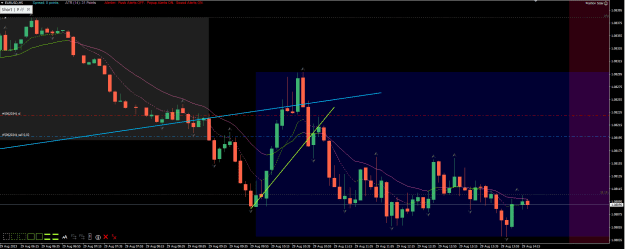
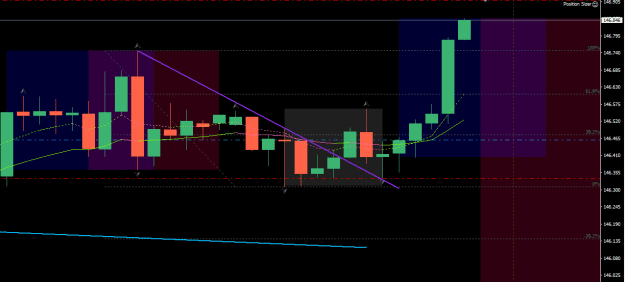
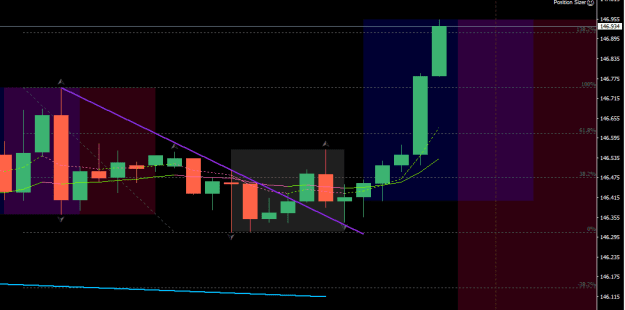
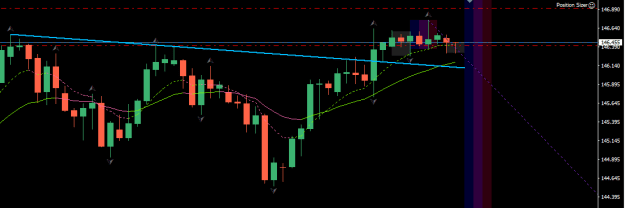
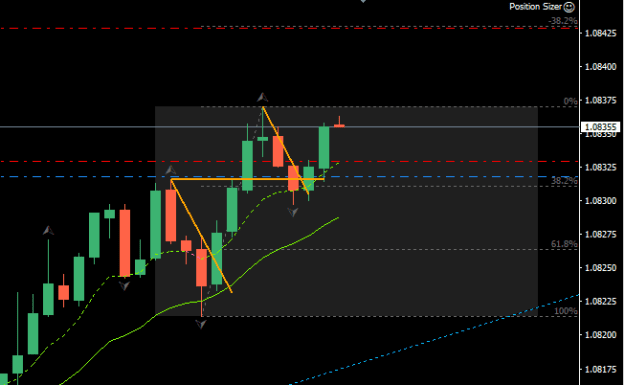
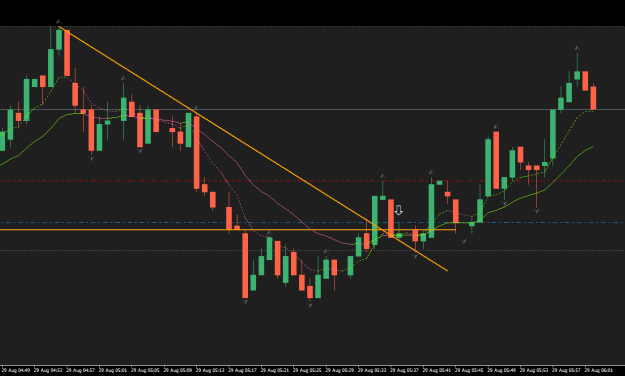
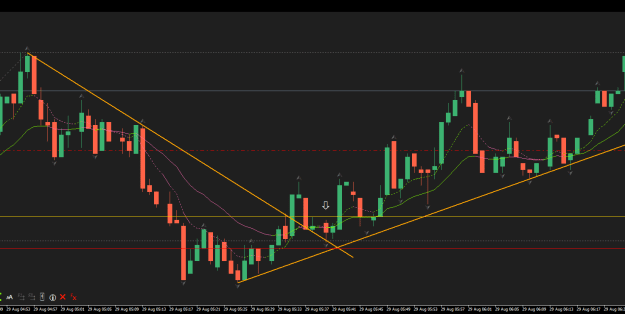
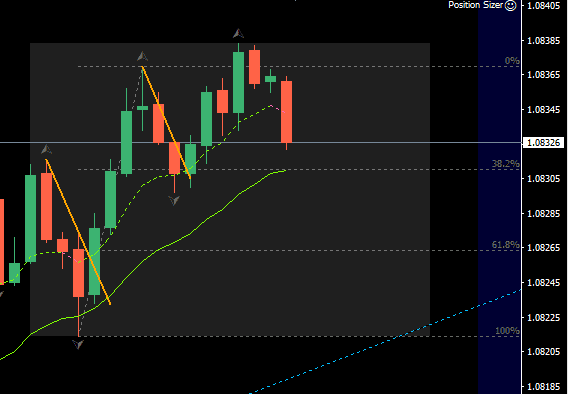
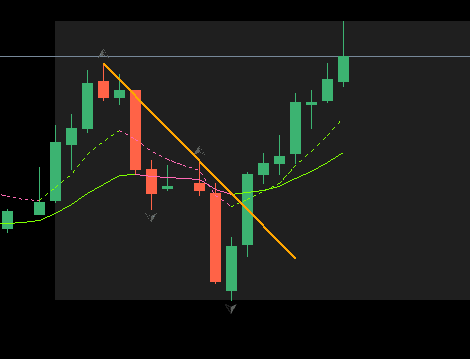
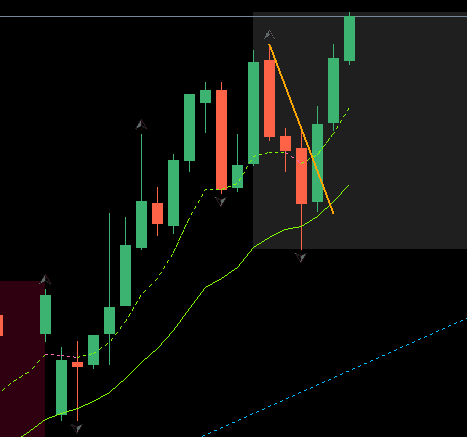
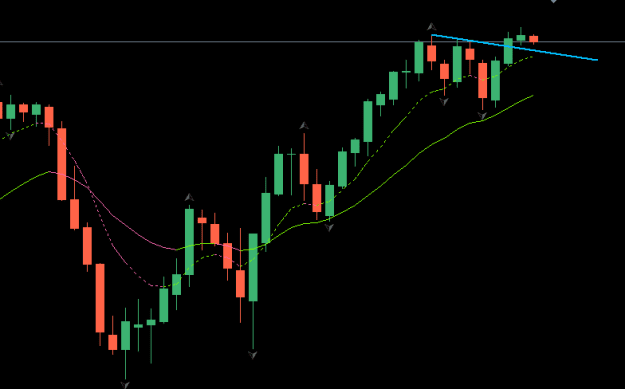
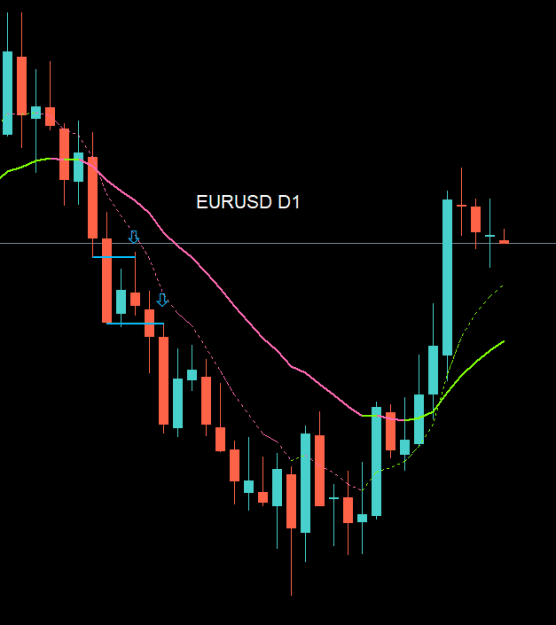
This one is ambitious. EURUSD D1/H4 Setup D1 image H4 image I waited for the break of the D1/H4 trendline. Then i waited for price to retrace to the back of that trendline on H1. H1 image I further drilled down to M5 and drew another trendline ...
MA Crossover System that works for me
- cliffjaded replied Aug 29, 2023
USDJPY H4 Setup image Entry on H1 image Approaching TP of 138.2%. Edit: TP reached. And before incoming news too. image
MA Crossover System that works for me
- cliffjaded replied Aug 29, 2023
USDJPY H4 Setup image Entry on M15 image
MA Crossover System that works for me
- cliffjaded replied Aug 28, 2023
EURUSD M15 pullback to EMAs and trendline broken. Position moved to breakeven. image Entry on M1. Retest of back of trendline. I used a Buy Stop Order. image Edit 1: Wanted to show the original stoploss on M1. image Edit 2: Taken out at BE - ...
MA Crossover System that works for me
- cliffjaded replied Aug 28, 2023
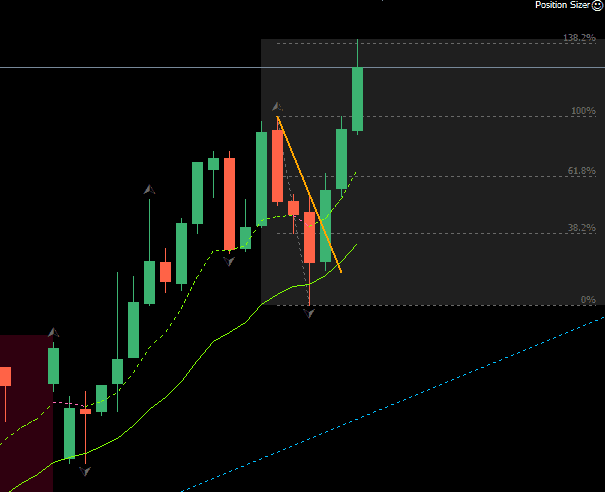
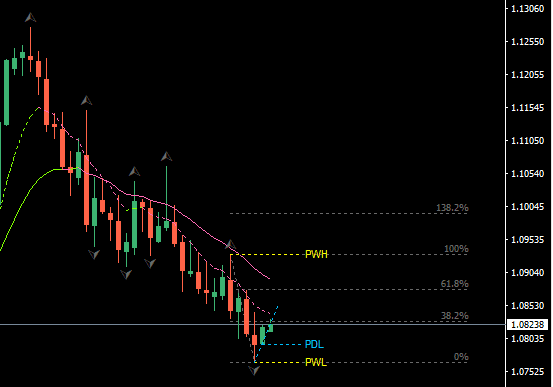
Example of target (which i just missed on EURUSD M15
MA Crossover System that works for me ). I normally target 138.2%. You have to draw the fib in reverse, from the breakout point (100%) to the retracement point (0%). You can see on price just hit 138.2%. image What's usually ...
- cliffjaded replied Aug 28, 2023
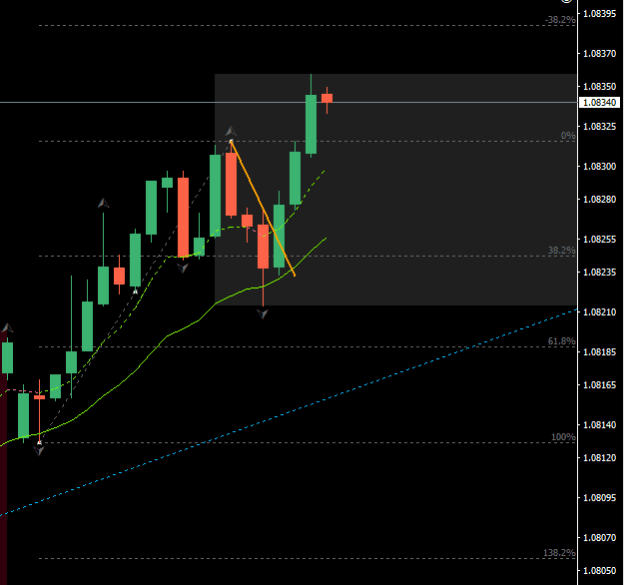
EURUSD M15 Trendline broken but no pullback available for entry
MA Crossover System that works for me image EURUSD M5 also no entry image These are intraday setups. I will not post intraday setups often and focus on the OP's swing ...
- cliffjaded replied Aug 28, 2023
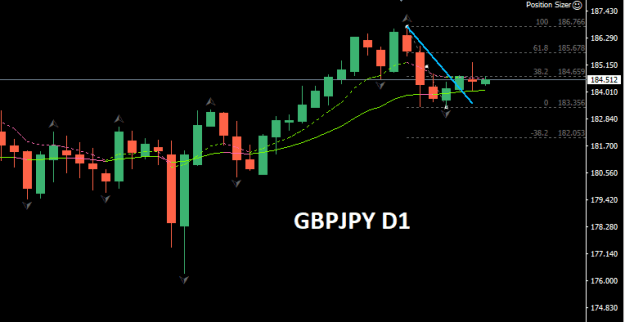
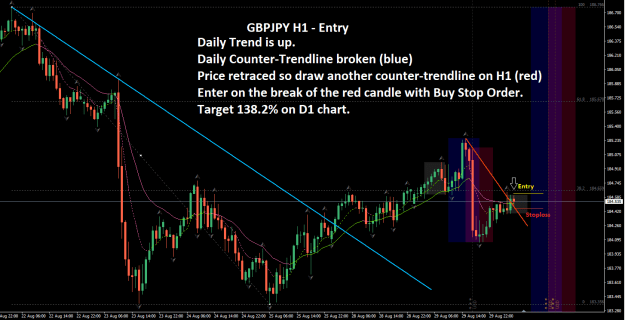
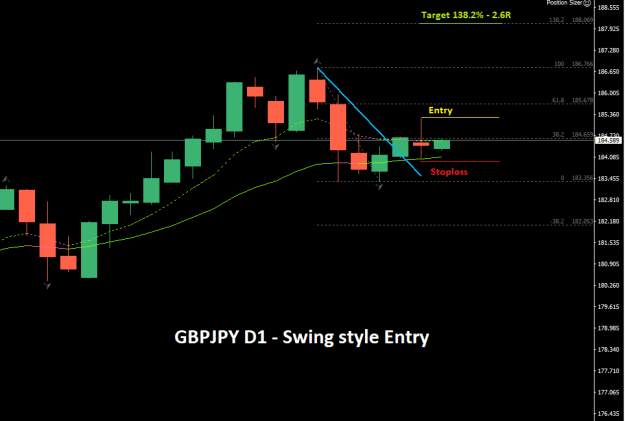
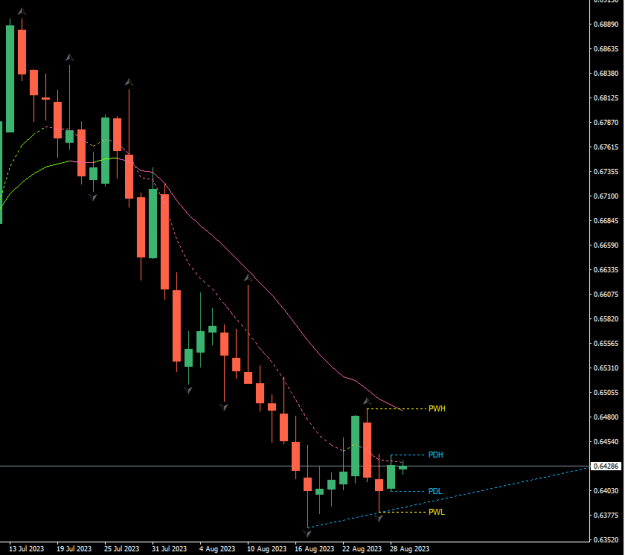
EURUSD D1 image AUDUSD D1 image GBPUSD D1 image USDJPY D1 - Trendline Broken image USDJPY H4 - Waiting for retest of D1 trendline and/or break of H4 trendline image I scan for trends using 8/20 emas. I draw trendlines and wait for a ...
MA Crossover System that works for me
- cliffjaded replied Aug 18, 2023
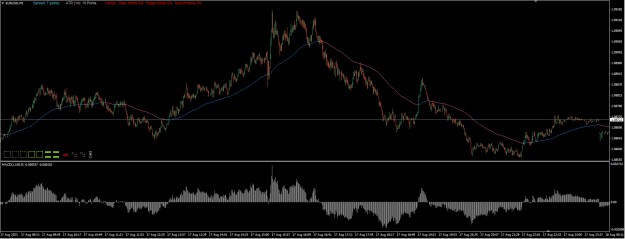
You could also use the standard MACD Histogram with MT4 and MT5. It measures the distance between 2 MAs. Just set the fast MA to 1. Set the signal line colour to none.
M1 Countertrend Scalping Strategy
- cliffjaded replied Jun 26, 2023
Quasimodo or Over-Under pattern was coined by a ForexFactory member. It has been incorporated into Supply & Demand strategies which are different from ICT concepts. url url In reality, it's actually a classic chart pattern called a Crown ...
ISR Method
- cliffjaded replied Jun 21, 2023
Here's an example of some entry methods. D1 Trend identified image H4 Entry Opportunities image M15 Entry Opportunities image
MA Crossover System that works for me
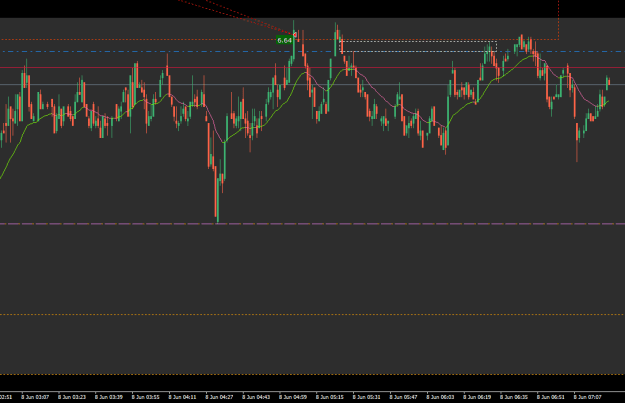
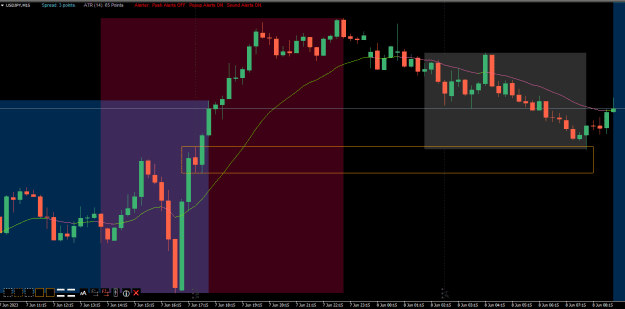
- cliffjaded replied Jun 8, 2023
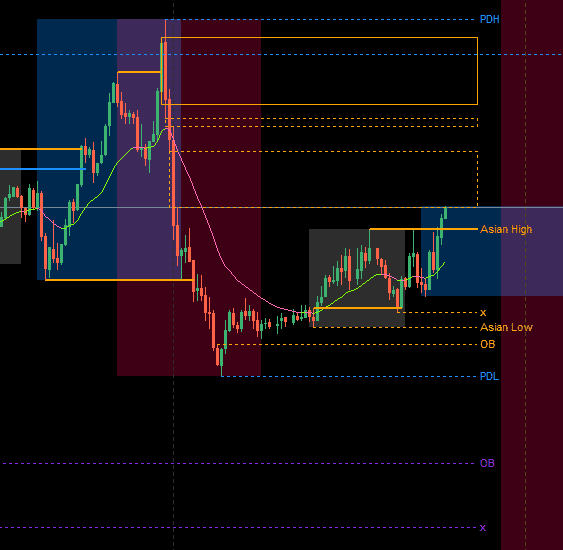
AUDUSD Asian High broken and tapping into M15 FVG.
M1 Countertrend Scalping Strategy
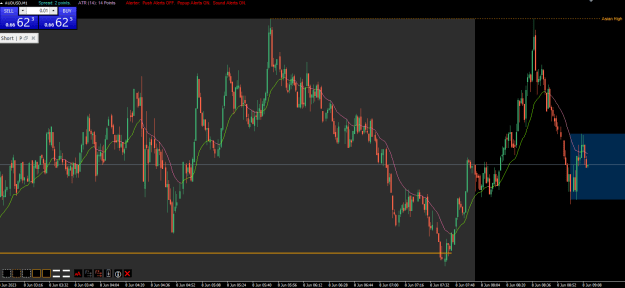
- cliffjaded replied Jun 8, 2023
You could have considered an entry from a M15 OB.
M1 Countertrend Scalping Strategy
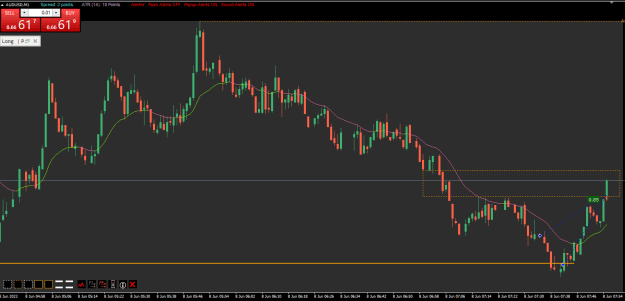
- cliffjaded replied Jun 8, 2023
If price does not return to the FVG, if i still want to enter, i'll use other methods - Market Order or Retrace to 20ema. Or I'll wait for price to reach the next POI if it has moved too far away. PA on AUDSD looking really good. I missed a move as ...
M1 Countertrend Scalping Strategy
- cliffjaded replied Jun 8, 2023
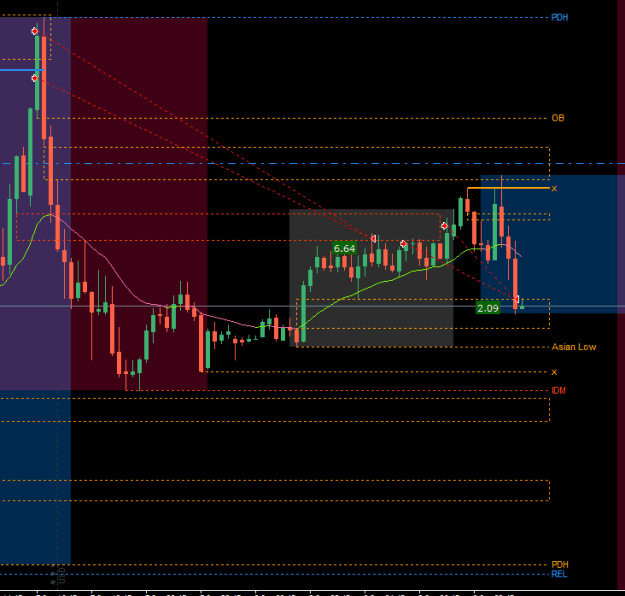
My entry on M1. Price taps into a H1 FVG, displaces below, leaves M1 FVG. I enter on a limit on the M1 FVG. Another way to enter using M1 FVG is to when price is trending quick and hard. Big long candles. Draw your FVGs and enter off them. image ...
M1 Countertrend Scalping Strategy