- Search Forex Factory
- 111 Results
-
 dkrock replied Jan 9, 2021
This is a drawing of possible target candles. A target candle will rarely have draw down. If you placed a stop loss under your entry, you should expect it to not get hit. That is a target candle, where price actually moves vertically in your favor. ...
Chart dump
- dkrock replied Jul 28, 2020
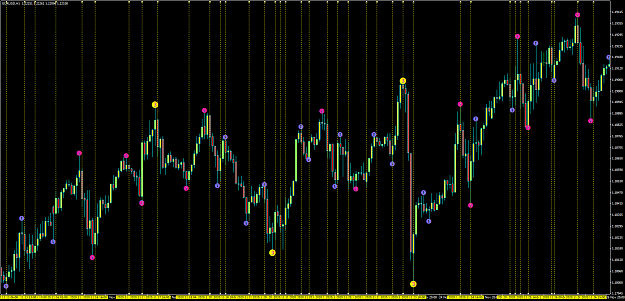
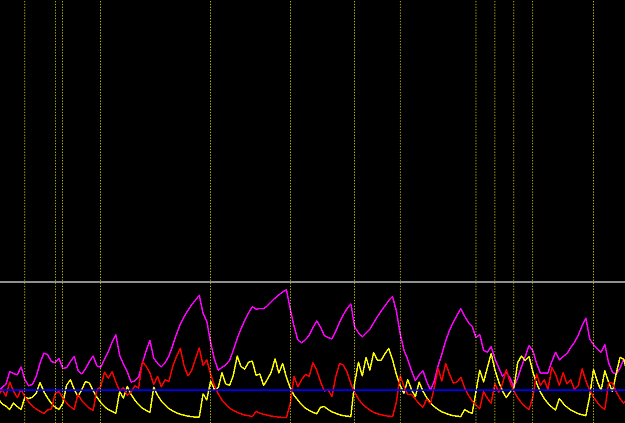
Because each new bar starts at 0, I used Bollinger bands to help gauge the time frame signal strength. I do not think I have ever used Ehler indicators, so no opinion. image
LFX Trading Proverbs
- dkrock replied May 15, 2020
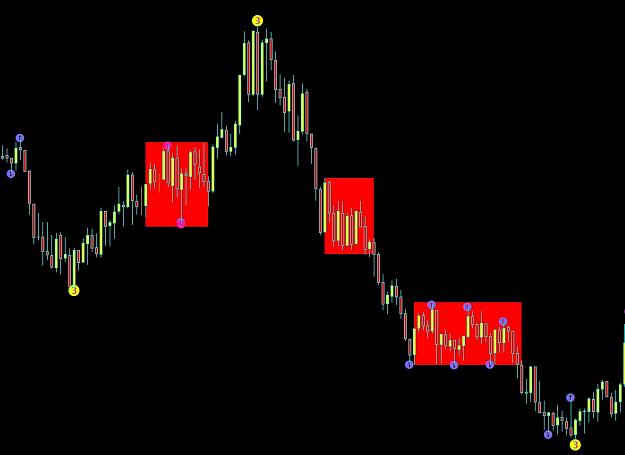
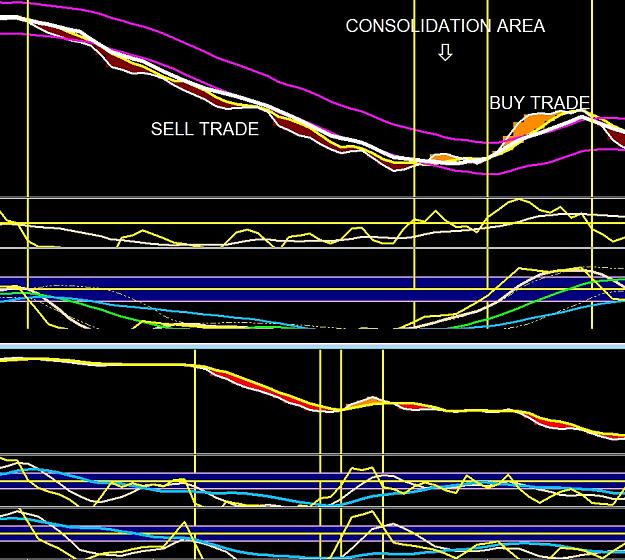
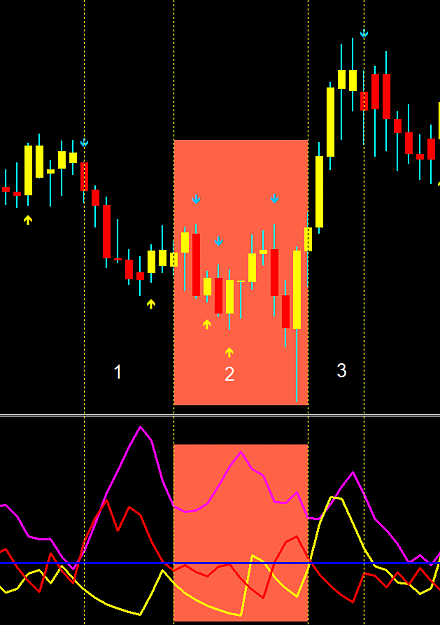
In this pic, the yellow dot "3" represents the concave where the slope is "0". The red boxes are the inflection points. In this case, all three inflection points are the horizontal type. It is important to learn how to identify the horizontal ...
LFX Trading Proverbs
- dkrock replied Feb 22, 2020
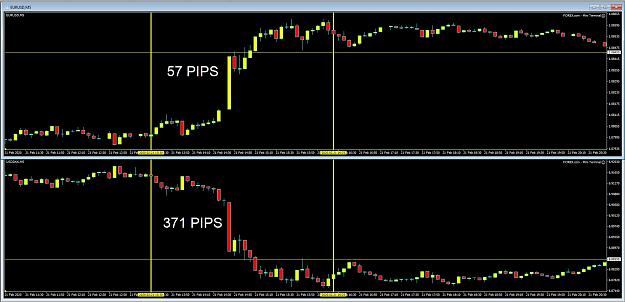
That would be why he was complaining about the spread. As for profiting, if the EURUSD moves 10 pips and USDDKK correlates with it, then it will move about 65 pips. I see the current difference is about 6.5 pips DKK per 1 pip EUR. So the compounding ...
OANDA Discussion
- dkrock replied Jan 29, 2020
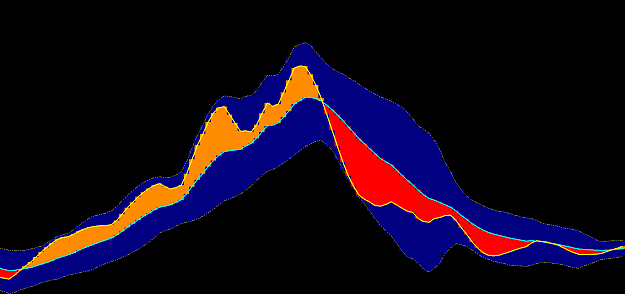
If you use a normal trading chart, the distribution of price is defined by time. You can average the distribution through time to predict direction. When you do this across multiple time frames, then you will have multiple distribution averages. By ...
LFX Trading Proverbs
- dkrock replied Sep 15, 2019
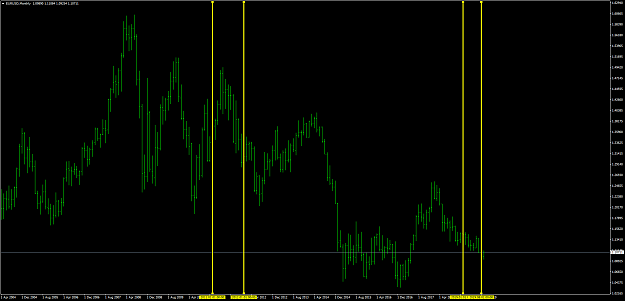
Here is a graph with real information. The first section shows price movement in 2011. The second is for January-August 2019. If you are not capable of seeing the difference, then you might want to consider staying at your J-O-B.
To scalp or not to scalp? (Images included)


- dkrock replied Jul 12, 2019
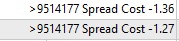
Different brokers have different ways to charge. Most likely he is on a commission + spread pricing model, in which case you are charged at entry and again at exit. I trade with a variable spread, which means I am charged half the spread at entry ...
Are trading costs the main reason of losses in trading?


- dkrock replied Jul 29, 2018
I matched the ADX up to normal swing trading and it is a little off from my signals, but not too bad. Not sure I will use it yet, but perhaps an alternative for someone else? If you have difficulty finding the end of swings and trends, it could be ...
LFX Trading Proverbs
- dkrock replied Jul 29, 2018
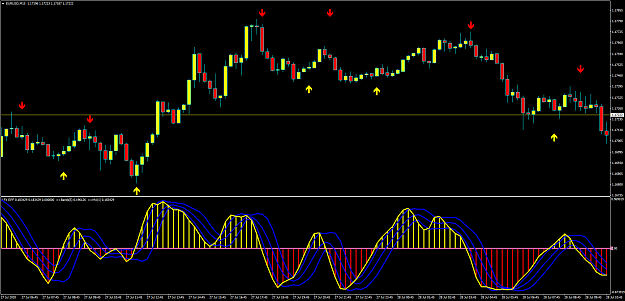
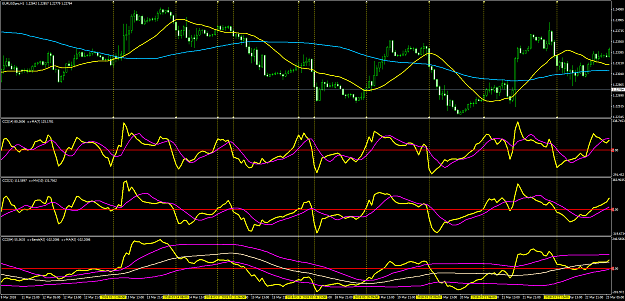
In the attached pic I am showing an example of what I mean about the ADX. I would not normally use it, but when my normal indicators are fluttering back and forth over each other, and it is hard to see when a real breakout occurs, this view aids in ...
LFX Trading Proverbs
- dkrock replied Apr 7, 2018
I don't know if this is any help to you because I cannot see your trading systems, but allow me to discuss some logic and then you can check it for yourself. First of all, what does moving average 50 or 200 or 21 have to do with anything? What is it ...
What are your moving average settings?
- dkrock replied Apr 6, 2018
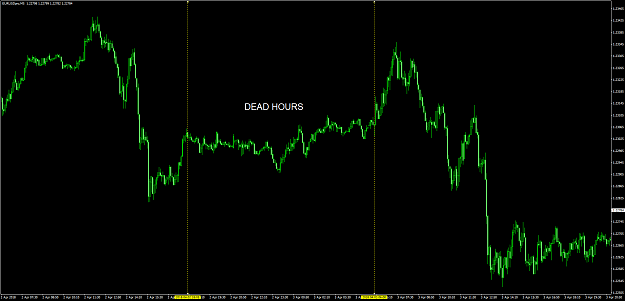
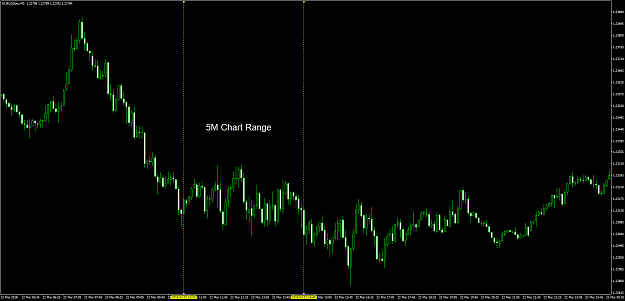
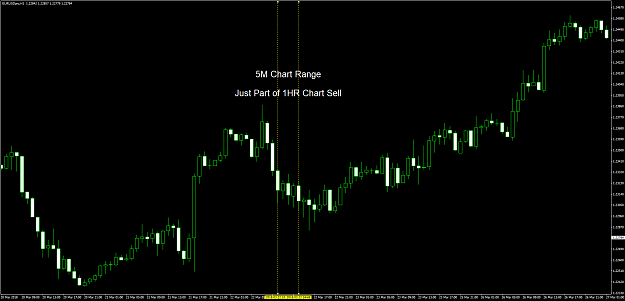
1. Move to a higher time frame for your next signal. 2. If your time frame is small enough, try to concentrate on trading when one or both banks of your pair are open. 3. Also move to a higher frame if your time frame is trending in order to limit ...
How to trade when graph is going sideways
- dkrock replied Apr 3, 2018
I do not know your specifics, but I like your concept. I think you are seeing some value in my suggestions, after making them your own. Your system must be you, not me, and you must be your system. I used the trading weeks to validate and look for ...
LFX Trading Proverbs