- Search Forex Factory
- 22 Results
-
 eliotjng replied 8 hr ago
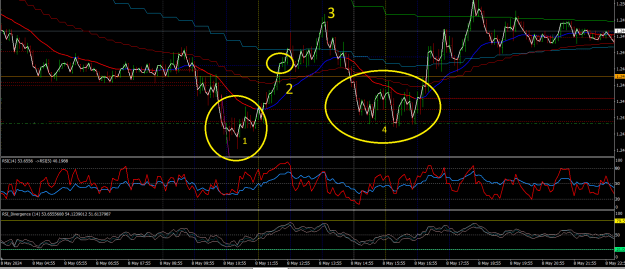
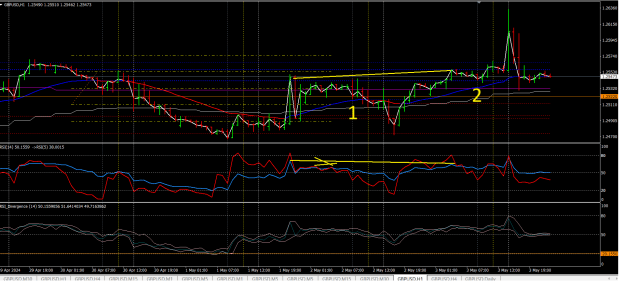
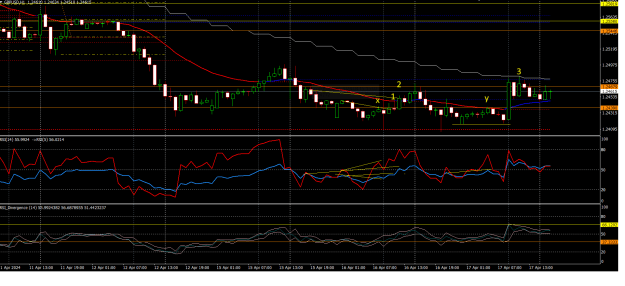
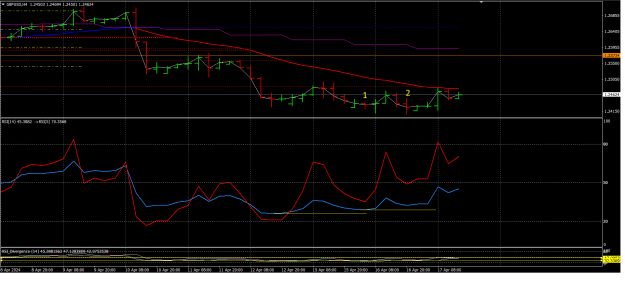
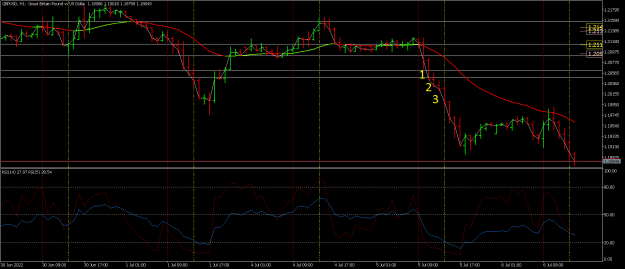
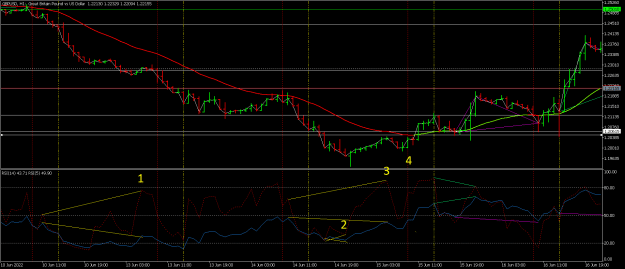
I will review how yesterday going for me. image At 1 i buy as H1 in DIV bull and so is M5. Later i close at 2, at that point, M15 close in RSI extremely + M30 close in RSI bear possible + price at M5 EMA swing level. I should short at 3 but I'm ...
Trading the Cable swings via averages
- eliotjng replied May 7, 2024
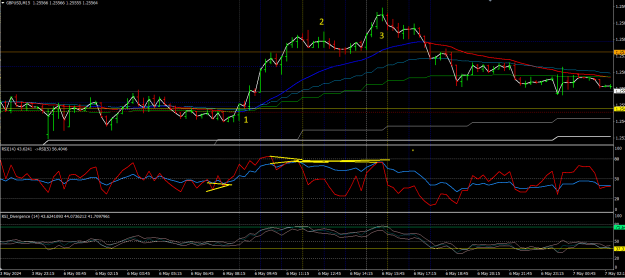
Thank for confirm this again Alan, not clear but i feel like i understand it more. Strange image Here is my review to hope to improve thing. Action on yesterday begin with M15 DIV push price above EMA, and build support on M15-M5. It is exactly ...
Trading the Cable swings via averages
- eliotjng replied May 5, 2024
Hi Alan, last week is my country holiday so i don't trade. Look back, i saw a problem and hope you help me with. How do you define " struggle "? I mean like how many bar up, or how many sideway bar make you think price will "struggle" and may not ...
Trading the Cable swings via averages
- eliotjng replied Apr 25, 2024
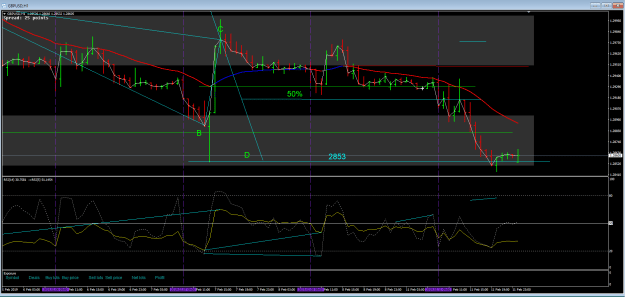
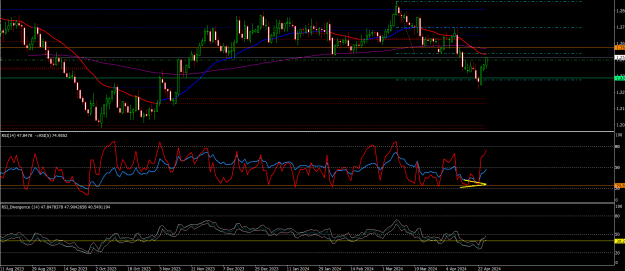
Thank you for advice Alan, I will try your ideas tomorrow then. My opinion, from daily chart already finish AB=CD and form DIV bull, maybe price today will come back at least daily EMA before go back ? image
Trading the Cable swings via averages
- eliotjng replied Apr 25, 2024
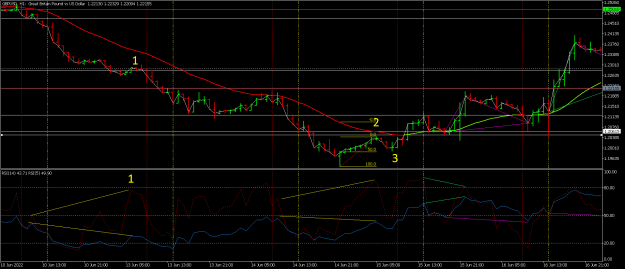
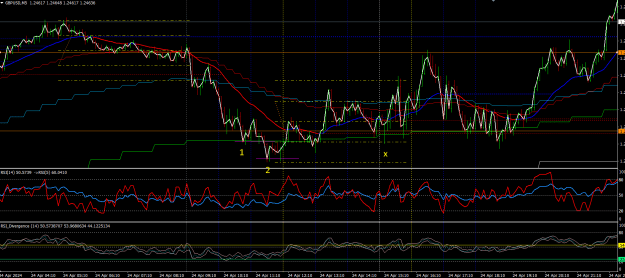
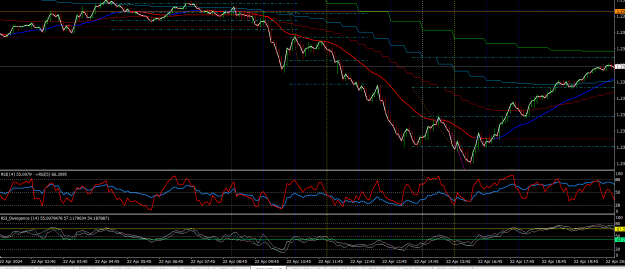
Another bad day, another loss. Here is how i trade yesteday image I'm busy yesterday so i miss our trade time, price is too near EMA H1 So my first order is at 1, i buy due to M5 DIV bull and got stoploss I re-entry at 2, my target is 2454, the ...
Trading the Cable swings via averages
- eliotjng replied Apr 23, 2024
Thank a lot 40PipsAlan
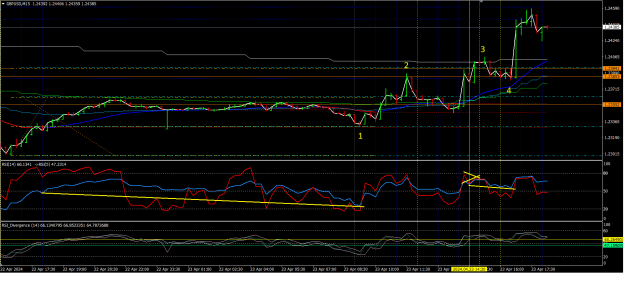
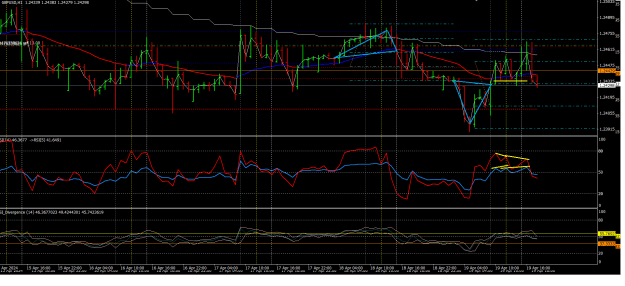
Trading the Cable swings via averages Oh Alan, i think you misunderstand me, when i said i can't see target, i mean yesterday (Monday 22 April), not today (23 April). Today i got few target on H1, and i think all action is on M15. Again, i feel ...
- eliotjng replied Apr 23, 2024
Hi Alan, can i ask where you get S1, S2 level from ? It is surely not EMA swing level on M5 as i don't have it image Yesterday is kind of hard for me as i can't identify a target for today. H1 EMA swing level is at 1.2230, M5 is at 1.2288. Both ...
Trading the Cable swings via averages
- eliotjng replied Apr 21, 2024
Thank you, Alan. H4 is also a part of reason why i also short yesterday. I still using demo to practice but this is a first time i win this big, gotta safekeeping this chart
Trading the Cable swings via averages image Can i ask what spakle you the brilliant ideas of using RSI ...
- eliotjng replied Apr 19, 2024
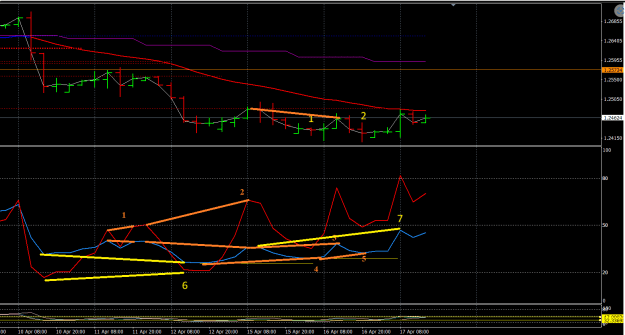
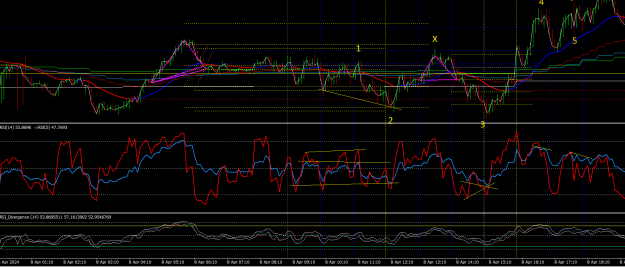
Thank you Alan, i got this Regard about H4, i think we have 7 different DIV. I have hightlight them as yellow line on chart below, with 6 is RSI DIV bull and 7 is continous DIV bear with RSI fast at extremely is strong signal for find short ? Please ...
Trading the Cable swings via averages
- eliotjng replied Apr 17, 2024
Hello Alan, can i ask what you saw on M15 for add confirm? i can't find anything DIV bull here, i just saw RSI fast at extremely low. Also about green straight line on M5, what are they ? I check on my chart and make sure there are not EMA swing ...
Trading the Cable swings via averages
- eliotjng replied Apr 9, 2024
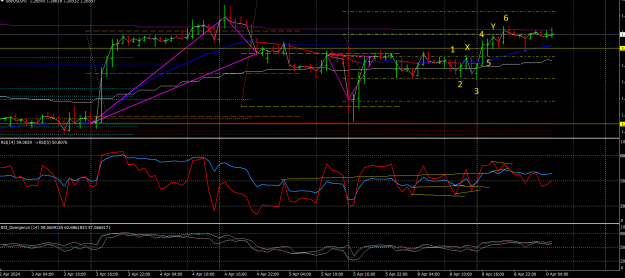
Hello Alan, can you read on my inference and give me some comment on how to improve? Yesterday, GU move around EMA, is not made any bull/bear support. But I choose down side as when find inference from H1, I see RSI fast on the up side, also EMA M5 ...
Trading the Cable swings via averages
- eliotjng replied Dec 25, 2023
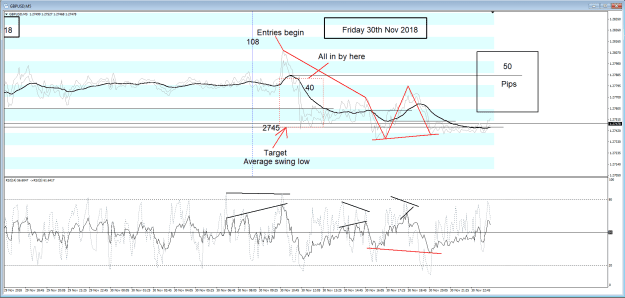
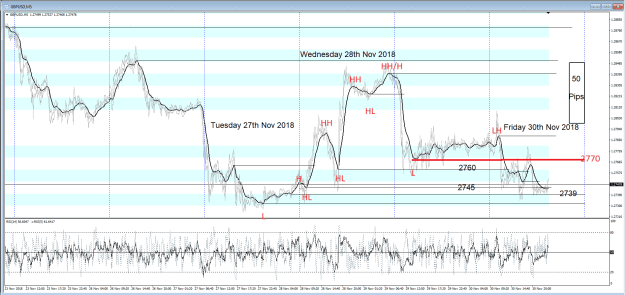
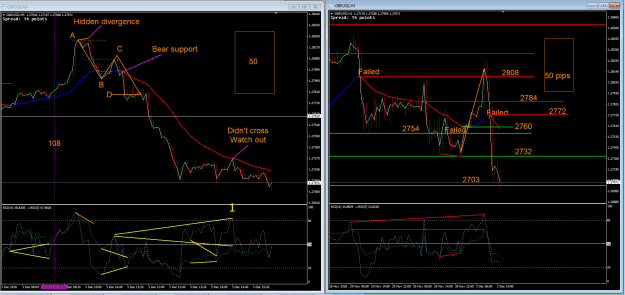
Please look at old chart here, Alan said 40 pip target on chart and his price target is 2745 --> his EMA target is 2760. image Again, can you see the RED LINE i add in chart below, i will choose EMA target is 2770 (RED number i add) --> price ...
Trading the Cable swings via averages

- eliotjng replied Dec 24, 2023
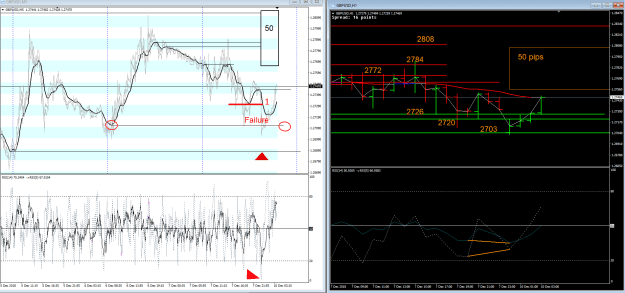
Hello Alan, I have try your method for over a year and still loss. Recently I re-read the thread again and find out the reason maybe I’m misunderstand about the rule “ If EMA fail to make LL, it will make HH instead”. Please help me with that ...
Trading the Cable swings via averages
- eliotjng replied Apr 4, 2023
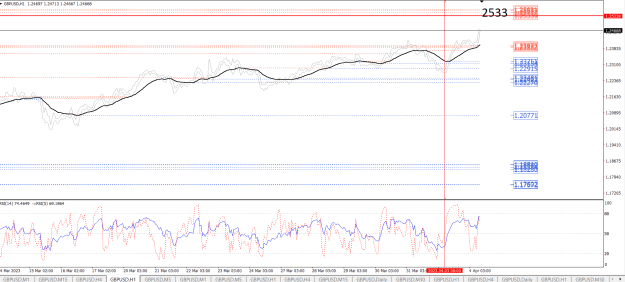
Hi Alan, can i ask the target 2445 and 2512, where do you get from ? On my chart, my nearest H1 EMA swing is 2533, far from 2445 image
Trading the Cable swings via averages
- eliotjng replied Apr 2, 2023
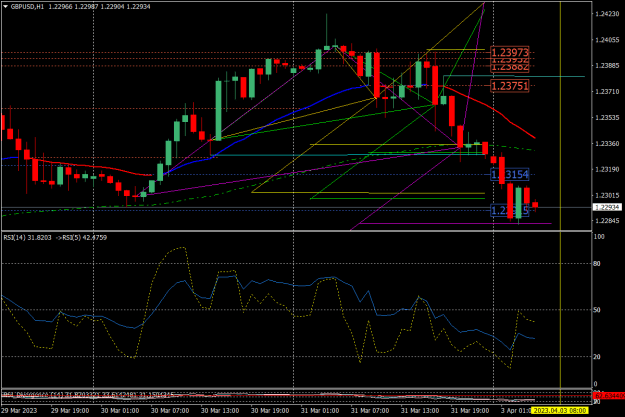
image Alan may not like this ABCD as BC is on same side, but i think this ABCD hold price rather good. EMA seem trying to find LL on H1, but on daily, it try to find HH. Still, with those inference I have short bias, let's see if there are more ...
Trading the Cable swings via averages
- eliotjng replied Jul 8, 2022
Thank you for the explain, I'm not use ABCD and AB=CD yet as i'm try focus on those basic element on the first 50 pages. And please help me with the question about "If EMA make fail make HH, it make LL instead". From top X, "if EMA fail, it should ...
Trading the Cable swings via averages
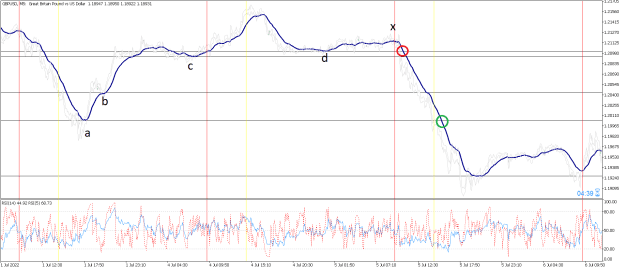
- eliotjng replied Jul 6, 2022
Hello Alan, can you please help me clarify this. If EMA can't make HH, it will make LL instead. The LL is red circle and when EMA finish breakthrough D, EMA can go up, down or sideway. Or green circle should be LL instead, and EMA must cross through ...
Trading the Cable swings via averages

- eliotjng replied Jun 20, 2022
Dear Alan, could you please talk more about this ? "The yellow lines on your RSI do not line up with the pivots on your price chart" We have type of 3 DIV: a) RSI 14 and price DIV b) HD c) Fast and Slow RSI DIV On my chart, fast and slow RSI clearly ...
Trading the Cable swings via averages
- eliotjng replied Jun 19, 2022
Dear Alan, i'm sorry if my question make you confuse as English is not my native language, so i will try again. Is the DIV draw like this is wrong? Because you are draw X signal on those DIV line ( I have highlight it with red circle). image As ...
Trading the Cable swings via averages
- eliotjng replied Jun 19, 2022
Dear Alan, can i ask why this DIV is wrong? In the post 1734 and many other post, i saw you draw DIV as megaphone pattern, too. Please let me know if i'm missing something. image My thought at that time: RSI overbought + DIV possible + under EMA H1 ...
Trading the Cable swings via averages