- Search Forex Factory
- 53 Results
- kodebfx replied Jun 24, 2019
15m & 1H still rejection TL on my chart. Not sure if my TL are correct but still be safe at side line, no sell order yet.
EURUSD only
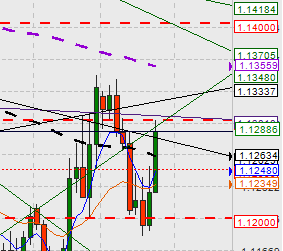
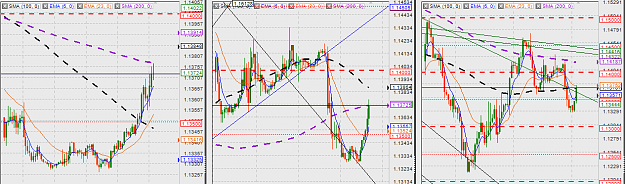
- kodebfx replied Jun 21, 2019
On my chart. 2nd daily candle rejected by the upper TL..... Price might down to the 100sma at around 1260-55.
EURUSD only
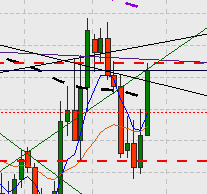
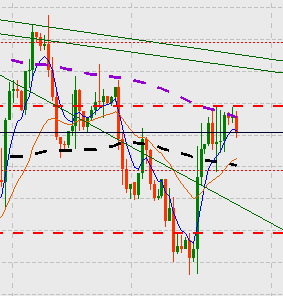
- kodebfx replied Jun 20, 2019
Daily chart show a rejection at upper trend line base on my chart. Still no hurry for a short.
EURUSD only
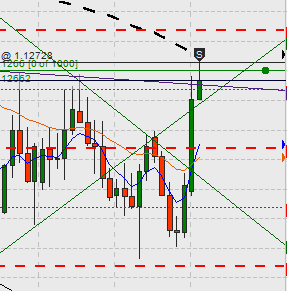
- kodebfx replied Jun 4, 2019
Short at 1.12728 on the rejection at SMA100. SL +6 now and TP open.
EURUSD only
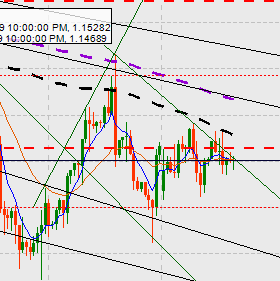
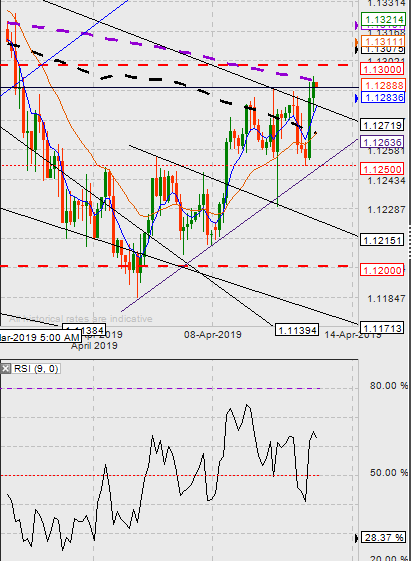
- kodebfx replied Apr 12, 2019
Well my 4H chart price rejected twice by 200 SMA, now to see what next candle can do before decision make.
EURUSD only
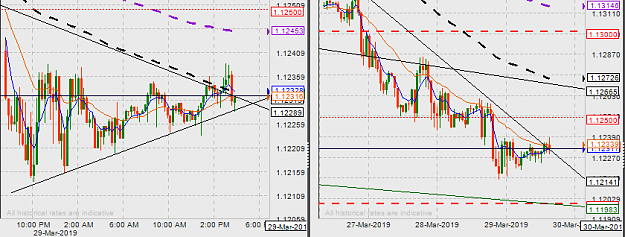
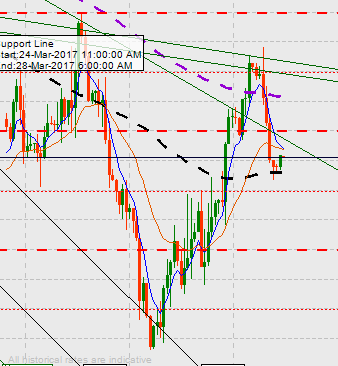
- kodebfx replied Mar 29, 2019
15m supported by lower trend line. 1h still fighting at lower trend line.
EURUSD only
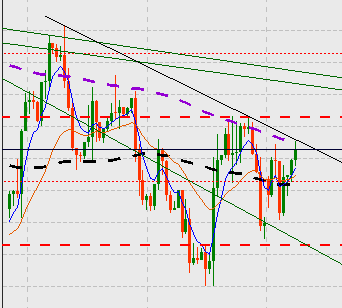
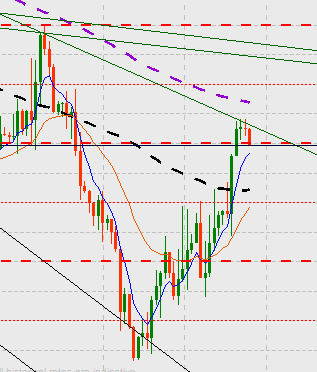
- kodebfx replied Dec 4, 2018
4h price rejected upper line and co-inside with 200sma. Will wait to see.
EURUSD only
- kodebfx replied Nov 30, 2018
I will look out for 4H at 200sma....few rejection at this level.
EURUSD only
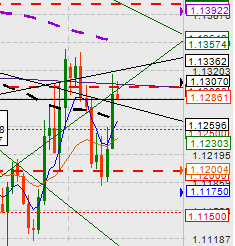
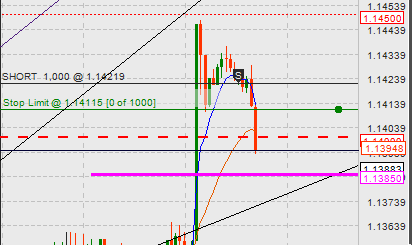
- kodebfx replied Nov 21, 2018
Well on paper trade got my 20pips. Still have trend line and 1400 to beat now.
EURUSD only
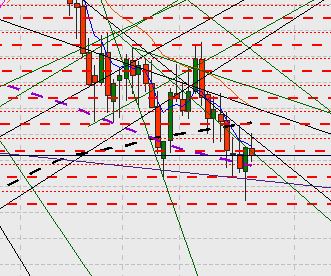
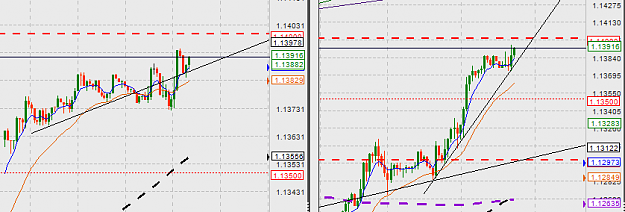
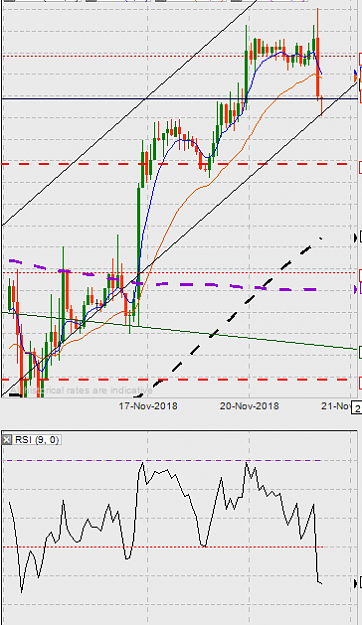
- kodebfx replied Nov 21, 2018
If base on what I see on my chart, a hammer and a doji sitting on 100sma with a bull bar. I would go for a buy order but on paper only to see if I'm right or could be wrong as well. Let see
EURUSD only
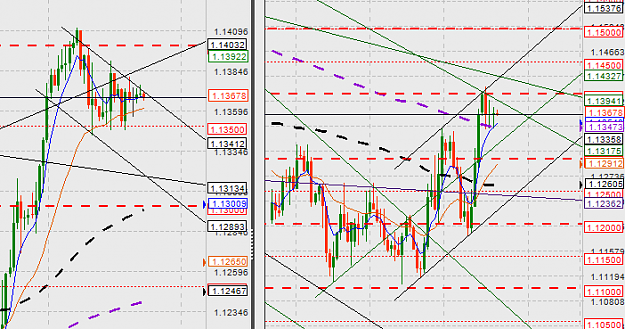
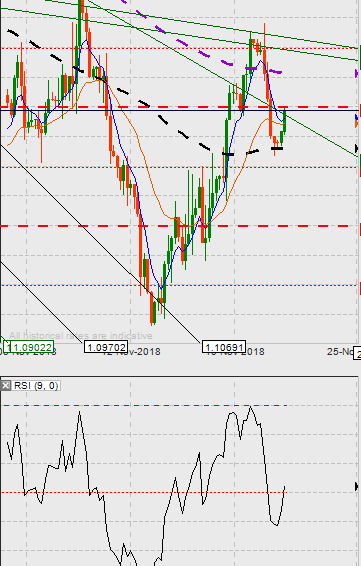
- kodebfx replied Nov 20, 2018
Not sure about this reversal for 1h, price went up but rsi maintain and going downwards.
EURUSD only
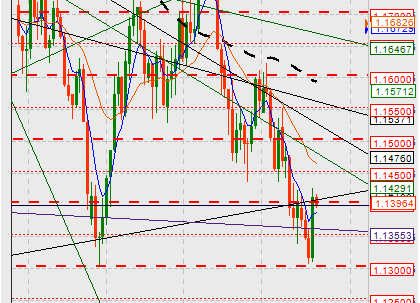
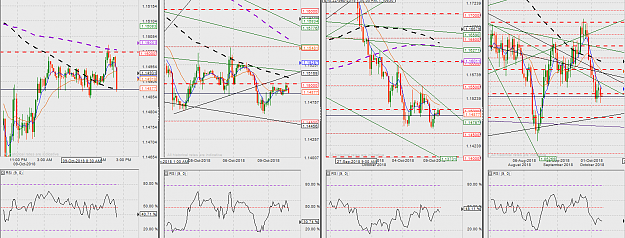
- kodebfx replied Oct 9, 2018
I would go for short base on what I see at my chart. Watching carefully at 15min 100 & 200 sma
EURUSD only