- Search Forex Factory
- 44 Results
-
 loudoniii replied Aug 19, 2019
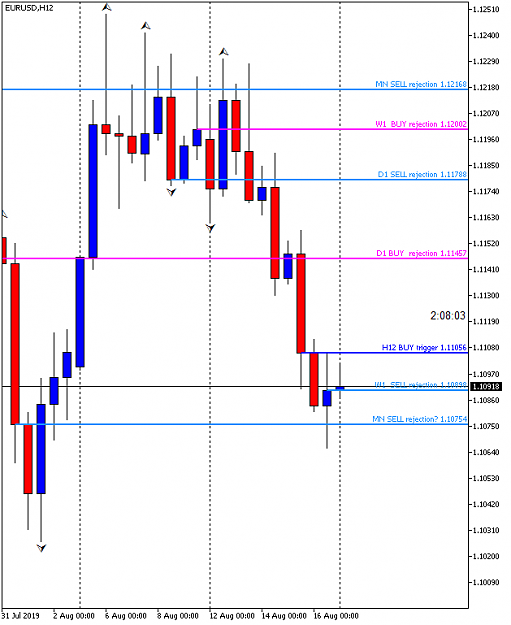
Will the Euro (EUR/USD) bounce back from last week's selloff? We have an H12 BUY trigger coming up, though it isn't perfect as Bar 3 does not close over the close of Bar 1, which is bearish. Let's see how price reacts to this BUY trigger line. A ...
Daily Chart 3-Candle
- loudoniii replied Mar 16, 2019
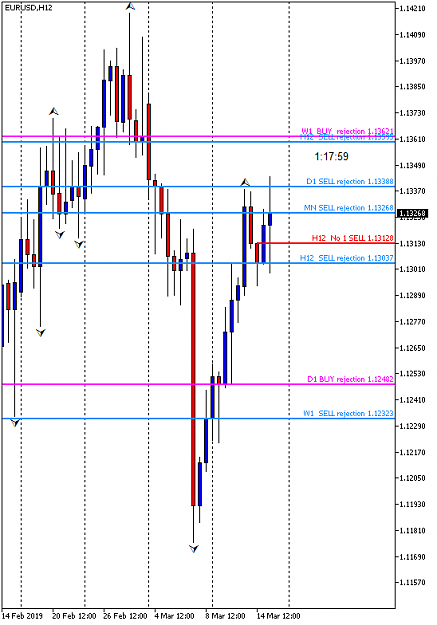
Where is the Euro (EUR/USD) heading in this coming week, I wonder? Last week it made a modest rise, despite all the European uncertainty over UK Brexit, the future of the European Union, etc. Here's a 12-Hour chart of the Euro marked up with ...
Daily Chart 3-Candle
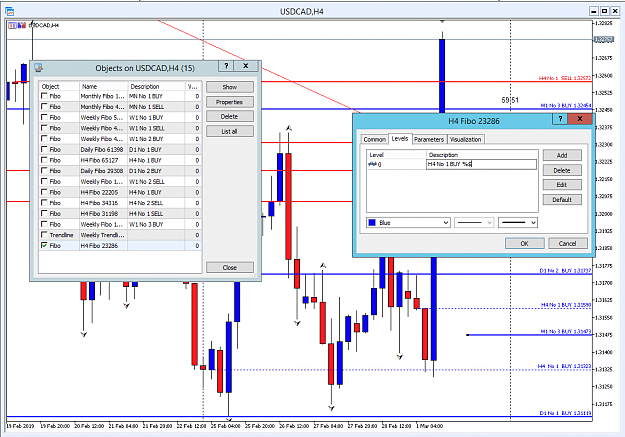
- loudoniii replied Mar 1, 2019
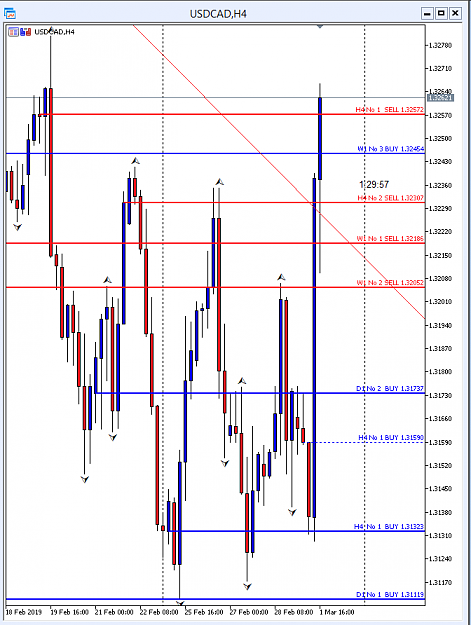
I use no indicators - this is pure Price Action trading, in line with Simone's rules i just manually mark up my charts in Metatrader 5 (MT5) , using all the principles of Simone's trading system here on Daily Chart 3-Candle. I use the MT5 Fibo tool ...
Daily Chart 3-Candle
- loudoniii replied Mar 1, 2019
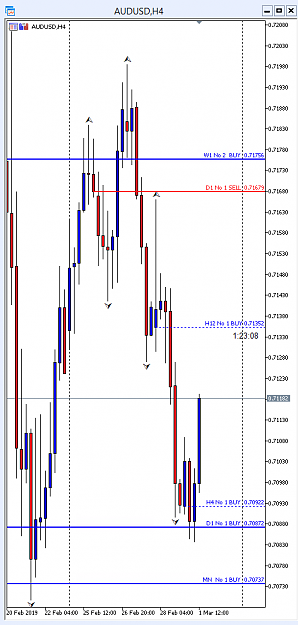
Nice Long opportunity earlier this morning UK time on the Aussie (AUD/USD), based on a Daily BUY trigger at 0.70872. I got in there with only minimal drawdown, and now have +30.2 PIPs in the bank so far, still going. I locked in a couple of PIPs, so ...
Daily Chart 3-Candle
- loudoniii replied Jan 10, 2019
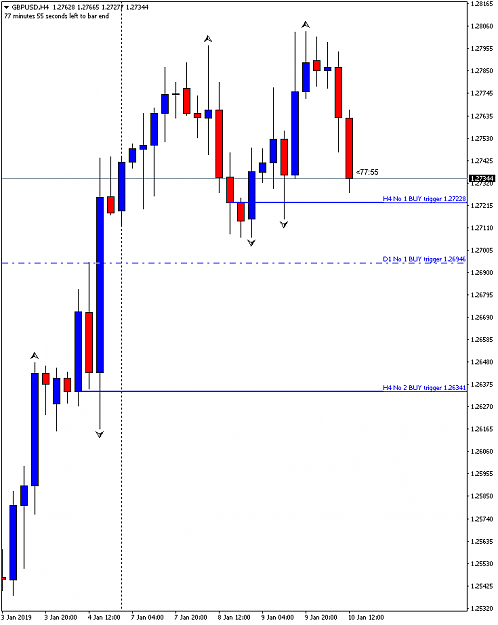
Potential Long entry on Cable (GBP/USD) at 1.2723 - see attached H4 chart. I've got my stop set at 1.2703, just below the latest Swing Low, so a 20 PIP risk. I'm aware that this is a higher-risk trade, as this setup has already yielded an 80 PIP ...
Daily Chart 3-Candle
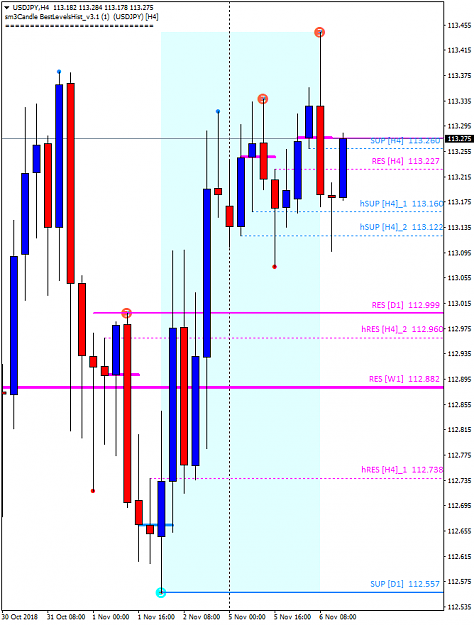
- loudoniii replied Nov 6, 2018
Just got in to the UJ (USD/JPY) Short at 113.276, with my Stop just above the Swing High at 113.470, so only a 20-PIP risk. Looks like a clear setup, so let's see how it goes. (Point of information - The indicator shows an Entry level of 113.276, ...
Daily Chart 3-Candle
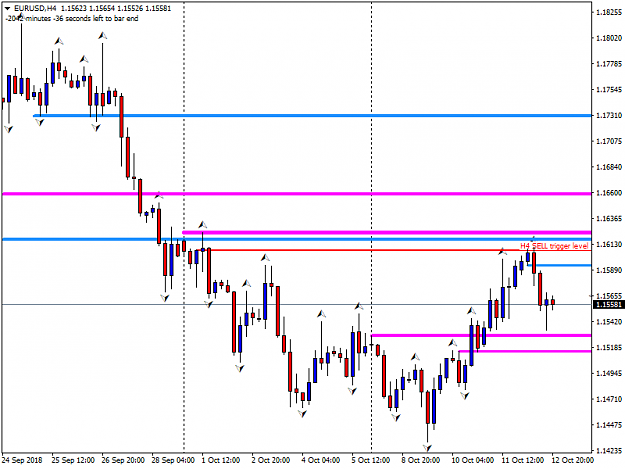
- loudoniii replied Oct 14, 2018
You make a really interesting point Simone about how setups occurring at one point in time can actually lead to a great trade entry quite some time later. Looking back on my Euro H4 chart of Friday 12th October I see the latest short off was ...
Daily Chart 3-Candle
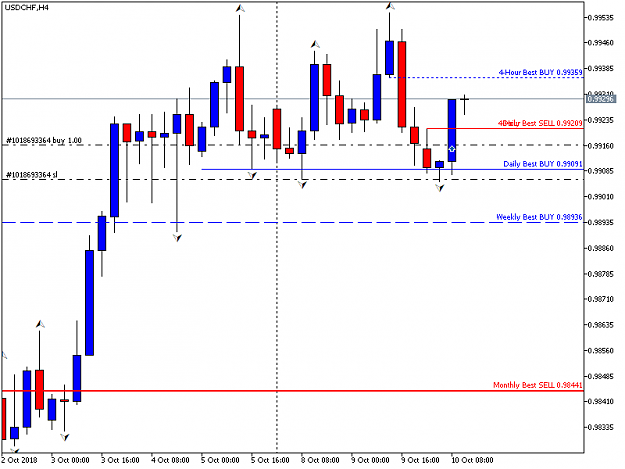
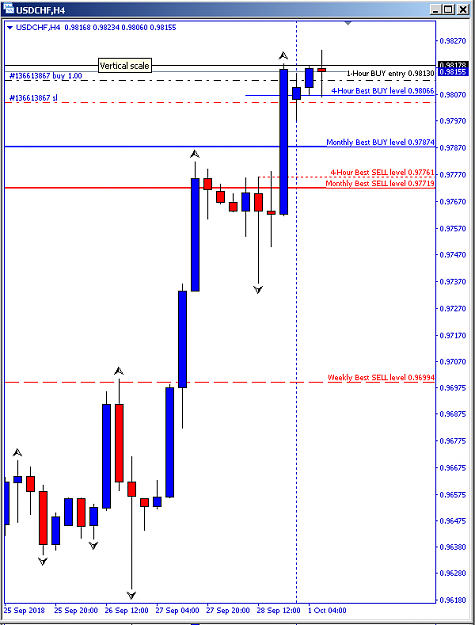
- loudoniii replied Oct 10, 2018
This morning (UK time), I went long on the Swissie (USD/CHF) when it started to bounce back up off the Daily Best BUY line which I have at 0.99091. It also did a decisive 4-Hour close above both the 4-Hour Best SELL and Daily Best SELL lines, which ...
Daily Chart 3-Candle
- loudoniii replied Oct 3, 2018
No problem, rookie14 - it's a prefectly fair question. Herewith example of today's action on the Euro, showing how price reacts to the 190.2% Fibo level on the 4-Hour chart. I made +53.3 PIPs out of this Euro Short trade, but had I stayed in a bit ...
Daily Chart 3-Candle
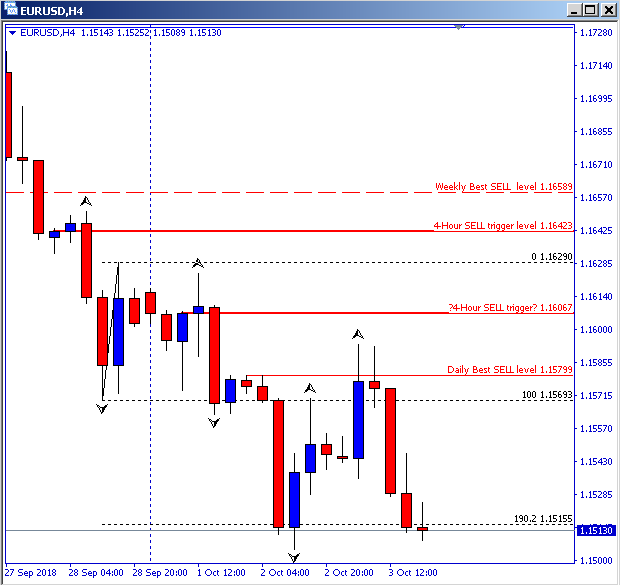
- loudoniii replied Oct 3, 2018
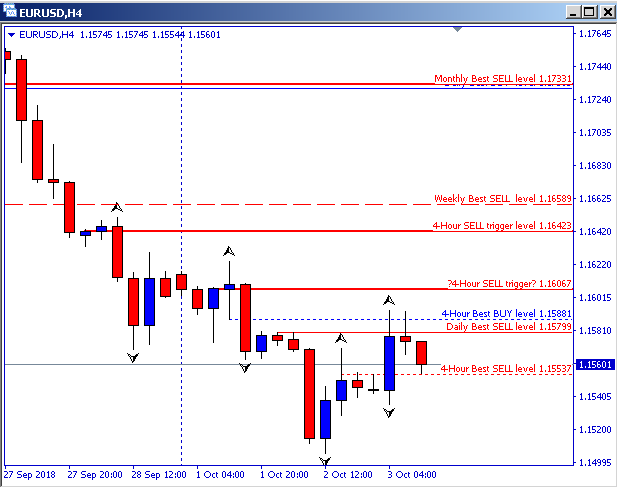
After a bit of an upwards correction yesterday, the Euro (EUR/USD) has shorted off from the Daily Best SELL level which I have at 1.15799. I got in Short at 1.15809, and it's currently around 1.15609, about 20 +ve PIPs. I've put my Stop Loss down to ...
Daily Chart 3-Candle
- loudoniii replied Oct 1, 2018
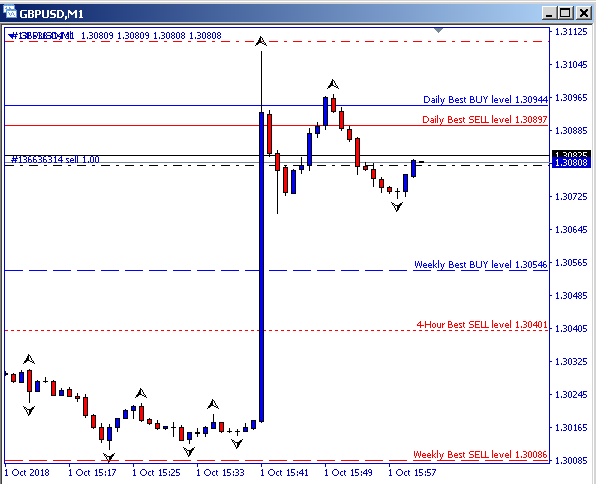
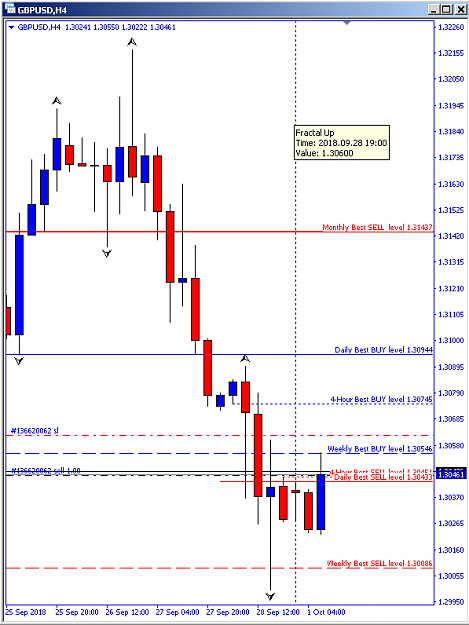
Interesting position on Cable (GBP/USD) at the moment, just after the 9:30 am BST news. Price is around the Daily and 4-Hour Best SELL levels, with Weekly, Daily and 4-Hour Best BUY levels not that far above. I guess we have to wait and see which ...
Daily Chart 3-Candle
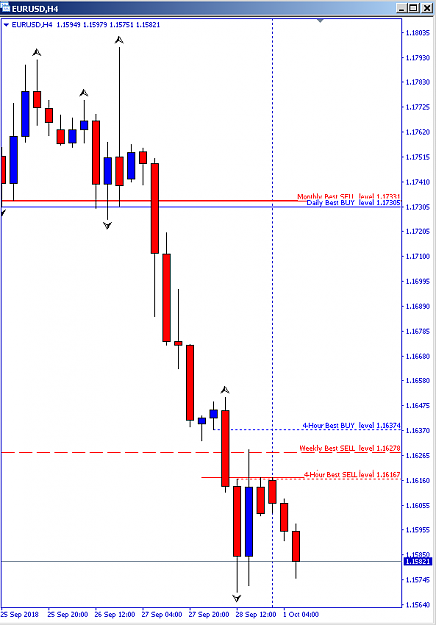
- loudoniii replied Oct 1, 2018
Looks like there are some good Short opportunities on the Euro this morning, shortly after London opening. Possible Short entry somewhere in the range 1.16167 - 1.16278, with Stop Loss above the 4-Hour Best BUY level at 1.16374. There is also a good ...
Daily Chart 3-Candle
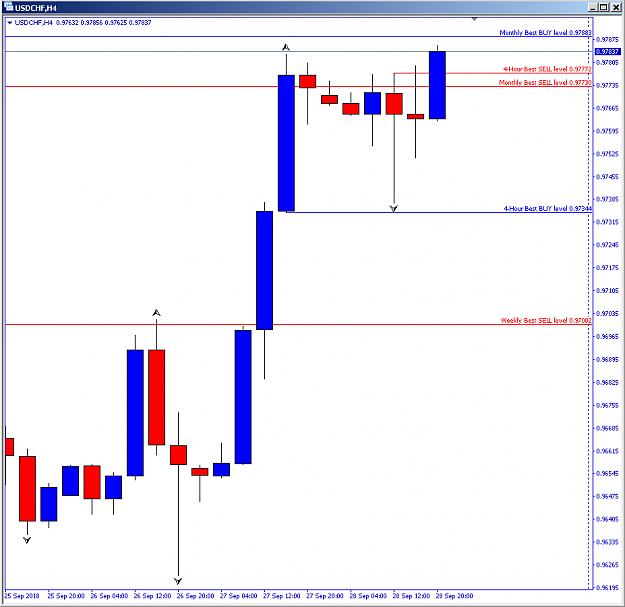
- loudoniii replied Sep 28, 2018
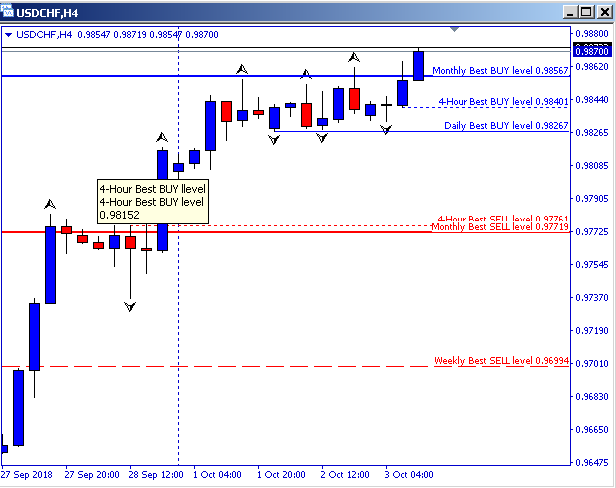
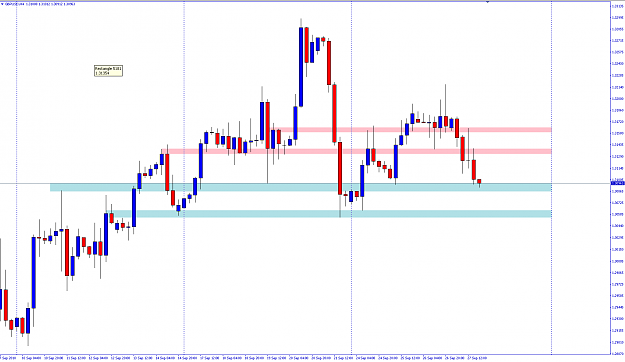
If I've marked up my charts correctly, there seems to me to be a bit of a battle of the giants going on with the Swissie (USD/CHF) at the moment. A marked upward movement stalled at the Monthly Best SELL level around 0.97730 or thereabouts. The ...
Daily Chart 3-Candle
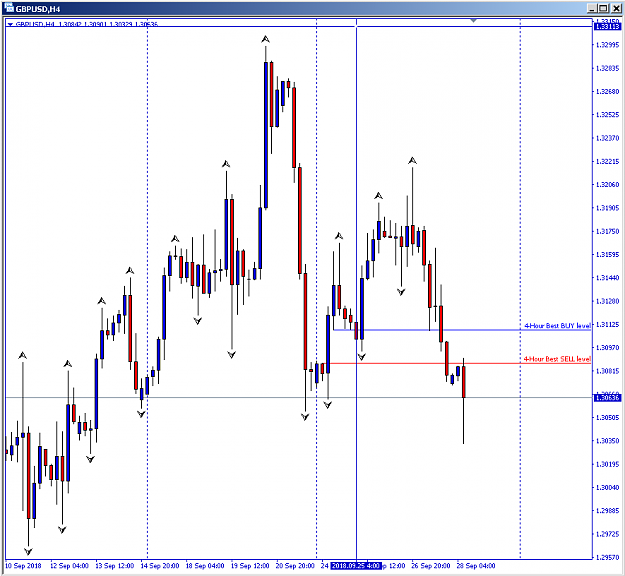
- loudoniii replied Sep 28, 2018
Nice short reaction by Cable (GBP/USD) this morning in early London trading, coming back down 54 PIPs off the marked 4-Hour Best SELL Level.
Daily Chart 3-Candle
- loudoniii replied Sep 27, 2018
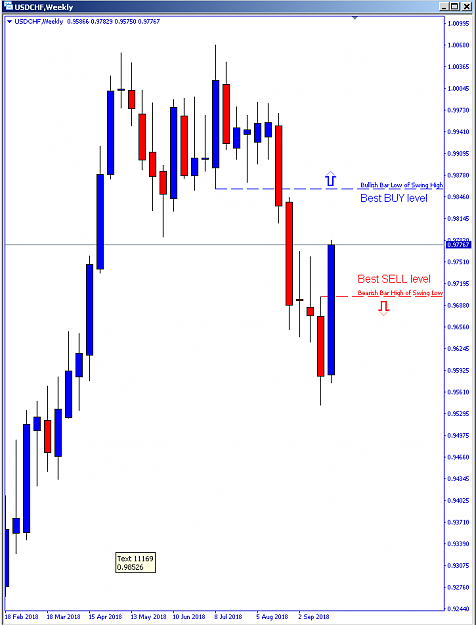
OK, so the Highest Bullish Bar Low in the 5-bar Swing High structure, do I understand? In which case, have I now marked this correctly in the attached chart, please? And presumably the Lowest Bearish Bar High in a 5-bar Swing Low structure for Best ...
Daily Chart 3-Candle

- loudoniii replied Sep 27, 2018
Thanks, I misunderstood. Do I now understand correctly that you mean the HIGHEST LOW of a BULLISH BAR in the most recent Swing High? As marked on the attached chart? Thanks, Paul
Daily Chart 3-Candle
- loudoniii replied Sep 27, 2018
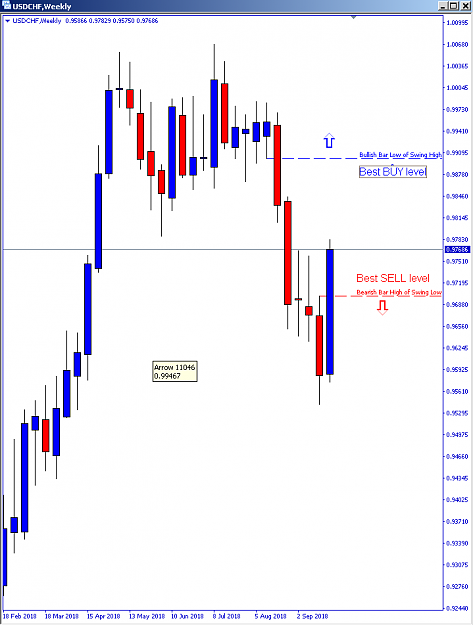
OK, thanks. So, I presume that the equivalent Best BUY Level is the is the Highest Bullish Bar Low of the current Swing High - have I marked this one correctly, please? And you carry out a similar analysis on Daily, Weekly, and Monthly to get a ...
Daily Chart 3-Candle
- loudoniii replied Sep 27, 2018
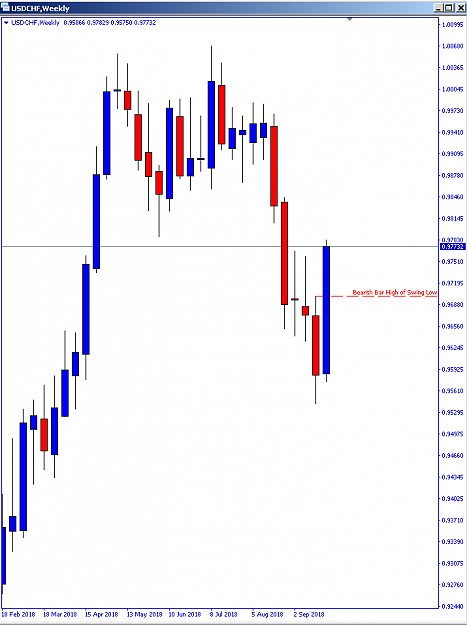
V. cool ... thank you so much for sharing this! I'm not quite sure I understand how it works yet, so please see attached chart of the USD/CHF Weekly. Have I marked correctly the Lowest Bearish Bar High of the current Swing Low? Or do you mean the ...
Daily Chart 3-Candle
- loudoniii replied Sep 27, 2018
Hi again Simone Oh no, you caught me peeking at your monitors! Sorry ... I was wondering if you have found any good way to find the S + R levels at which swings are likely to occur? I've tried Fibo's, and various time periods of Pivot Levels, but ...
Daily Chart 3-Candle
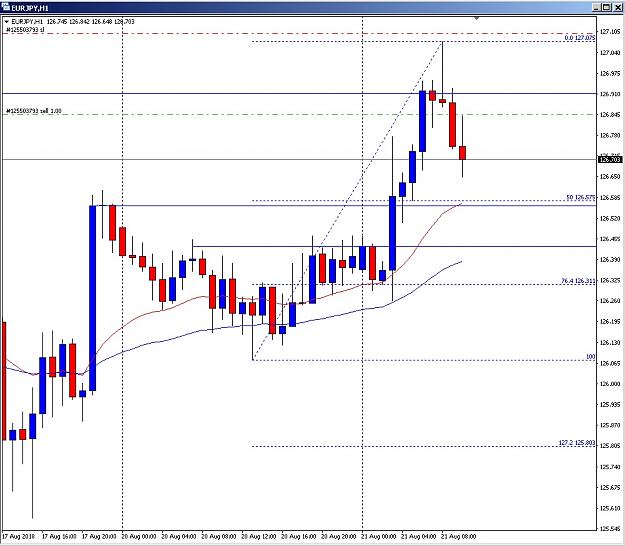
- loudoniii replied Aug 21, 2018
When to exit this EJ short trade? Conservative approach would maybe be to take it out around 126.56, confluence of previous S+R level and the 50% Fibo. Alternatively, assuming you already have your risk locked away anyway, is to see if it wants to ...
Pinpars Rock