- Search Forex Factory
- 19 Results
- martina31 replied Mar 22, 2019
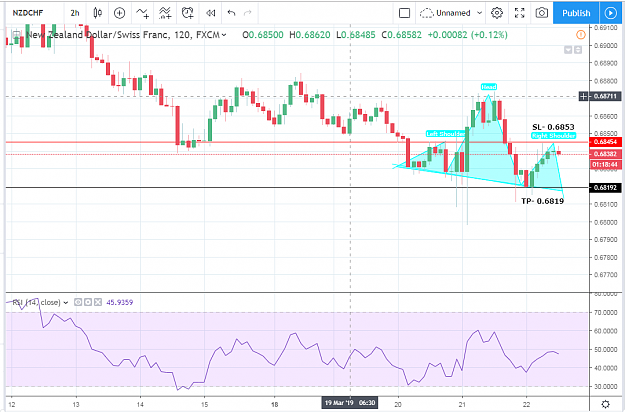
NZDCHF; Head and shoulder pattern The pair has been forming a head and shoulder pattern on intraday chart. Currently, NZDCHF is in the process to make its second shoulder, where first shoulder and head are successfully formed. I suggest you to go ...
Daily Trading Ideas
- martina31 replied Mar 20, 2019
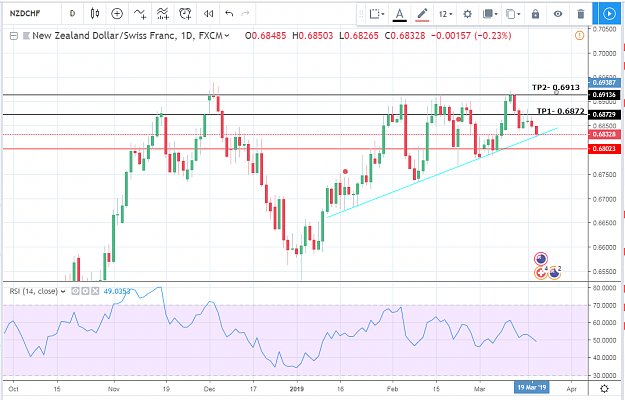
NZDCHF; Buy signal NZDCHF is expected to bounce back from two month old support trend line. The pair has tested the trend line multiple times during this period but each time failed to drop below. I suggest to enter a long position at the current ...
Daily Trading Ideas
- martina31 replied Mar 19, 2019
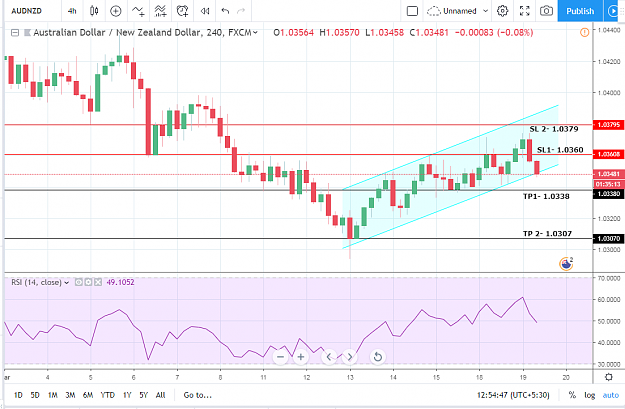
Short AUDNZD On intraday chart, the pair took a breakdown from the rising channel pattern that was in place since 13th March 2019. AUZNZD is expected to be further controlled by bears, as a result of which the pair will test the first target at ...
Daily Trading Ideas
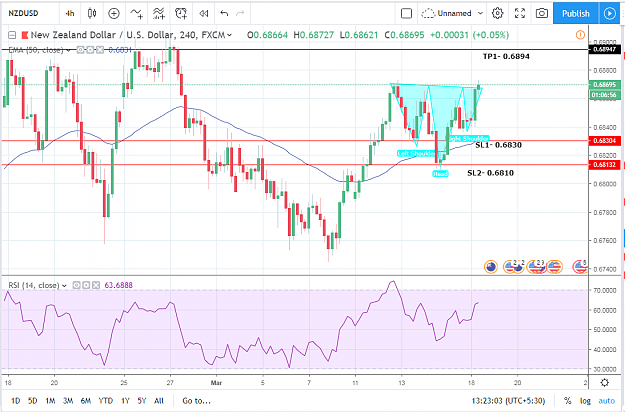
- martina31 replied Mar 18, 2019
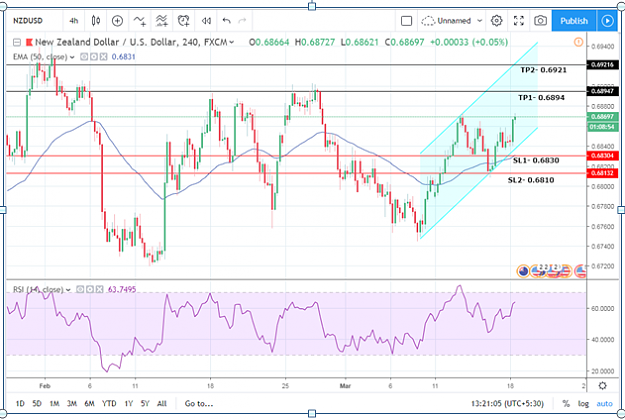
NZDUSD: Rising channel pattern plus inverted head and shoulder; buy signal The pair is trading in ascending channel pattern on intra-day chart since 7th March 2019. NZDUSD rebounded from the lower trend line and is currently heading towards the ...
NZD/USD
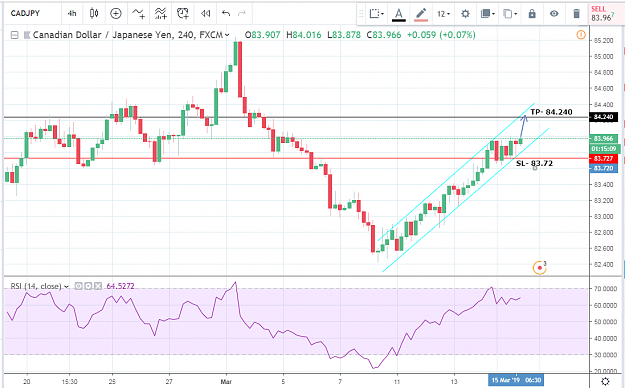
- martina31 replied Mar 15, 2019
CADJPY: Ascending channel pattern The pair has been moving in ascending channel or a rising channel pattern since 8th March 2019. Every time the pair tries to breach the upper trend line it is pulled back to the lower trend line and vice versa. I ...
Daily Trading Ideas
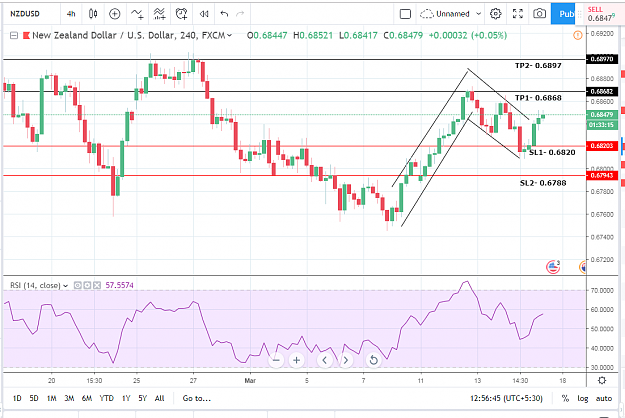
- martina31 replied Mar 15, 2019
NZDUSD- Bull flag pattern; buy opportunity The currency pair has formed a bull flag pattern on the intraday chart, thus indicating towards the bullish momentum. The pattern has already started showing its results as marked in the chart. TP1- 0.6868 ...
NZD/USD
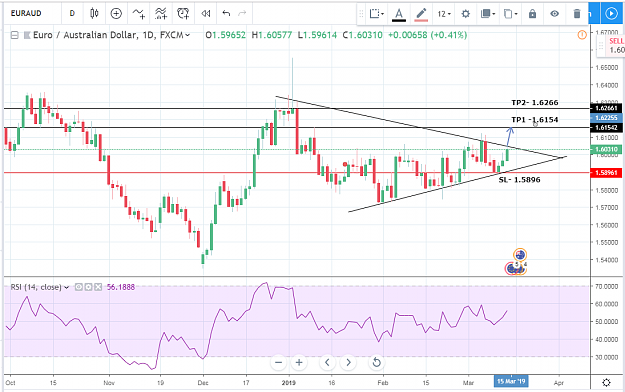
- martina31 replied Mar 14, 2019
EURAUD forming symmetrical triangle pattern The pair is giving a buy opportunity as i think it will take a breakout from the symmetrical triangle pattern in near term. The first target is at 1.6154 and the next target is at 1.6266. Stop loss can be ...
Daily Trading Ideas
- martina31 replied Mar 13, 2019
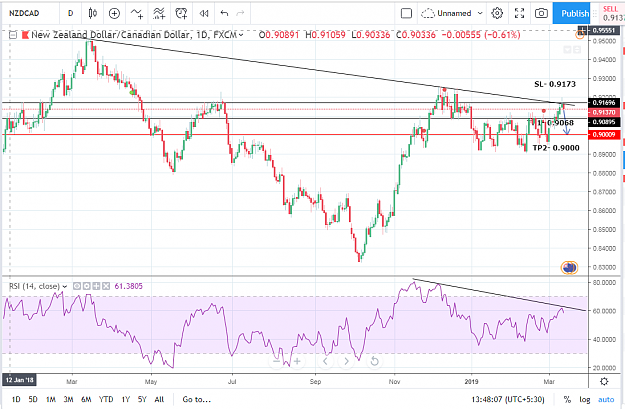
NZDCAD- sell signal The pair is giving a sell opportunity as it pushed lower from one year old resistance trend line. The target points and stop loss are mentioned on the below chart.
Daily Trading Ideas
- martina31 replied Mar 12, 2019
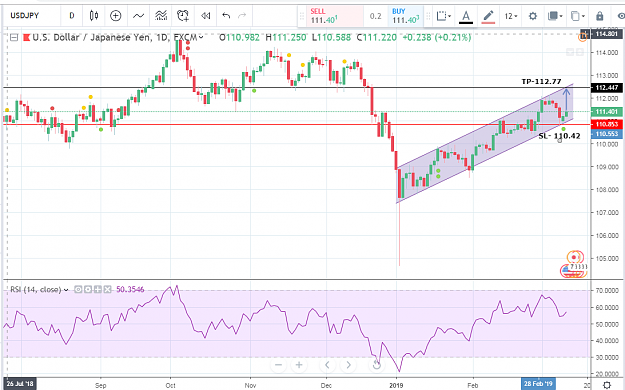
Buy signal in USDJPY The pair has been moving within an ascending channel pattern since the beginning of this year on daily chart. Every time the pair tries to breach the upper trend line it is pulled back to the lower trend line and vice versa. ...
USD/JPY Discussion
- martina31 replied Mar 11, 2019
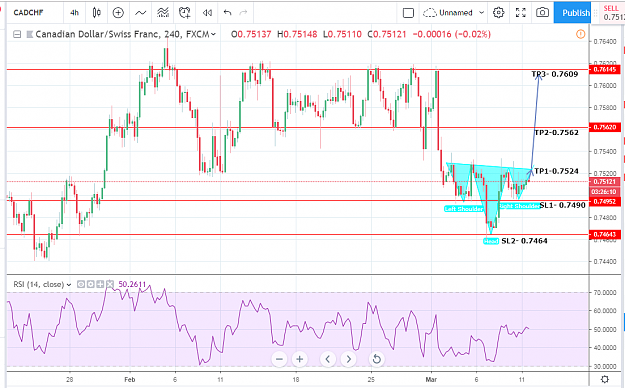
Buy opportunity in CADCHF The pair has been forming a inverse head and shoulder pattern in 4H chart. All the levels are mentioned on below chart. Happy Trading..!!!!
Daily Trading Ideas
- martina31 replied Mar 7, 2019
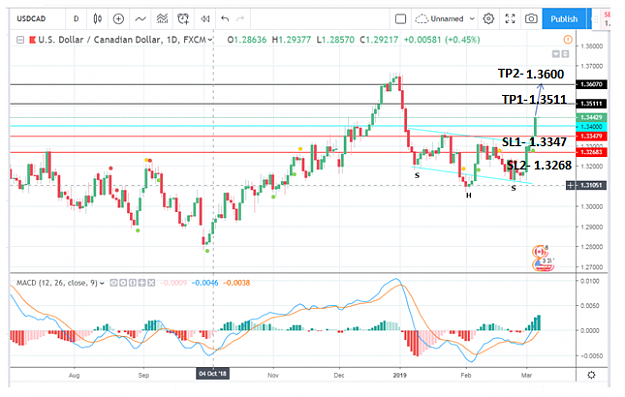
USDCAD buy opportunity The pair is expected to reach December month highs around 1.36 following the bullish inverse head and shoulder reversal pattern on the daily chart. The prices pushed above the neckline and confirmed for further upside ...
USD/CAD
- martina31 replied Mar 6, 2019
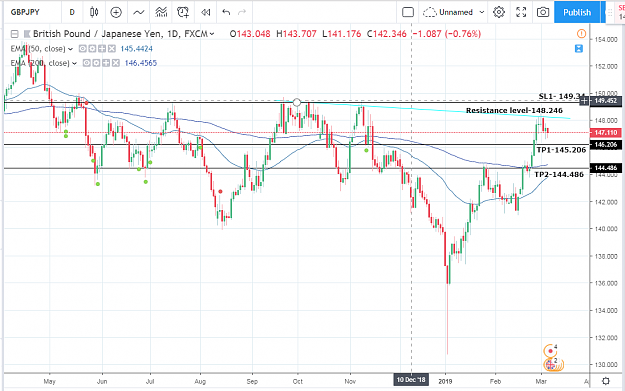
Sell opportunity in GBPJPY The pair faced rejection from the 6-month old descending trend line. I think GBPJPY will test the first support at 145.20 in near term and if sustains below this level then it will test the next support at 144.48. Stop ...
Daily Trading Ideas
- martina31 replied Mar 4, 2019
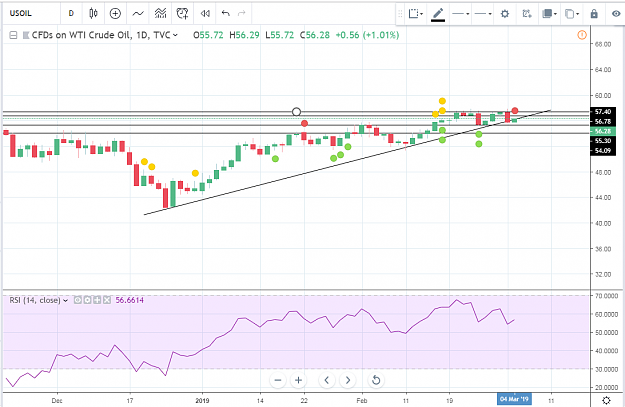
WTI crude oil went back to test its two and half month old support trend line. Further, the oil prices can test the first resistance at 56.78 and a breach above can lead it to reach the key resistance of 57.40. SL- 55.38, it will act as strong ...
WTI Crude Oil Trading
- martina31 replied Feb 28, 2019
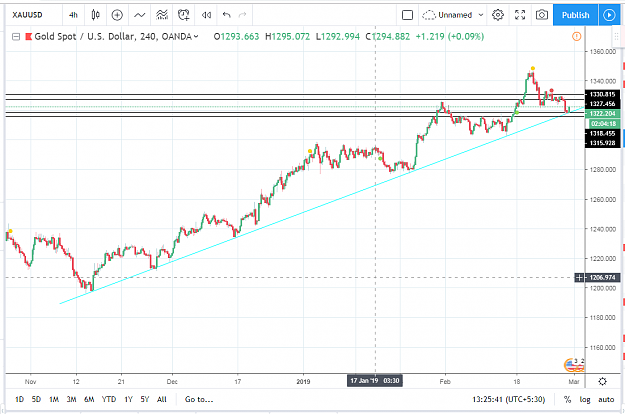
Buy opportunity in XAUUSD The pair took a support from 4 month old trend line. As shown in the chart, every time XAUUSD tested this trendline, it failed to drop below. I think the pair will go in northward direction and it will be first testing the ...
XAU/USD & XAG/USD - Gold & Silver Traders Thread
- martina31 replied Feb 26, 2019
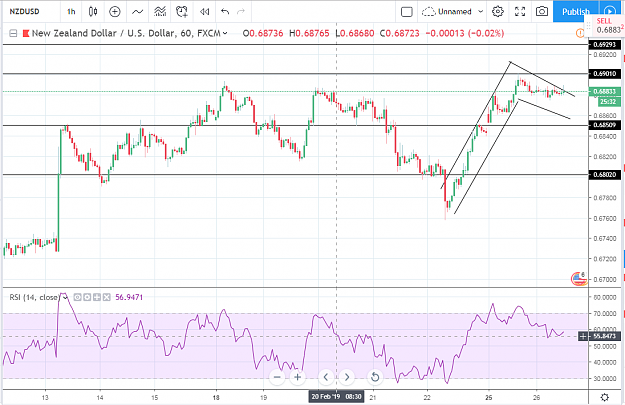
NZDUSD formed a bull flag pattern and indicating for further rally in the pair. A breakout from 0.6900 handle will confirm the bulls. TP1- 0.6915 SL1- 0.6850
NZD/USD
- martina31 replied Feb 25, 2019
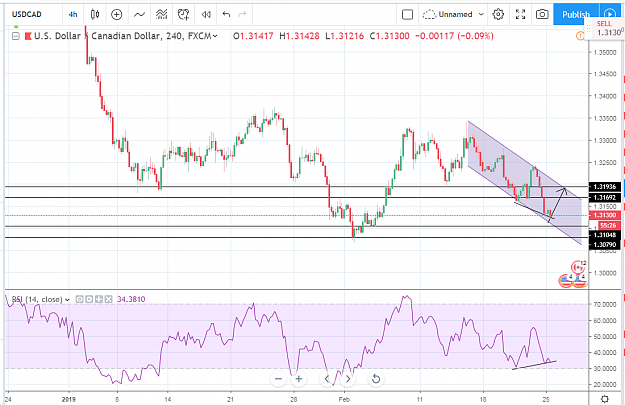
Buy opportunity in USDCAD USDCAD is trading in descending channel pattern. Every time the pair tries to breach the upper trend line it is pulled back to the lower trend line. I expect the pair to rebound from 1.3092 level and it will test the upper ...
USD/CAD
- martina31 replied Feb 22, 2019
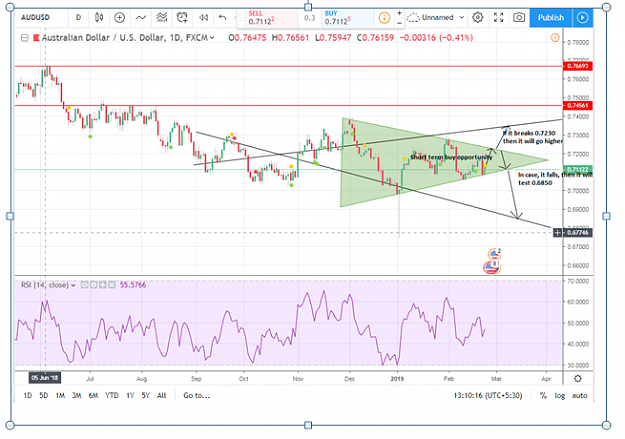
AUDUSD: Symmetrical triangle pattern The pair is trading in a symmetrical triangle and I expect the pair to test 0.7226 in near term. A break above this level will continue the buying pressure as a result the pair can test 0.7236 as shown in chart. ...
AUD/USD
- martina31 replied Feb 19, 2019
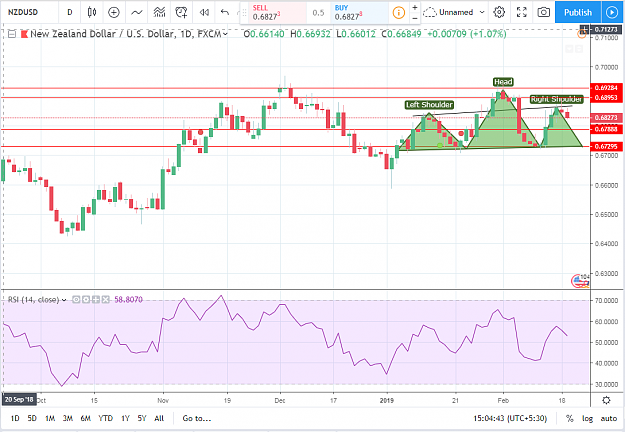
Selling opportunity in NZDUSD The pair is forming Head and Shoulder pattern in daily chart where first shoulder and head has been successfully formed and the second shoulder is in process. TP1: 0.6788 TP2: 0.67295 SL1: 0.6895 SL2: 0.6928
NZD/USD
- martina31 replied Feb 18, 2019
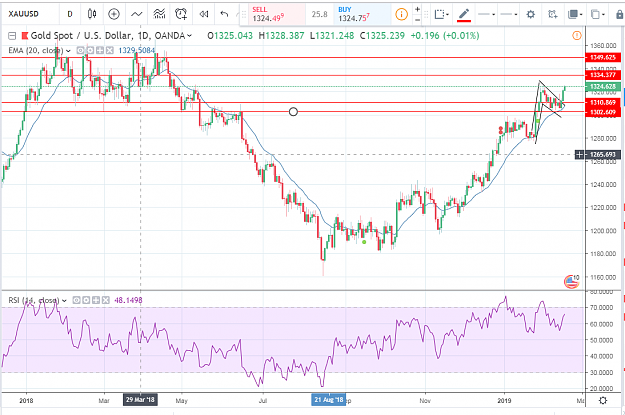
XAU/USD Past week rally was supported by bull flag pattern. The pair is expected to breach the key resistance area of 1324.00. If it registers a closing above this level then intensive buying can be seen in yellow metal. Consequently, the pair can ...
XAU/USD & XAG/USD - Gold & Silver Traders Thread
- Posts by Member Search: 'martina31'