- Search Forex Factory
- 39 Results
- mayflower replied Jan 19, 2022
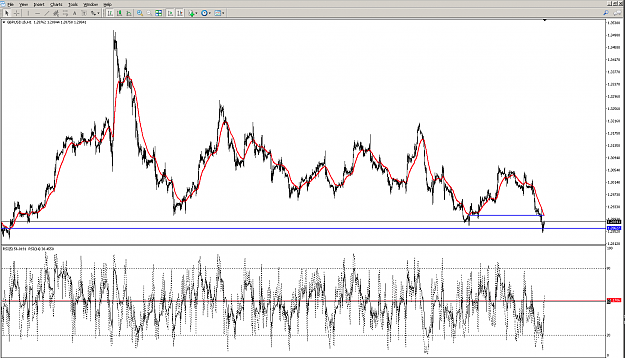
This posted on Monday. Price still on it's way down and now at another Zoo point.
Trading the Cable swings via averages
- mayflower replied Jan 17, 2022
Thank you for your comment P, I thought that was done and dusted on Friday?
Trading the Cable swings via averages
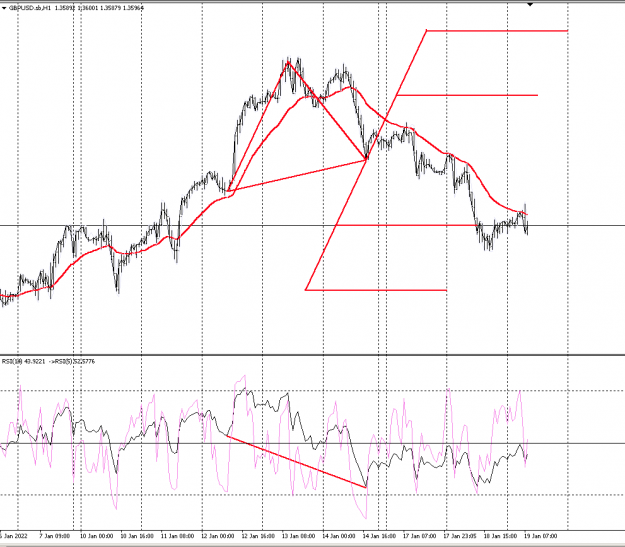
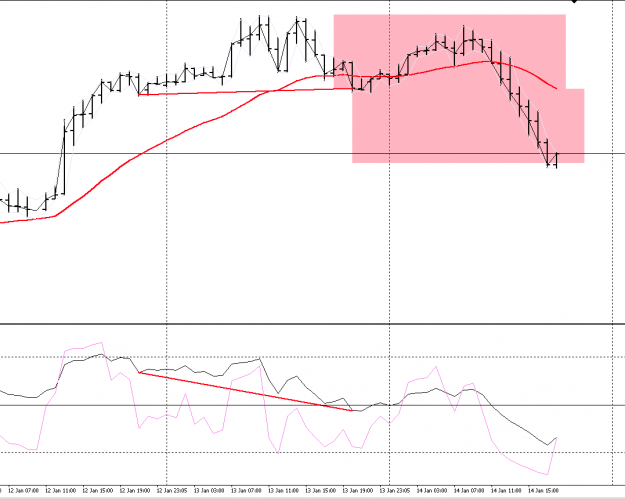
- mayflower replied Jan 17, 2022
Anybody agree with this scenario shown here on the 60m today?
Trading the Cable swings via averages
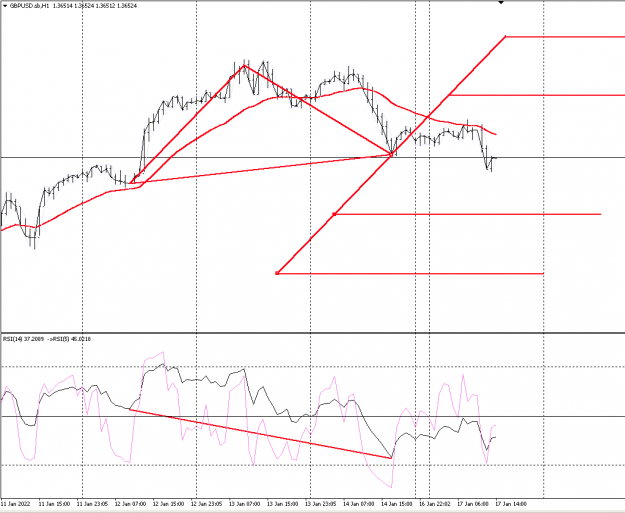
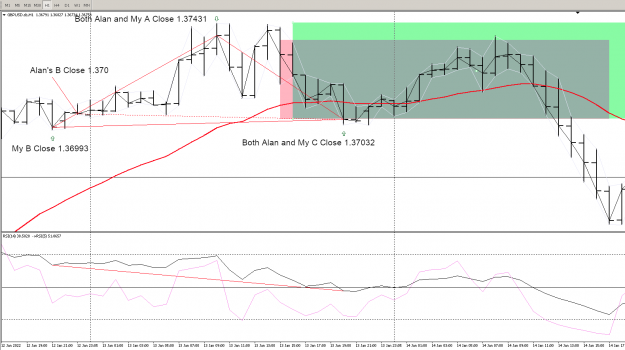
- mayflower replied Jan 16, 2022
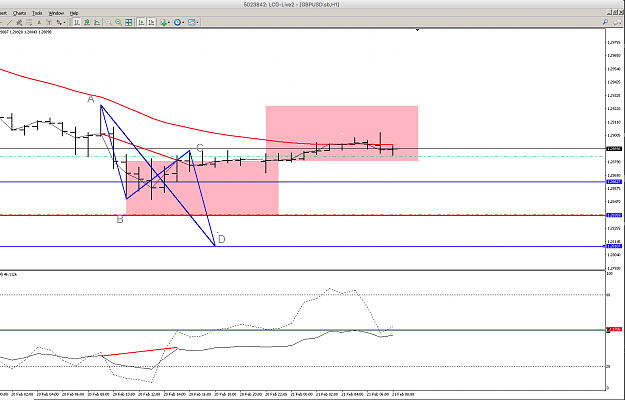
This is in response to Alan's post 7521 and it throws up some interesting anomalies. The A point and the C point are identical on Alan and my charts, however, the B point is different. The problem here is that shows as a pivot on Alan's chart but ...
Trading the Cable swings via averages
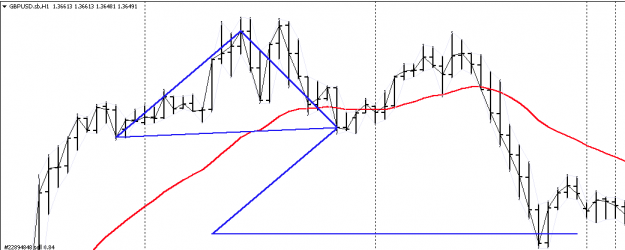
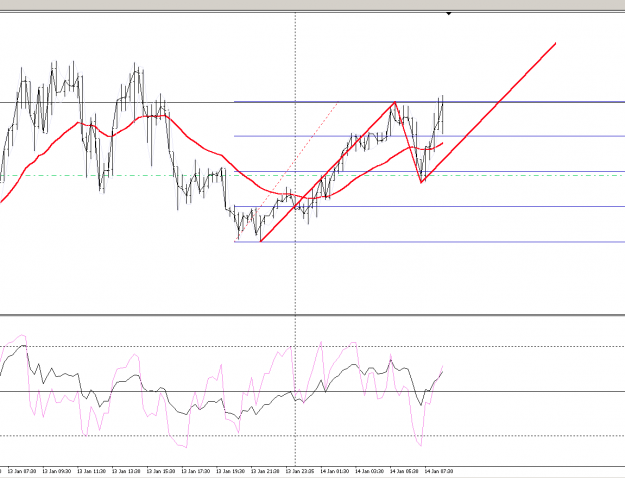
- mayflower replied Jan 14, 2022
There you go Tbyen, not an ABCD swing high but an ABCD swing low hit to the pip. I posted an AB=CD to go long. It almost hit the target but turned south. I was stopped out for +2 pips. I went short and managed to pick up a few pips (but not all) on ...
Trading the Cable swings via averages
- mayflower replied Jan 14, 2022
In fact we now have two potential long targets which now include this AB=CD shown here on the 15m chart.
Trading the Cable swings via averages
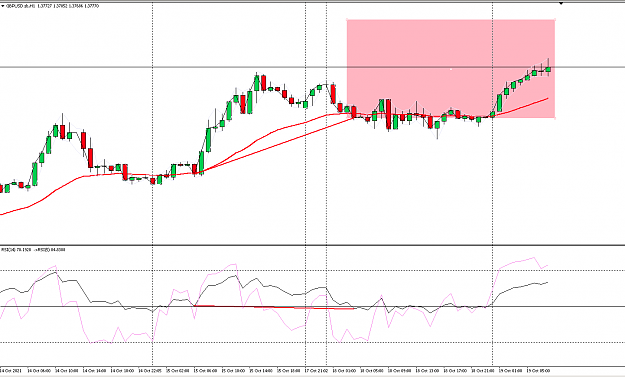
- mayflower replied Dec 9, 2021
Two possible short targets on the 60m, the first one just hit. Will it go on to do the AB=CD?
Trading the Cable swings via averages
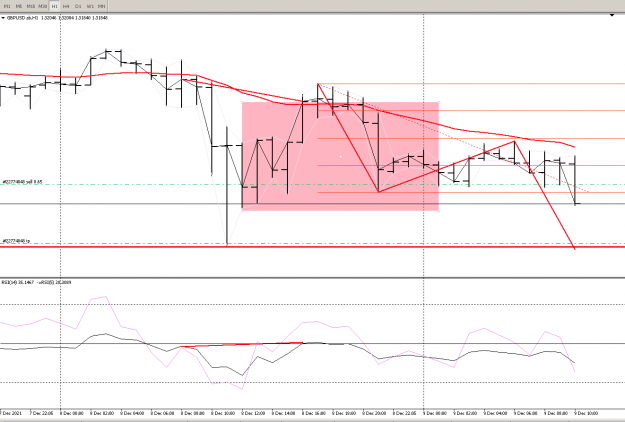
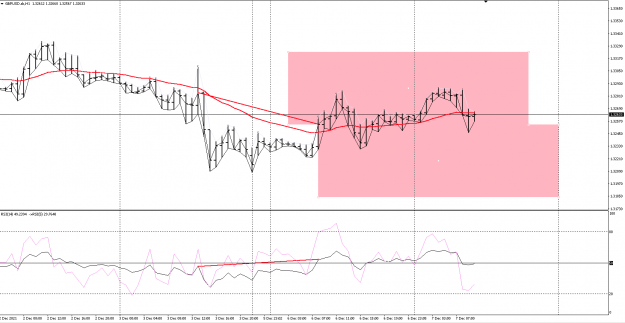
- mayflower replied Dec 7, 2021
Well it made 50% of the move upwards then faltered. Anybodys guess where it might be heading now? image
Trading the Cable swings via averages
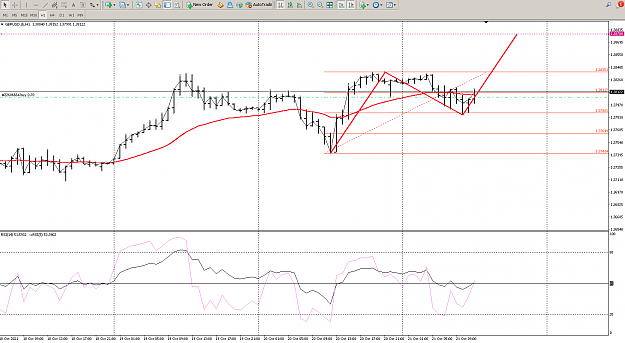
- mayflower replied Oct 19, 2021
I know yesterday was somewhat flat but isn't this a potential target on the 60m?
Trading the Cable swings via averages
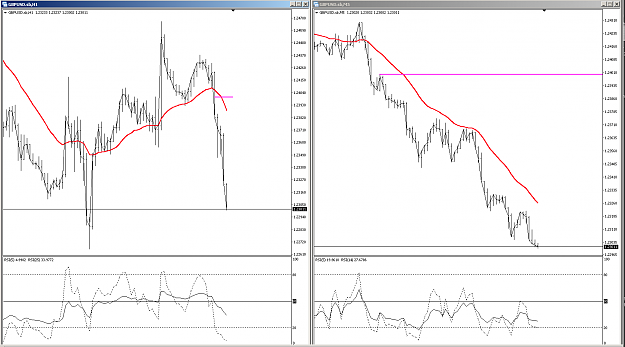
- mayflower replied May 11, 2020
I'm afraid you have missed the boat today Del. With the price crossing the EMA on the 60m you should have turned to your 5m chart and waited for the first pullback (see magenta line on both charts) So far you (and me actually) have missed out on ...
Trading the Cable swings via averages
- mayflower replied Feb 27, 2020
Sorry about the slow response Jazz, I am a bit slow drawing these. I hope this helps.
Trading the Cable swings via averages
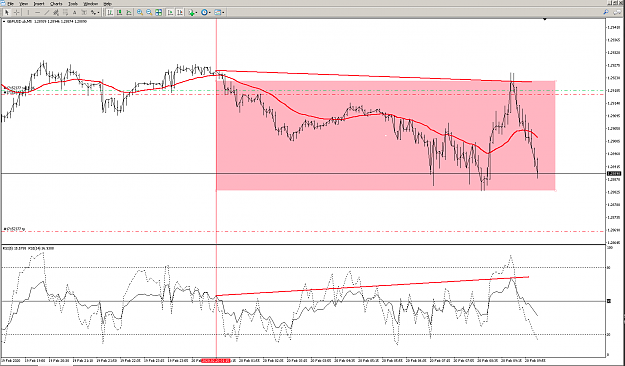
- mayflower replied Feb 27, 2020
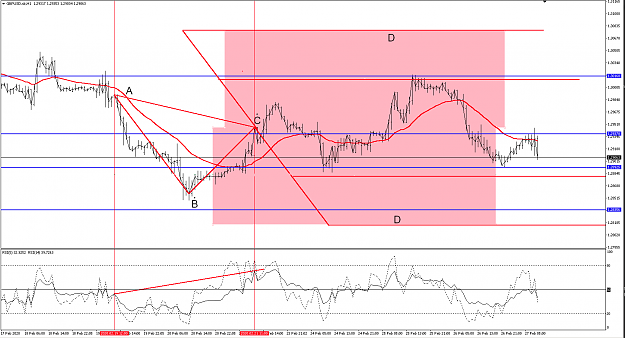
I've been watching this set up over the past few days. It's an ABCD on the 60m. Price rose then dipped to the first EMA low then went up to about 50% of the top red rectangle touching the blue line which is also the next EMA high. Yesterday price ...
Trading the Cable swings via averages
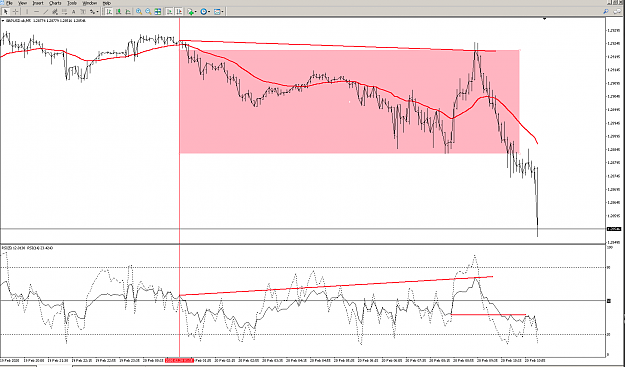
- mayflower replied Feb 21, 2020
So here's my 60m chart with a choice of two methods. It has an AB=CD and also a bearish divergence pattern. It has been long and hit the 50% level so is this a pause and wait situation?
Trading the Cable swings via averages
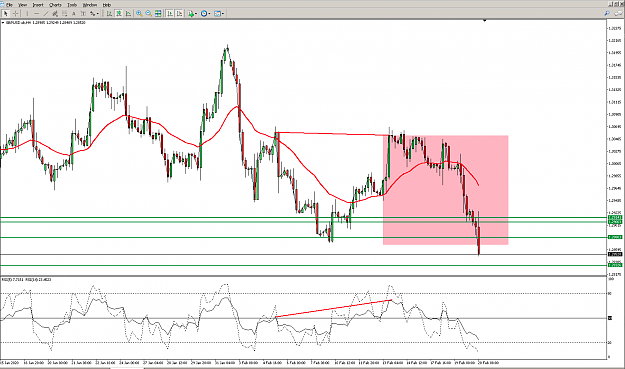
- mayflower replied Feb 20, 2020
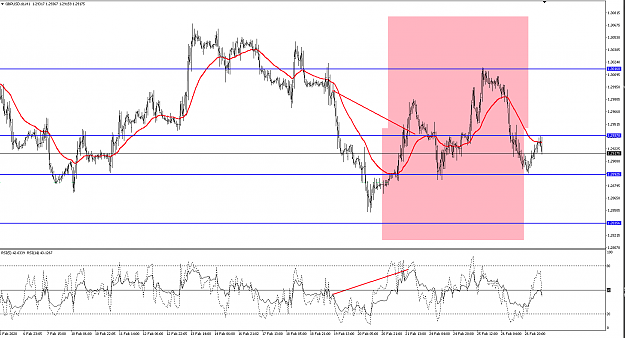
This is as far back as I can go with my 60m chart. Look how the price has reached the next 60m EMA low on the far left of the chart (long blue Horizontal line) and by doing so the price has dragged the EMA down to the next low (short blue horizontal ...
Trading the Cable swings via averages
- mayflower replied Feb 20, 2020
and shot through the 240m target
Trading the Cable swings via averages
- mayflower replied Feb 20, 2020
Wow, that sailed through the 5m target
Trading the Cable swings via averages
- mayflower replied Feb 20, 2020
On it Jazz but the dilemma here is, do I take the potential bull divergence forming on the 5m or stay in for another 14 pips to a similar target on the 240m?
Trading the Cable swings via averages
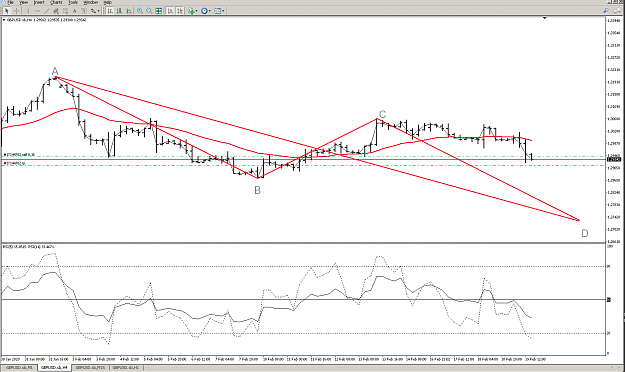
- mayflower replied Feb 19, 2020
Looking well ahead, is this a valid AB=CD on the 240m chart to consider image ?
Trading the Cable swings via averages
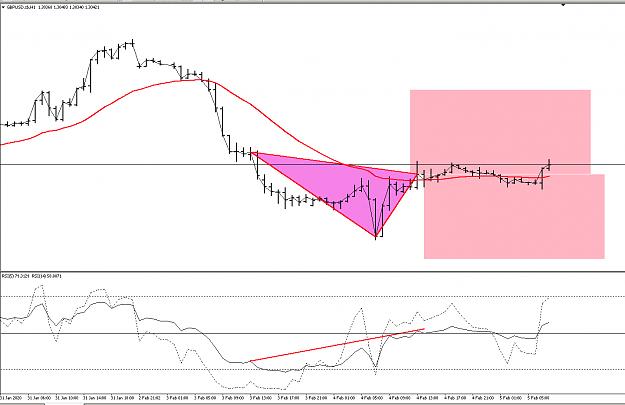
- mayflower replied Feb 5, 2020
Is this a valid current set up on the 60m?
Trading the Cable swings via averages