- Search Forex Factory
- 650 Results
- mzvega replied Nov 21, 2018
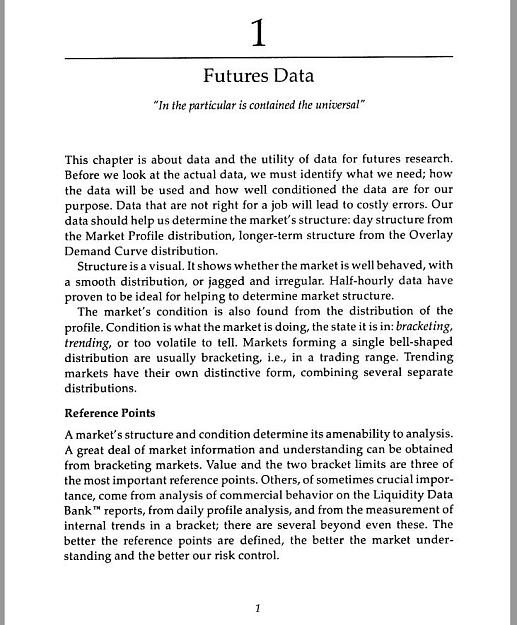
Can you be a little more specific……….can you post the actual page……..or the sentence you read, that said, or talked about "this being used for spot instead of futures" Please do, as no such statement exists on page 1……….in the "preface".......or in ...
Auction Market Value Theory & Analytics
- mzvega replied Sep 25, 2018
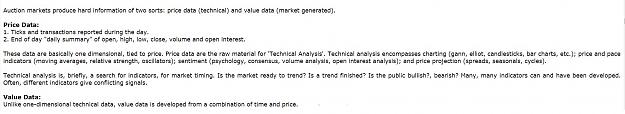
Being that "Price Data" (Price Action as you call it) is the raw material for "technical Analysis" and this thread deals in "Quantitative Analysis" We don't give a shit about a "price action" (series of prices) Because Most technical analysis works ...
Auction Market Value Theory & Analytics
- mzvega replied Sep 25, 2018
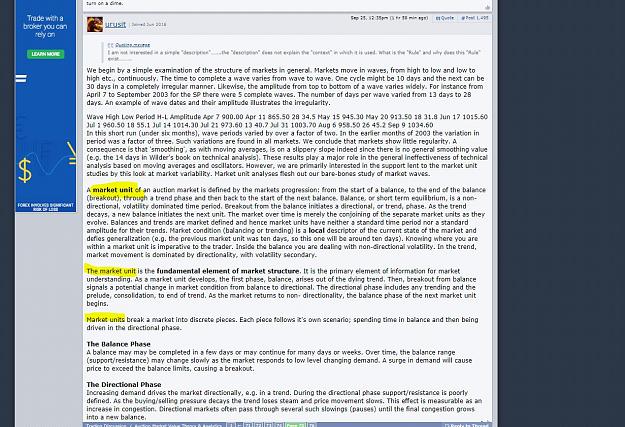
Again, we are talking about MARKET UNITS..............you left out the "Context" of the post....................
Auction Market Value Theory & Analytics
- mzvega replied Sep 25, 2018
We are not talking about "price waves"........we are talking about "Market Units" and "Balances" Market Waves are NOT Cycles Donald L. Jones Copyright CISCO Futures March 25, 2005 A hope of many technical analysts is that markets have a cyclic ...
Auction Market Value Theory & Analytics
- mzvega replied Sep 18, 2018
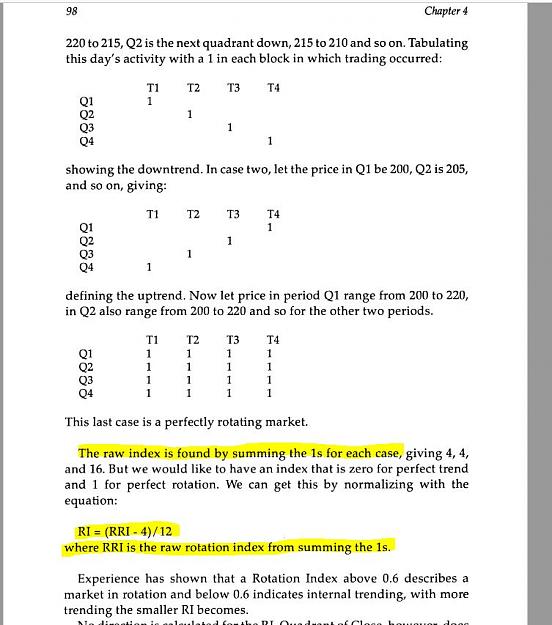
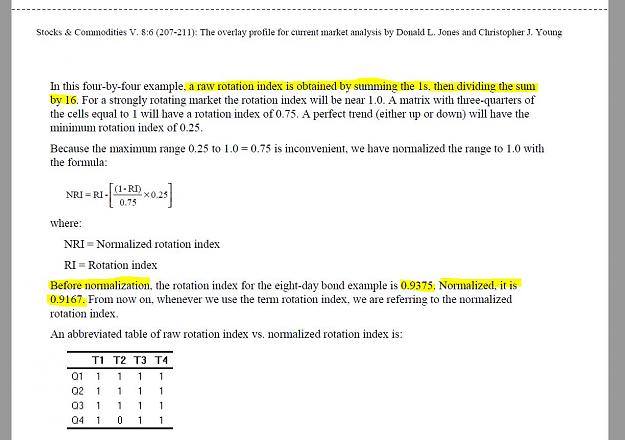
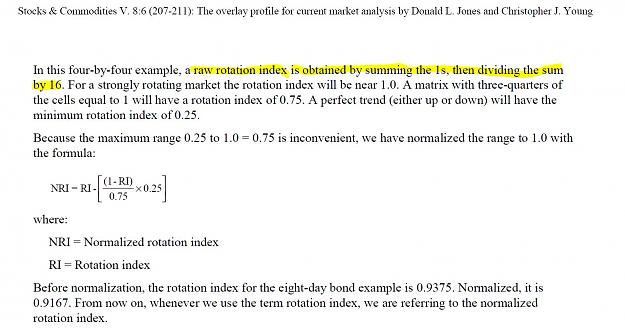
Let me clarify............I use the method of "normalization" you see in the article below........ If you "normalize" this way......in this case you divide by 16.......... RI= 15/16= .9375 RI = (15/16)= 0.9375 (before normalization) NRI = RI - (1- ...
Auction Market Value Theory & Analytics
- mzvega replied Sep 18, 2018
image the more detailed version....... image a Raw Rotation Index (RRI) is obtained by summing the 1s, then dividing the sum by 16) Both show different ways to "normalize" the same RRI result....... But the RRI is obtained the same way by ...
Auction Market Value Theory & Analytics
- mzvega replied Aug 19, 2018
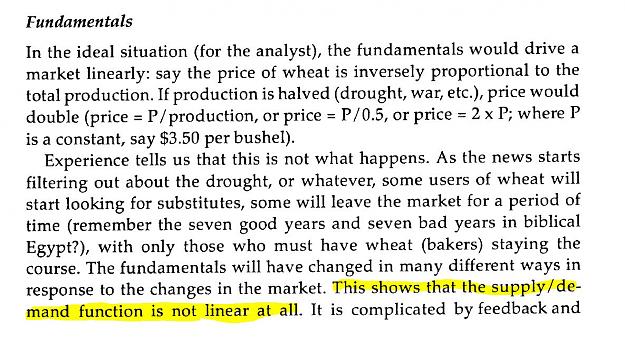
It depends on your perspective………………….to those who understand the basic "Laws of Supply and Demand" it's just MYTH, it only becomes a trap for those who think in straight lines…….. If you foolishly believe : Price rises due to an increase in demand ...
The Equilibrium, a key to success!
- mzvega replied Aug 4, 2018
Pasted from < url > And you posted……. image You already have the lessons……….. And there is no "Daily Market Data" to download anymore. So a password is unnecessary.
Auction Market Value Theory & Analytics
- mzvega replied Jul 15, 2018
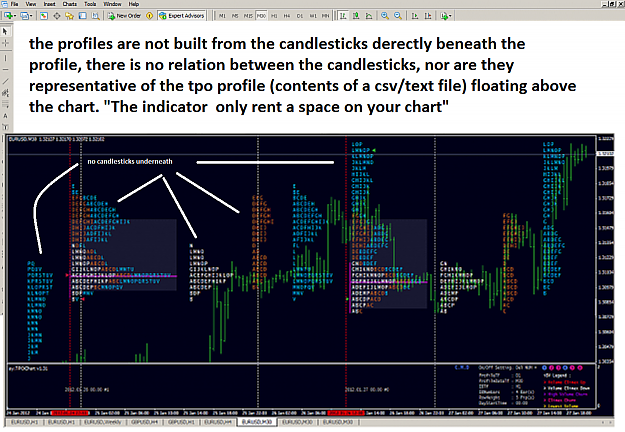
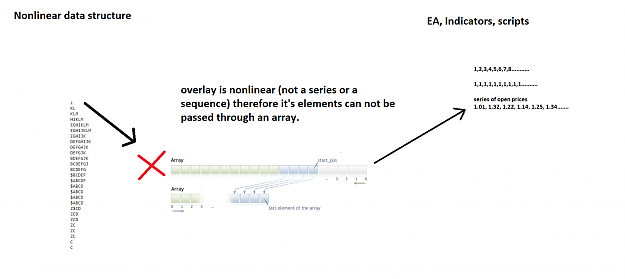
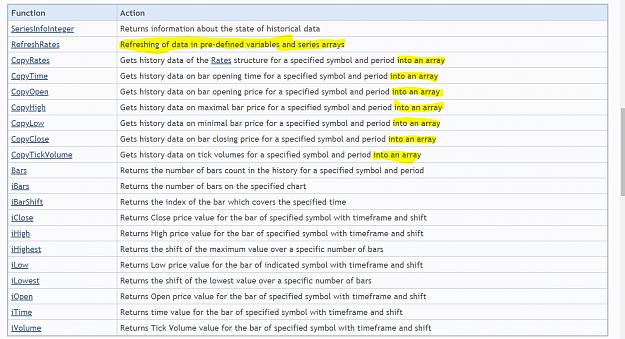
What Bandung did was use a different programming language from within mql4 to recast price and time data into a "market generated format" and "references" and placed the data into csv/text files. The data is still nonlinear (not a series or ...
Auction Market Value Theory & Analytics
- mzvega replied Jul 14, 2018
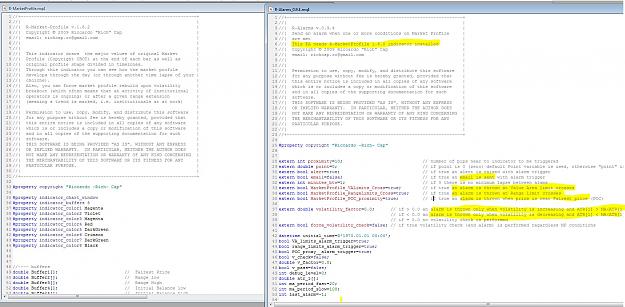
I posted the R-profile indicator to FF over seven years ago, open source/free of charge. url I stopped using it because if you read the code it does don’t calculate tpo's required for MP analysis and too CPU intensive as it would freeze the mql4 ...
Auction Market Value Theory & Analytics Expert Advisor
- mzvega replied Jul 14, 2018
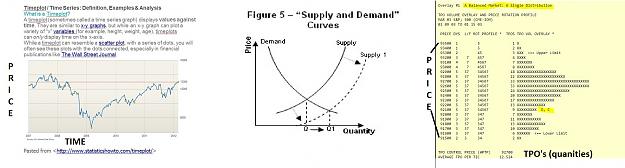
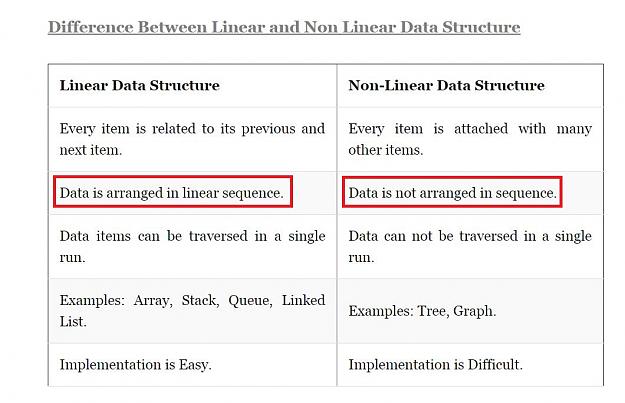
An overlay Demand Curve is a Demand Curve It has price on the vertical and quantities on the horizontal. It is a Non linear data structure, incompatible with a price chart image Mql4 is a linear Environment Receiving Price Data in Indicators & ...
Auction Market Value Theory & Analytics
- mzvega replied Jul 6, 2018
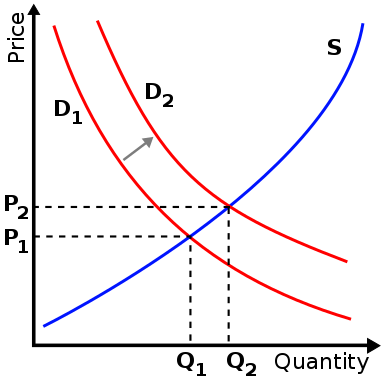
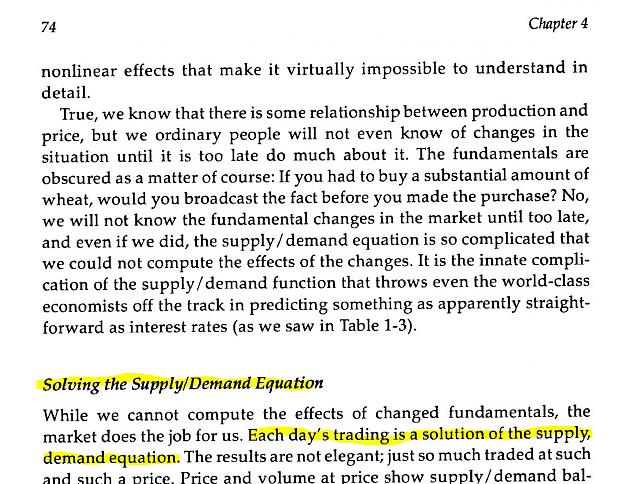
Supply and demand and equilibrium price are all NONLINEAR FUNCTIONS of price………………. The solution to Supply and Demand is given by a nonlinear equation……………………. We know it's nonlinear function, because it's data plots a CURVE…………………………….. NONLINEAR ...
Auction Market Value Theory & Analytics


- mzvega replied Jul 6, 2018
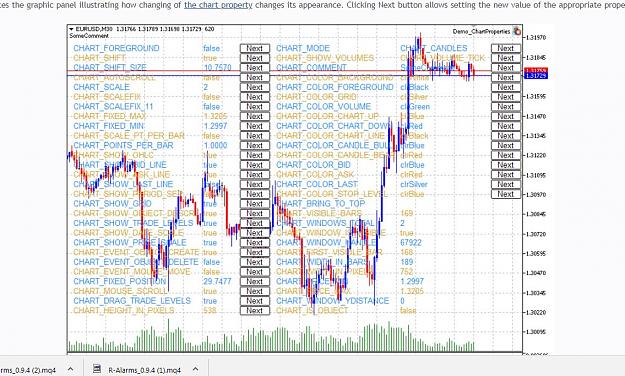
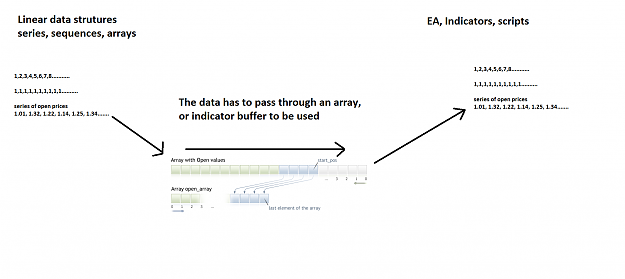
MQL4/5 is a LINEAR Environment From it's linear data (timeseries)………. To it's LINEAR functions, passing data through arrays to custom indicators,EA's.Scripts) It's not rocket science, 6th grade math tells us that the solution to a linear equation ...
Auction Market Value Theory & Analytics
- mzvega replied Jul 6, 2018
I am going to explain in a series of posts why no one is going to make an EA out of AMVT concepts............. First a basic understanding of what I mean when I say LINEAR or NONLINEAR, so there is no confusions, or misinterpretations What is a ...
Auction Market Value Theory & Analytics
- mzvega replied Jul 2, 2018
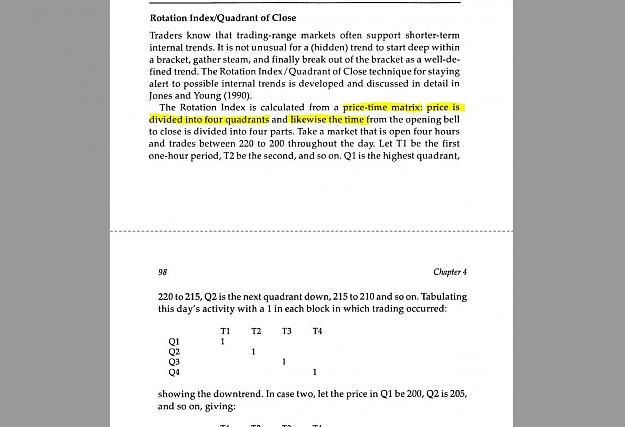
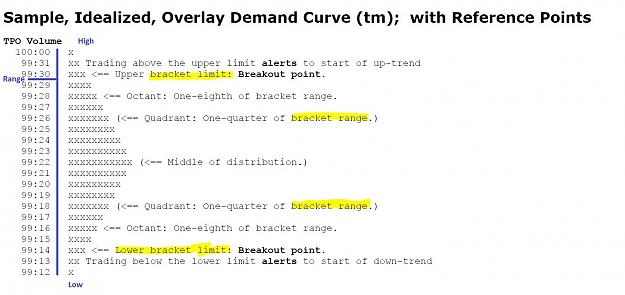
In the "context" of an Overlay Demand Curve description that is the proper definition of "quadrant".
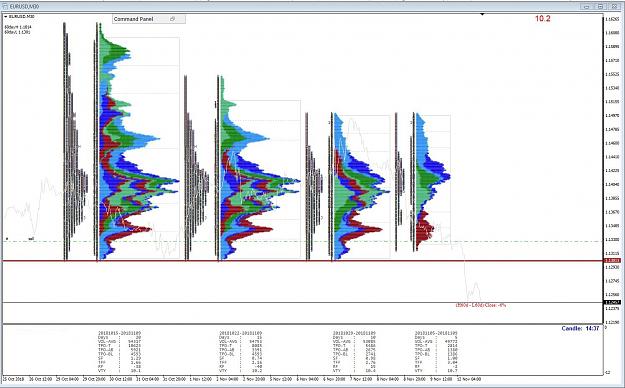
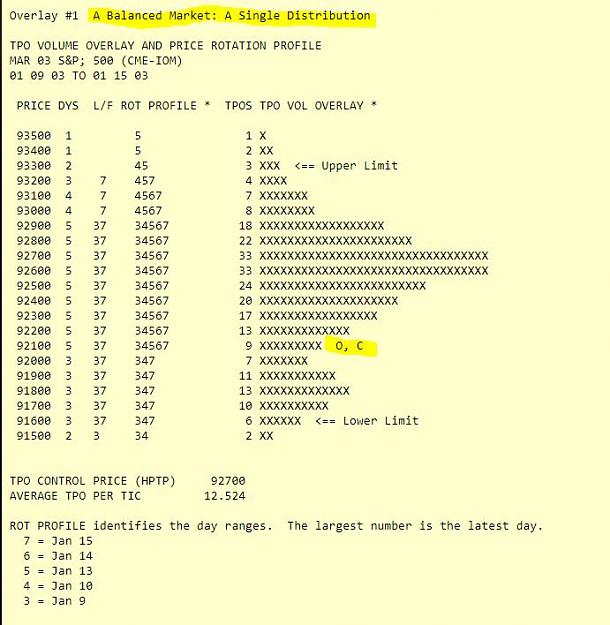
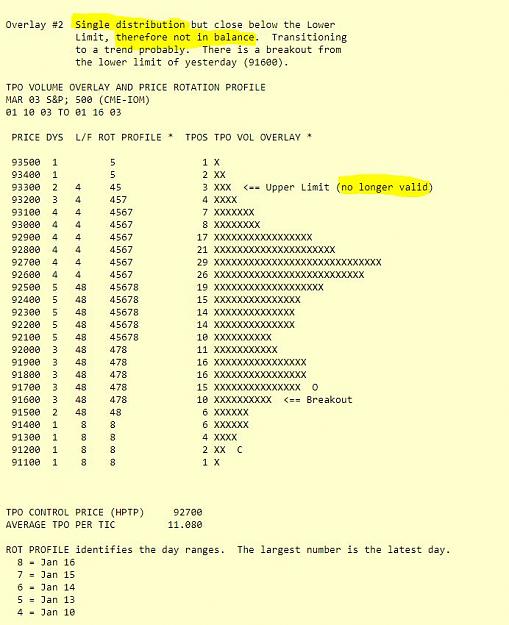
Auction Market Value Theory & Analytics A single distribution between 3-5 tpo's (depending on the sample size) and a close located in the bracket limits (in a quadrant) defines a ...
- mzvega replied Jul 1, 2018
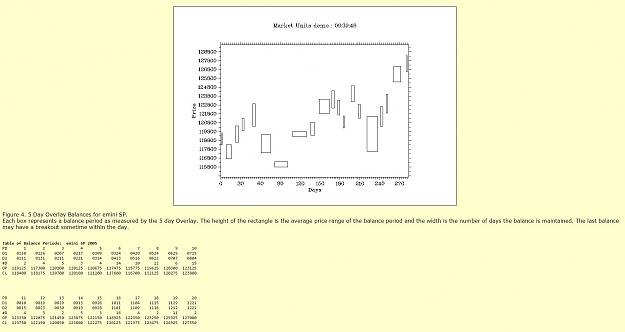
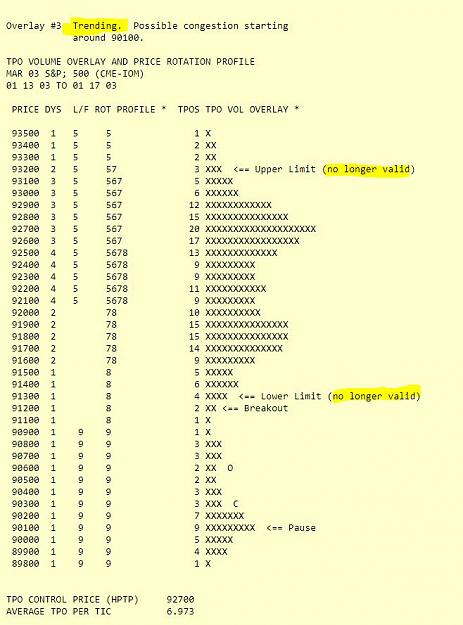
That's because The image you call page 1 comes from vbpt p. 97-98 image and the image you call page 2 comes from an article posted to the thread. image They are not a page 1 and 2 from the same resource 2 different sources, 2 different examples, ...
Auction Market Value Theory & Analytics
- mzvega replied Jul 1, 2018
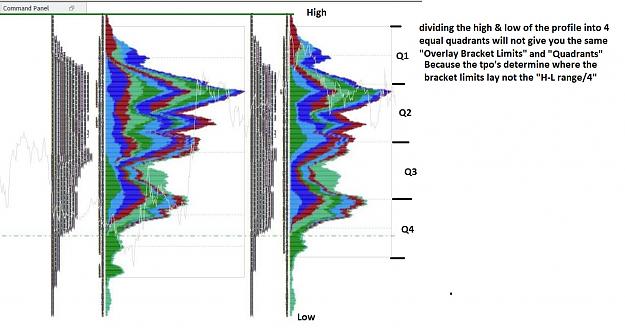
I apologize for my confusion, your were not being very specific about what "H-L Range" you are referring to…….. I see that you subscribe to the notion that an overlay demand curve is a "Channel" of prices. If you believe that to be true then you ...
Auction Market Value Theory & Analytics
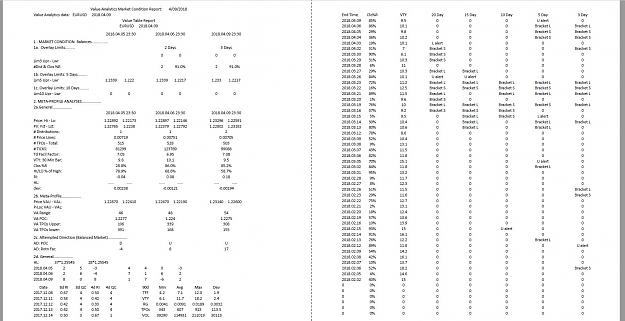
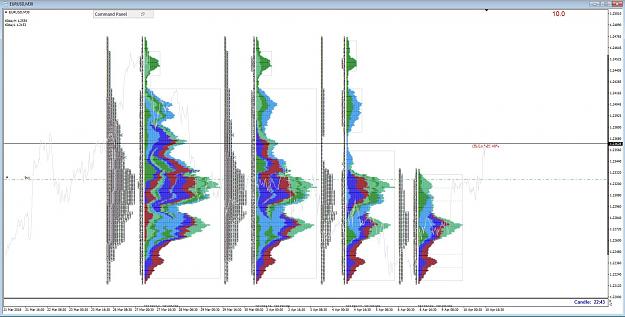
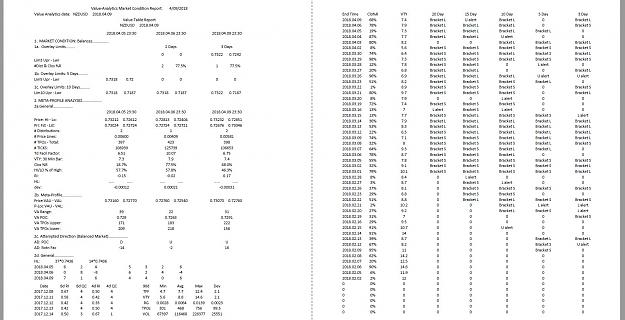
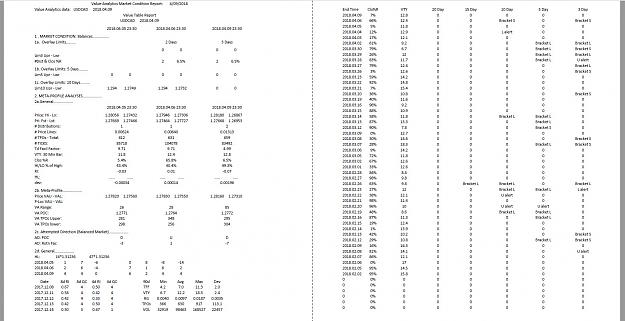
- mzvega replied Apr 10, 2018
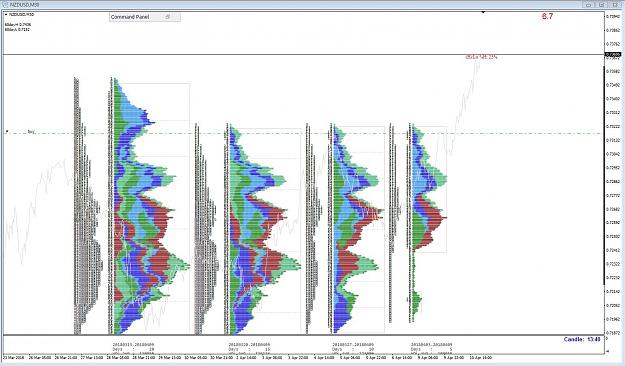
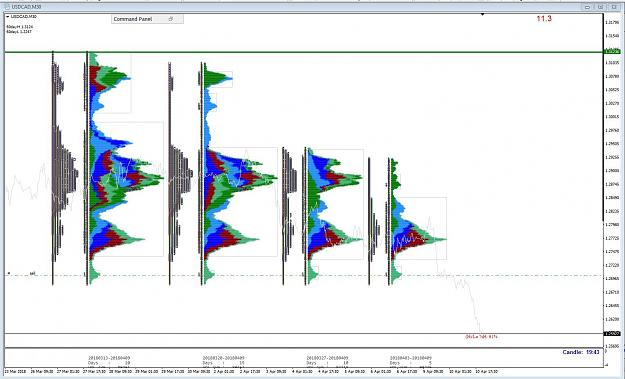
eurusd image image nzdusd (updated) image image usdcad (updated) image image
Auction Market Value Theory & Analytics