- Search Forex Factory
- 13 Results
-
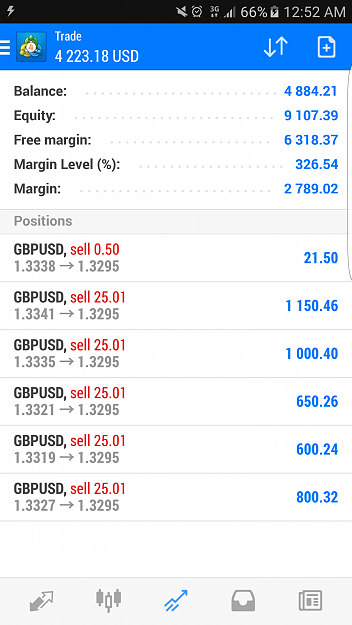
 nafham replied Sep 2, 2016
Almost double up my capital. Will keep watching it till the reversal sign developed.
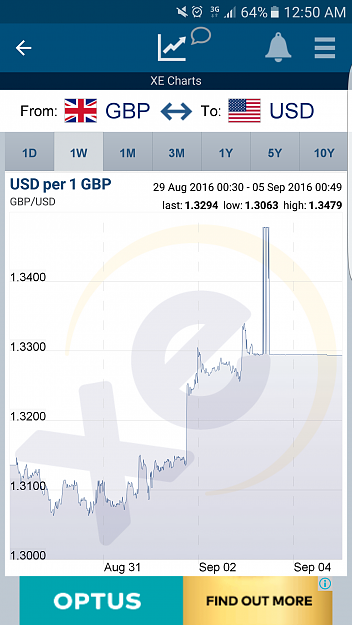
Cable Update (GBPUSD)
- nafham replied Aug 25, 2016
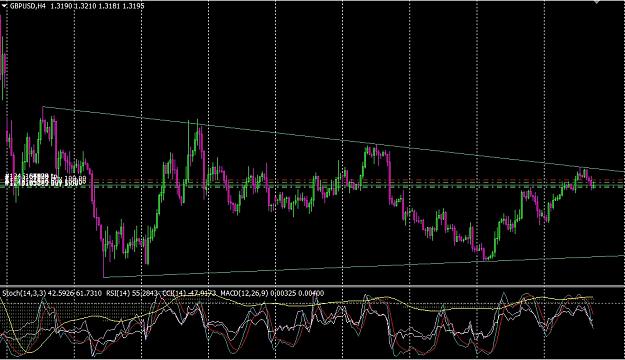
yeah. in the H4 graph shown that she been knocked her head 4 times since BREXIT. She telling me that the next one she could break it through. Seem like tomox is the biggest day of the month. Either spike or dive.
Cable Update (GBPUSD)
- nafham replied Aug 25, 2016
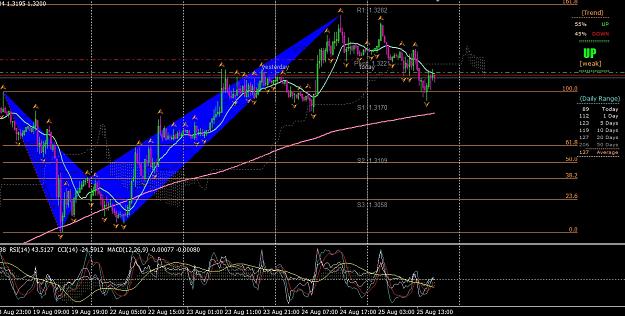
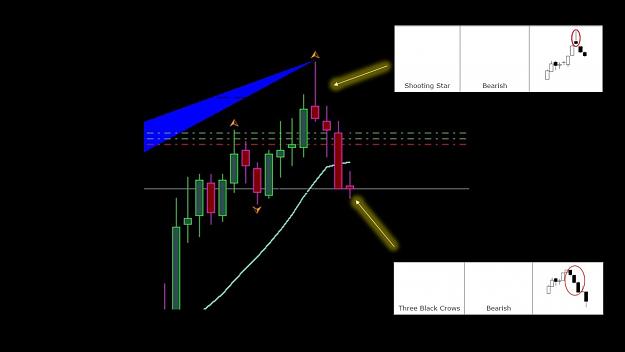
Yeah the graph did falling off after bearish crab sign confirmed by double top. Then she landed at 100 fibo that created bearish crab sign. By theory, the graph should diving down after good news from USD however seem like she just cant be bother ...
Cable Update (GBPUSD)
- nafham replied Aug 24, 2016
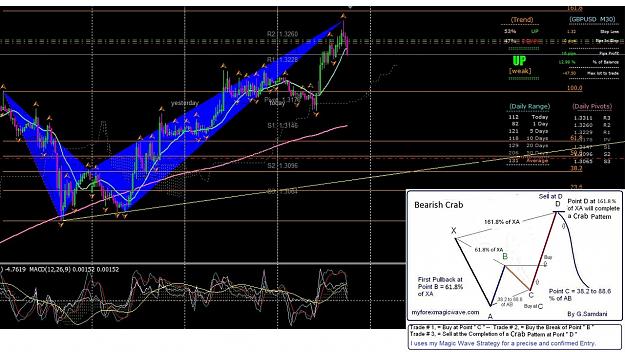
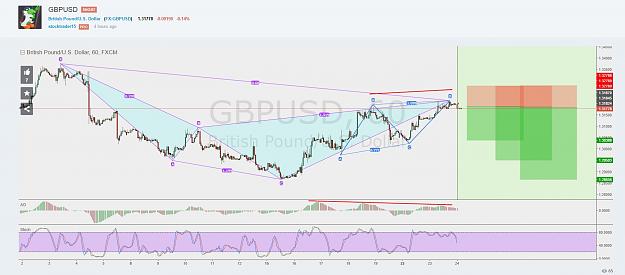
Perhaps this is the correct bearish crab. The earlier post was too early. I should realised that the top tip should reach ~161.8
Cable Update (GBPUSD)
- nafham replied Aug 24, 2016
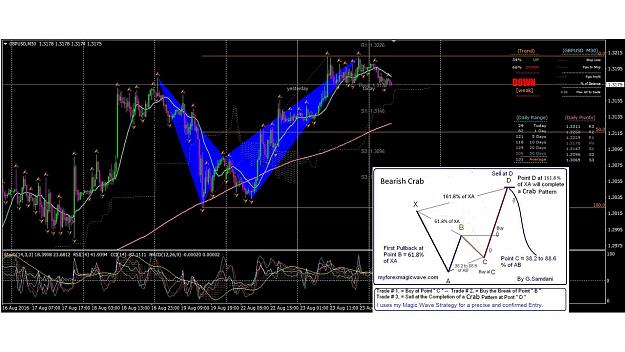
If anyone ever noticed, the bearish crab pattern just completed. I attached in the photo what bearish crab pattern is to those who doesn't know about this pattern. The graph already broke the stubborn support 1380 and next support is last week's ...
Cable Update (GBPUSD)
- nafham replied Aug 23, 2016
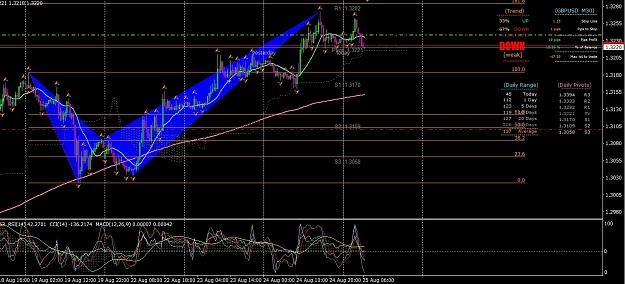
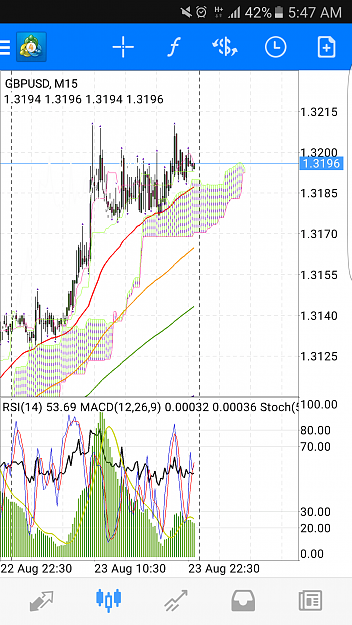
Seem like its beautifully created double top here. With strong divergence signs shown, the graph might falling down tomox. Just need keep on eyes on stubborn support at 1375-1385.
Cable Update (GBPUSD)
- nafham replied Aug 21, 2016
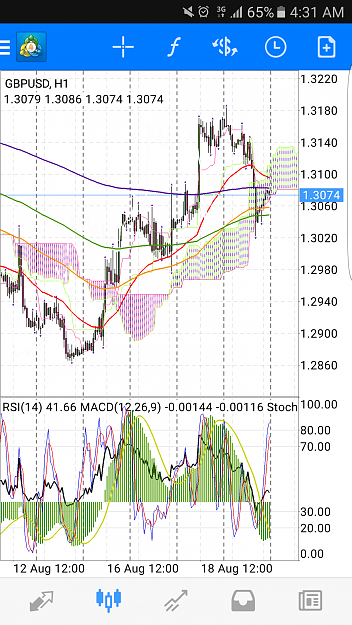
From what I have on my graph, seem like she been dancing at the bottom of the ichimoku cloud which is known as a support in chart H1. Based on my experience, the longer she dance on the line, the weaker cloud become. Plus with Stoch almost making a ...
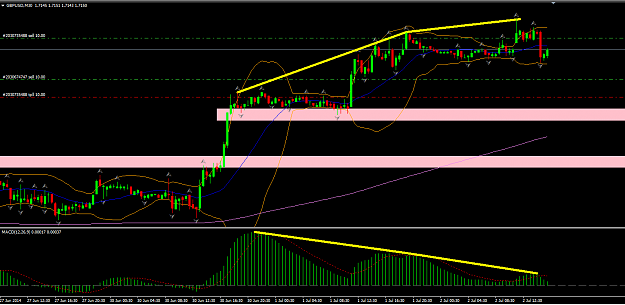
Cable Update (GBPUSD)
- nafham replied Jul 2, 2014
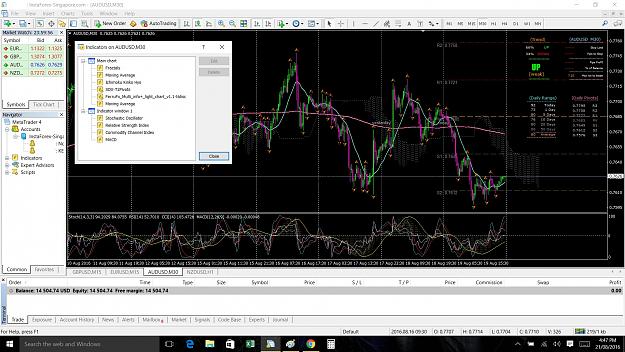
MACD for chart M30 & H1 give double divergence signs.
Cable Update (GBPUSD)
- Posts by Member Search: 'nafham'