- Search Forex Factory
- 440 Results (1 Thread , 439 Replies )
-
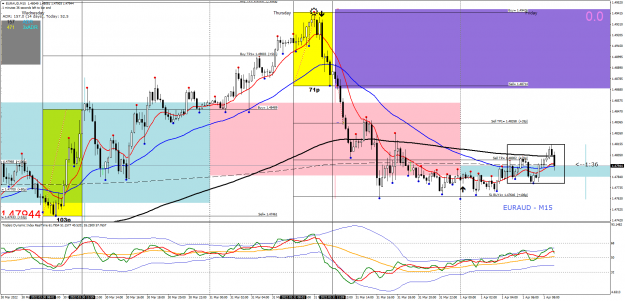
 ozziedave replied Apr 1, 2022
Here is a trade I had yesterday. Took 35 pips at TP 1 = 1/0.5 R/R. The R/R isn't great but I have reviewed trade after trade and if you get the direction right you win about 9/10 trades.
Trade Outside the Box (TOTB)
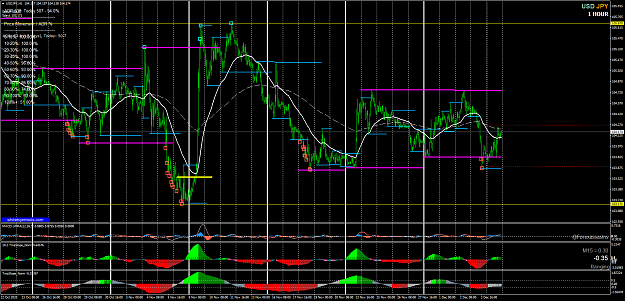
- ozziedave replied Dec 5, 2020
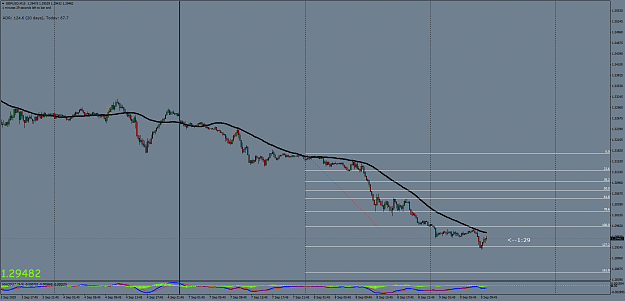
Hi Jarass Your yellow lines are 5 day ADR lines, I am assuming they adjust each day based on the past 5 days? When they adjust do you see much of a difference on the location of the line? For example, on the attached chart it appears these lines ...
Daily Trading Strategy [ADR + RSI = High Probability]
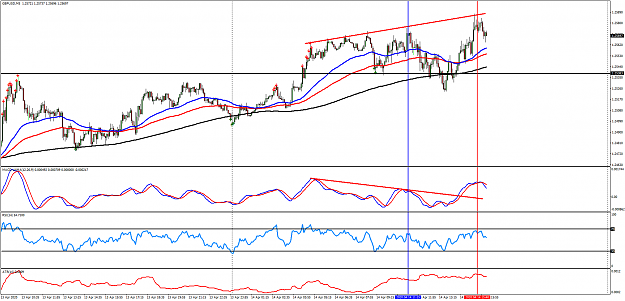
- ozziedave replied Sep 1, 2020
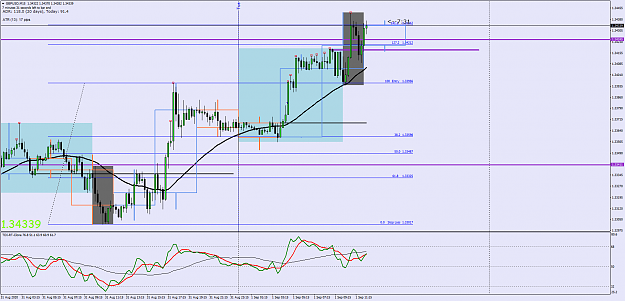
GU made it to the 141% fib today, would have been a real nice trade if you could have gotten in around the 38% retracement and held on into the London open.
PA based LTG
- ozziedave replied Sep 1, 2020
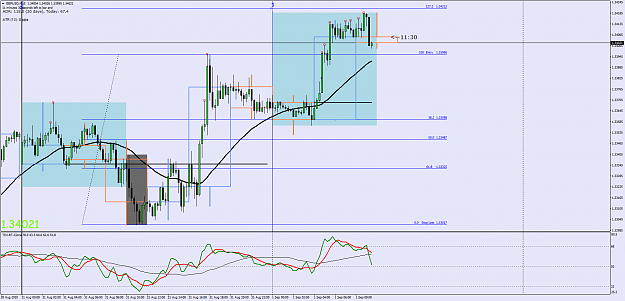
Here's a retracement early today and then a push up to reach the 127 fib. I missed the double/triple bottom at the 38% fib so a late entry for me but a safe trade. Didn't have time to monitor the trade so closed out early with a nice profit. But as ...
PA based LTG
- ozziedave replied May 9, 2020
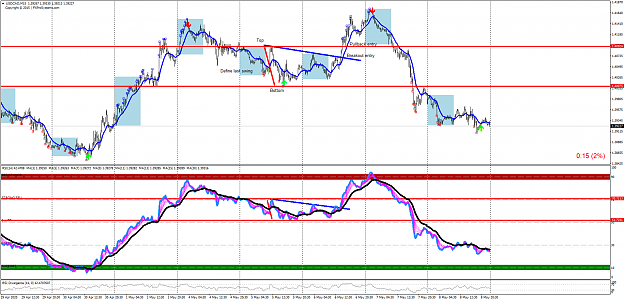
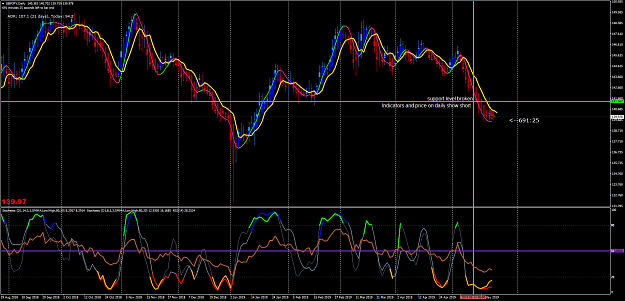
I've been looking at the bottom indicator, which are a combination of MAs, and it's a really interesting depiction of price movement. That indactor may be useful even if the arrows repaint. Here is an example, Define the last swing on your charts ...
Payapa Trading System - Modified Ali's Version
- ozziedave replied Apr 14, 2020
Hi... Have a question about divergence. On the chart below there is divergence between the far left red arrows and the blue line. Do you consider that the divergence has completed at the low right after the blue line or do you still consider price ...
Forex Scalping Strategy - Full Video Course
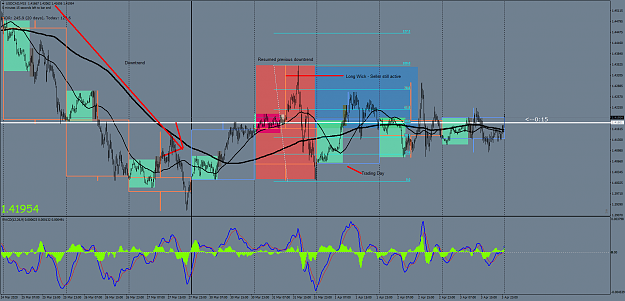
- ozziedave replied Apr 4, 2020
Like everything in FX it all depends on how experienced you are at trading. I put the 50% mark out there to keep newbies on the right side of the trade. In the example below you see a downtrend and a pullback on 30/2020 and then on 31/3/2020 the ...
5M Quarantine
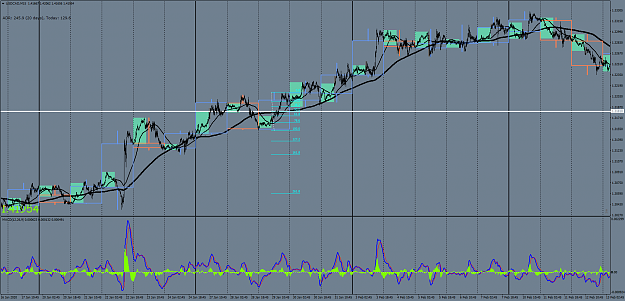
- ozziedave replied Apr 4, 2020
Just another indication of daily basis and staying on the right side of the trade is looking at the daily candle as FXQB states and then marking the 50% of the candle. If I have an up candle I like to see price trade above the 50% mark, if it goes ...
5M Quarantine
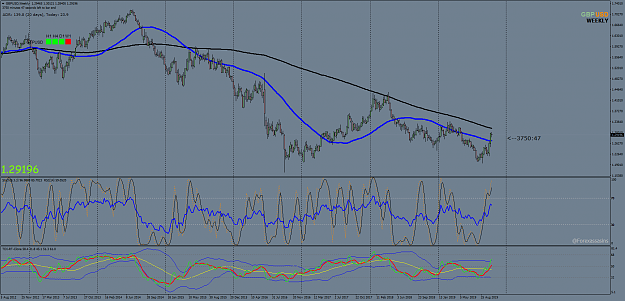
- ozziedave replied Oct 24, 2019
Why I am getting a weekly bearish candle showing on the indicator when the last closed weekly candle closed bullish. Has anyone else noticed this? The active candle is slightly bearish but I thought the indy looked at the last closed candle. So a ...
Follow the Candles
- ozziedave replied Oct 19, 2019
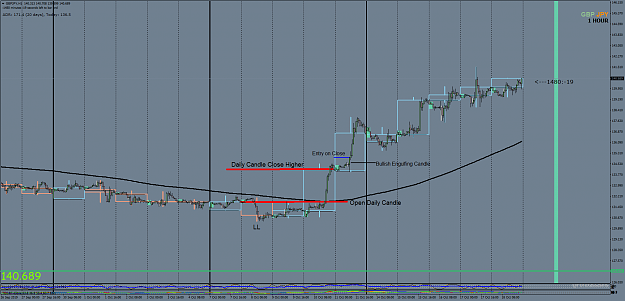
Even on days you don't have a 123 swing point you can use this methodology for entries. The day has closed as a higher high, candle between red lines. So on the next day we are looking for long entries. Patience is key here. I have identified 2 ...
Open Price and Engulfing Bars
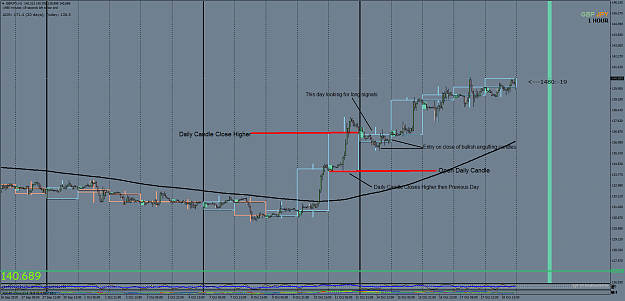
- ozziedave replied Oct 19, 2019
Here is an example of how I am using the daily candle overlay on a 1hr chart to enter with engulfing candles.
Open Price and Engulfing Bars
- ozziedave replied May 22, 2019
Just my 2 cents on the trade set up. Even though your mechanics may have been sound on the 4 hr chart you may want to check the next higher up time frame before you pull the trigger. Look at the daily chart and you will see the last support level ...
Trading Made Simple(r)
- ozziedave replied Feb 14, 2019
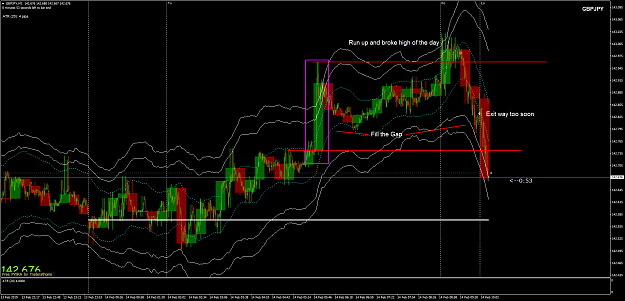
Run up during the Europe open above the high of the day and then reverse to fill the gap. Got out way too soon!
Price action at the core / tma intra day
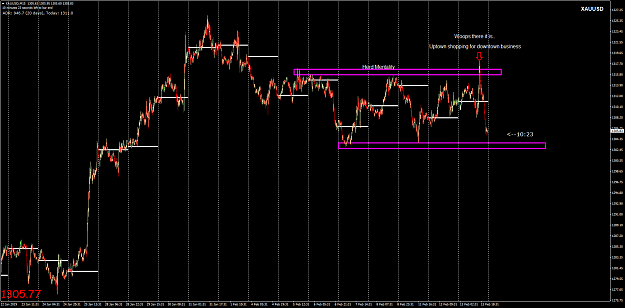
- ozziedave replied Feb 13, 2019
I don't trade Gold ....but .this is a perfect example of Uptown shopping for downtown business!
Price action at the core / tma intra day
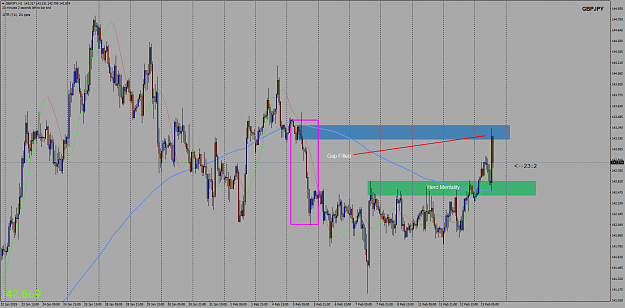
- ozziedave replied Feb 13, 2019
Retrace into the heard and then the gap was filled on the GJ.
Price action at the core / tma intra day
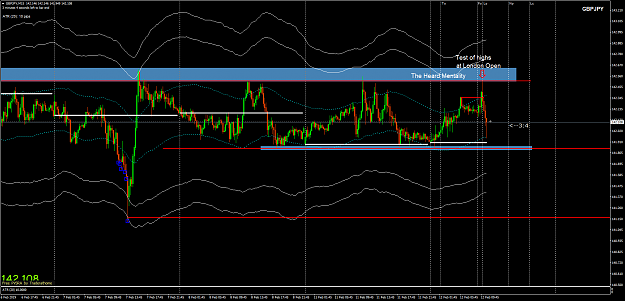
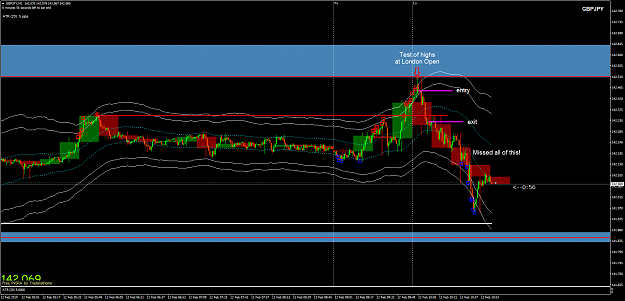
- ozziedave replied Feb 12, 2019
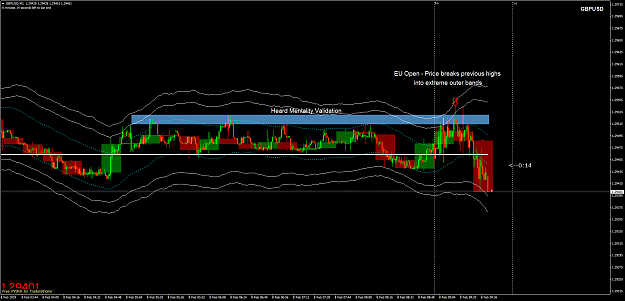
Again..Thanks to George for the heads up on this pair! GJ tests the previous highs at the London open, 15M chart. Drop down to 1M chart and price is testing the highs of the TMA band and I make the entry just off of the highs. Price breaks down but ...
Price action at the core / tma intra day
- ozziedave replied Feb 8, 2019
Caught this short trade today...Price breaks to new high at extreme bands and reverses. Also noted a 15 pip daily range with 141 average over last 20 days so room for price expansion.
Price action at the core / tma intra day
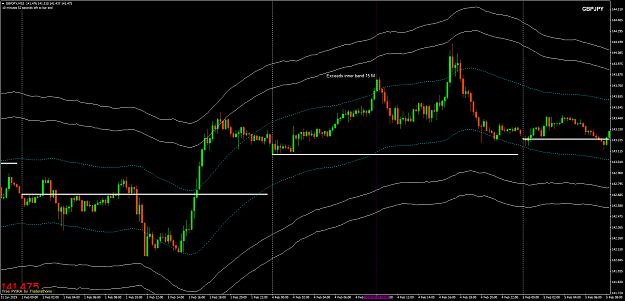
- ozziedave replied Feb 7, 2019
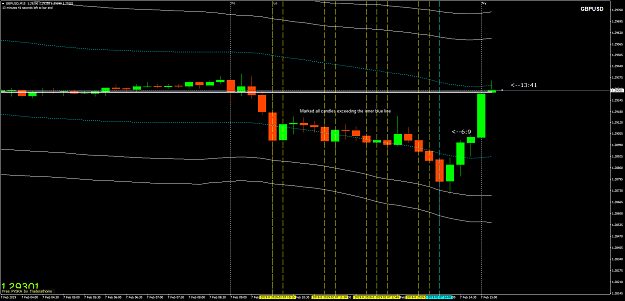
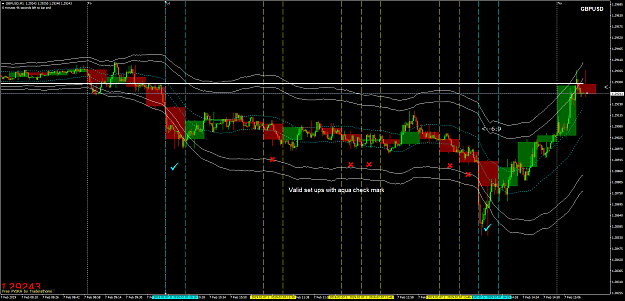
Here is my idea for a filter. See all of the candles on the 15M chart that have exceeded the inner blue band. How do we know which candle is a valid set up and which one to ignore. To validate the set up change to the 1M chart to see if price ...
Price action at the core / tma intra day
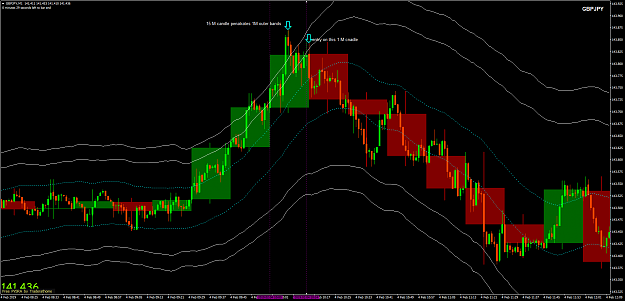
- ozziedave replied Feb 7, 2019
Nice GJ trade George... I have been observing the interaction of the bands and price on the 15M and 1M charts and I would like to share my observations if I may. On the first chart the 15M candle penetrates the inner blue band. When this happens I ...
Price action at the core / tma intra day