- Search Forex Factory
- 110 Results
- roundrock replied May 2, 2011
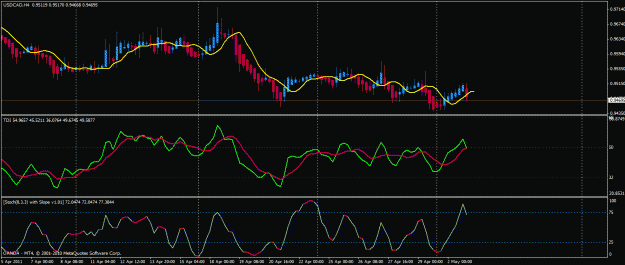
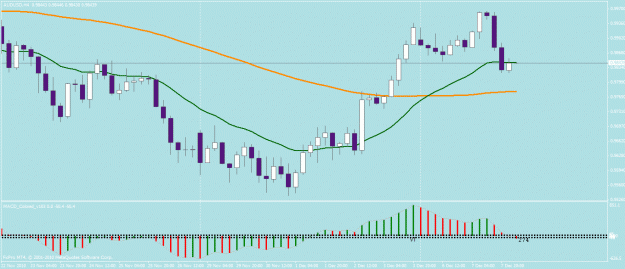
USDCAD H4 Short ??? — assuming the current candle closes with green crossing down red, do you go short ? pro : as per trend, stoch in agreement, tdi angle good cons : looks like a ranging market. support is near, so target will be less
Trading Made Simple
- roundrock replied May 2, 2011
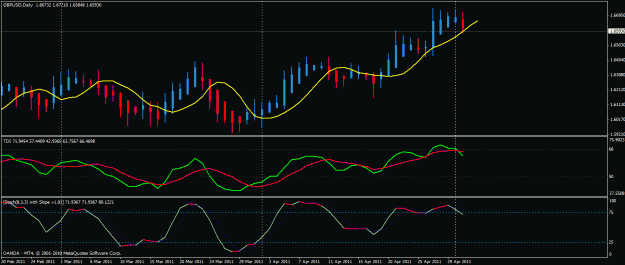
GU D1 Chart — short entered just now. TDI green crossing down from 68 levels, stoch also in agreement. stoploss is high of those prev 3 candles. only concern is its against the trend. since its D1, i am ready for ups and downs
Trading Made Simple
- roundrock replied Jan 28, 2011
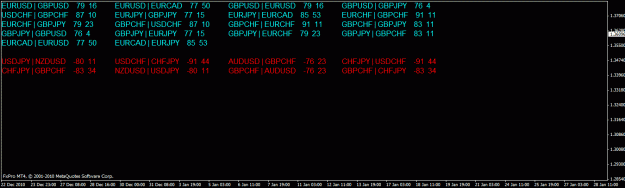
open any chart any timeframe. load the template posted by scott for corelation table. open indicators, remove the existing indicator and add this new indicator. thats all !!! here is a screenshot. first number is corelation factor and second is ...
Hedge and Correlation Strategy
- roundrock replied Dec 22, 2010
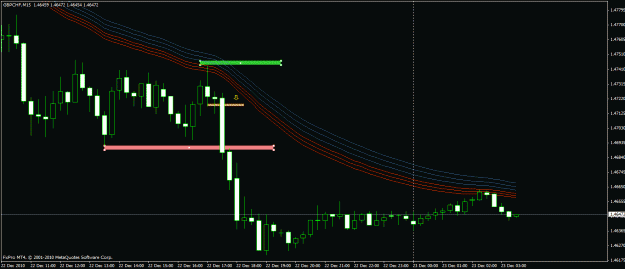
GBPCHF Short — this came at fag end of US session
Urban Towers Scalping Strategy
- roundrock replied Dec 8, 2010
AUDUSD Long — in my chart its a clear long entry as per rules SBH, Can you clarify how many candles we wait between price retracing past 21 EMA and our entry. in this case 6 candles. also retracing deep into 89EMA is a bad thing ? it did close ...
4H Crossover (Swing Trading)
- roundrock replied Dec 7, 2010
AUDUSD ready for long — EMA c/o happened , price pulled back to touch 21 EMA, now started going up in long direction. if the current bar closes above 21 EMA and MACD turns green, we can enter LONG Is that true ? thanks a lot for the great video
4H Crossover (Swing Trading)
- roundrock replied Oct 30, 2010
GBPAUD Weekly BUOB — nice shape, nice location. but straight into FTA area. so pass for me
james16 Chart Thread
- roundrock replied Oct 30, 2010
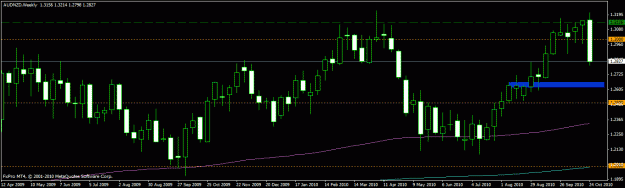
AUDNZD Weekly BEOB — this engulfs many bars. location is good. FTA is marked. since it moved so far from high, i will wait for a retracement for entry
james16 Chart Thread
- roundrock replied Oct 30, 2010
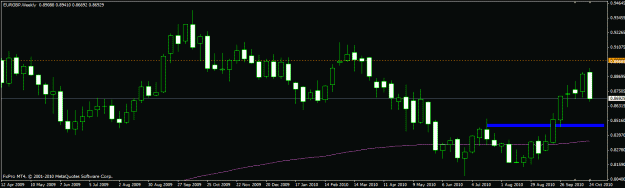
EURGBP Weekly BEOB — nice location, nice shape. FTA is marked.
james16 Chart Thread
- roundrock replied Oct 18, 2010
yes theres divergence on macd. i agree the pin bar is tiny compared to the prev bars
2b pattern
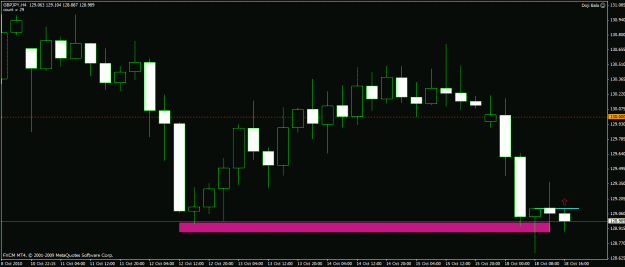
- roundrock replied Oct 18, 2010
GBPJPY H4 Long setup — entered on break of the pin to the upside. marked as blue rectangle. right now in loss, it just missed the 61 etxn by 2 pips
2b pattern
- roundrock replied Oct 10, 2010
UJ H4 Pin — nice location and nice shape, close above RN 82. FTA at 82.57 any comments ?
james16 Chart Thread
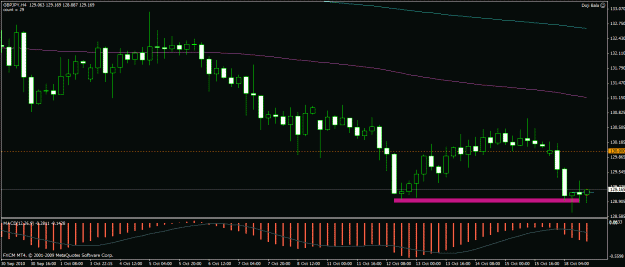
- roundrock replied Oct 9, 2010
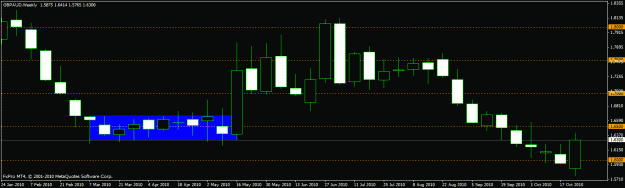
EURGBP DBHLC on D1 — TP1 and TP2 are marked as blue rectangle, stoploss is high of the bar. i like the free space. also rejected off fib 0.61 level (marked as yellow dashed line).
james16 Chart Thread
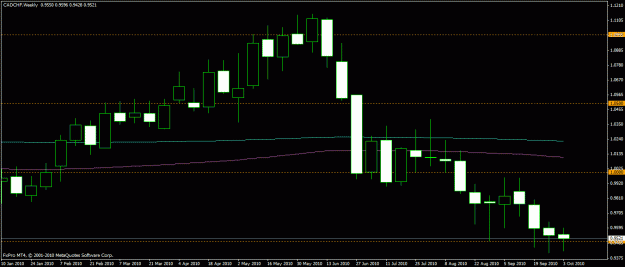
- roundrock replied Oct 9, 2010
CADCHF I4 Weekly straddling BRN — on downside we find immediate PPZ. looking for upside breakout
james16 Chart Thread
- roundrock replied Oct 8, 2010
nice trade. perfect motion as expected. closed it due to weekend. low risk high return trade
james16 Chart Thread
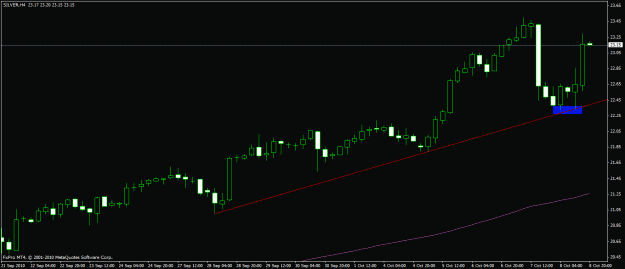
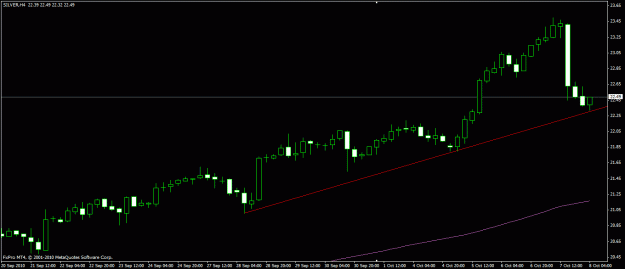
- roundrock replied Oct 7, 2010
Silver H4 TL Bounce — bounce off TL. in line with the uptrend. buy on retracement..
james16 Chart Thread
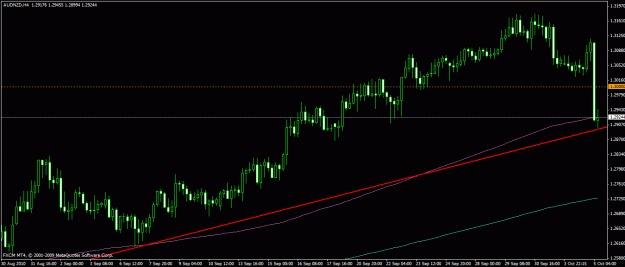
- roundrock replied Oct 5, 2010
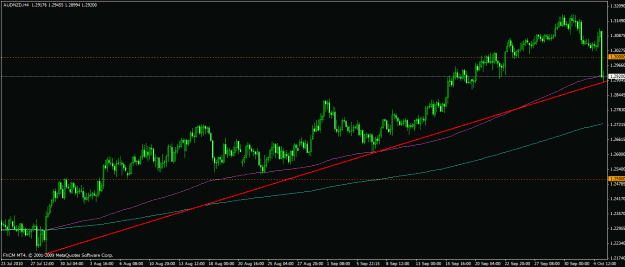
AUDNZD H4 Big Bearish bar — bounce off TL and EMA 150 on H4 chart. since we have a wide wide bearsih bar, we will wait for any bullish PA pros : in line with trend, bounce off TL, bounce off EMA. small pin as well cons : big bearsih bar. ...
james16 Chart Thread
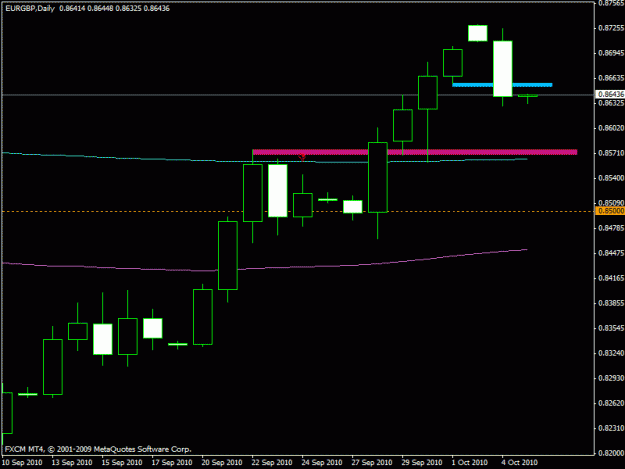
- roundrock replied Oct 4, 2010
EURGBP BEOB @ swing high — location is nice. bar shape is nice. close is nice. not much traffic ahead. what i am looking at is a break of the low and then a retarcement to prev day low (marked as blue rectangle) to enter. FTA is red rectangle.
james16 Chart Thread