- Search Forex Factory
- 36 Results
-
 steve10% replied Jul 10, 2015
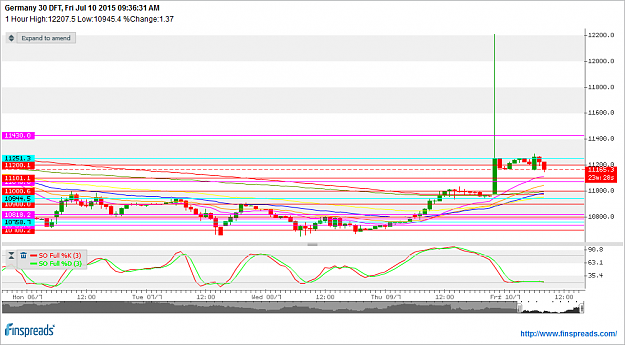
Just wondering what you guys get todays pivot points at ? I have R1 11431 PP 11070 S1 10816 Reason I ask is because there was a spike on my chart around 11:15 pm last night so I disregarded that high image
Carpe diem: Intraday tactics for Dax and Dow
- steve10% replied Aug 23, 2009
If it goes below 2.6 then it should test the 2.00 level from 2001/2002 with 1.6 as the long term low from 98 At the moment the supply is well above the long term average. It will surely need to drop toward the lower average level or there be ...
natural gas - 10 consecutive red candles in a row
- steve10% replied Jan 29, 2009
The yellow line was previously resistance area.If the price bounces off here you could say it is resistance that has changed to support. The blue line is support area. Will the price bounce off the yellow line? I could not say. You could look at ...
EURGBP
- steve10% replied Nov 12, 2008
They would be better off paying people to be sterelised..and this is a good example of why! Google Karen Matthews Then be thankful she isn't your mother
Cesarnc's market talk, gossips, rumours & fun

- steve10% replied Oct 17, 2008
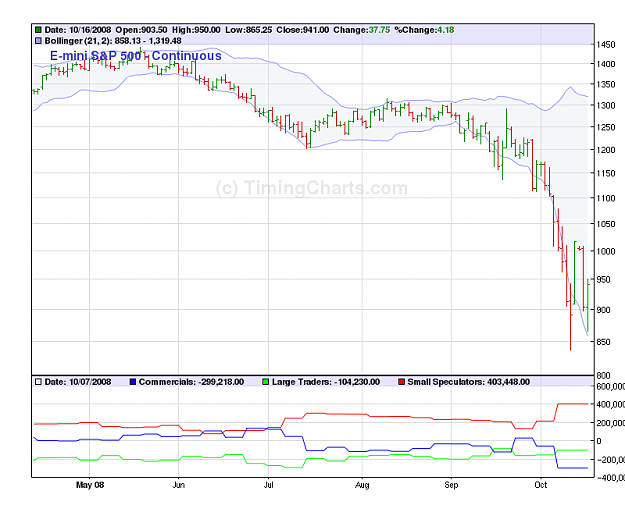
Some people say follow the commercials positions,some say follow the large traders. Nobody says follow the small speculators and this is a good example why
Commitments of Traders Weekly Report
- steve10% replied Oct 17, 2008
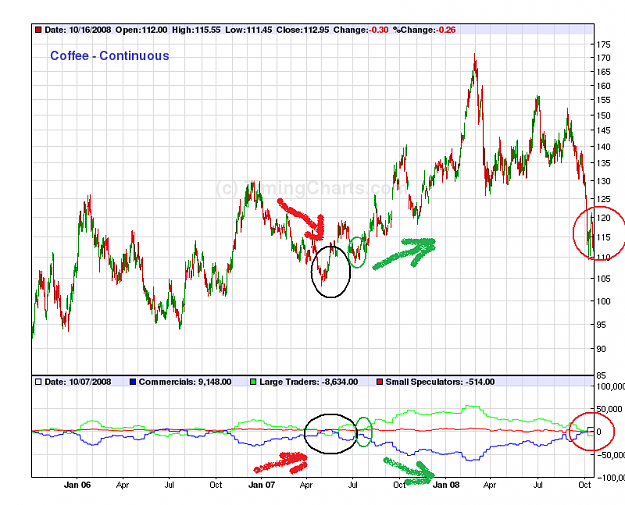
This is a trade I did last year.Its a commodity-some say COT works better with commodities. I saw the positioning come together (black circle).Then entered after a trend line bounce (green). I am now watching the price as there is potentially a ...
Commitments of Traders Weekly Report
- steve10% replied Oct 17, 2008
Personally I go to www.timingcharts.com and review the graphs there. Ilook for the commercials and large traders positions to come together.
Commitments of Traders Weekly Report
- steve10% replied Sep 22, 2008
Looks like someone went short oil last week and got squeezed till their pips squeaked
I see oil reaching 100 USD?! url
url
- steve10% replied Mar 13, 2008
Pretend you got a buy signal for Boeing at A at around $100 and you decide to have a 10% SL of $10 just below B Then if it drops 10% the stock only has to rise 11% to BE What would be the point holding after it drops below C? (Ok its obvious looking ...
no stop loss for stock trades
- steve10% replied Mar 7, 2008
Sorry its late I have been out only just seen your PM EDIT Just read your second PM will post after NFP Steve
Chf/Jpy

- steve10% replied Feb 15, 2008
This is Alpari its fairly near but there does seem to be occasional differences
Are we trading different markets?
- steve10% replied Dec 10, 2007
image Down to 1hr and possible support/resistance areas
The right Trendline and S/R line
- steve10% replied Dec 10, 2007
image The long term trend seems to have stayed intact
The right Trendline and S/R line
- steve10% replied Dec 8, 2007
image Hi grasshoppa When I posted my reply I had just posted a similar chart to this chart of GBP/USD on another thread and I was thinking of this chart when replying to this thread. In post no2 on here I was referring to the price dropping to the ...
Interest Rate Question
- steve10% replied Dec 7, 2007
Dropping down a timeframe and we are still finding support
The right Trendline and S/R line