- Search Forex Factory
- 26 Results
-
 sunilpawar replied Aug 2, 2019
Witnessing lot of PA and volatility. Some one is buying heavily....... It goes up with high speed and fall with low speed. Appears that it will hit ata's target of 1280...(Mine is 1240) SL is @ 1000. First level of resistance @ 1140 for resuming ...
EURUSD only
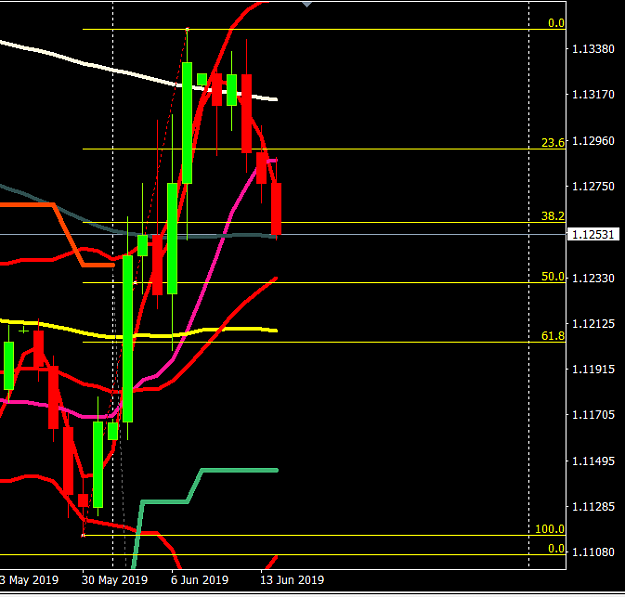
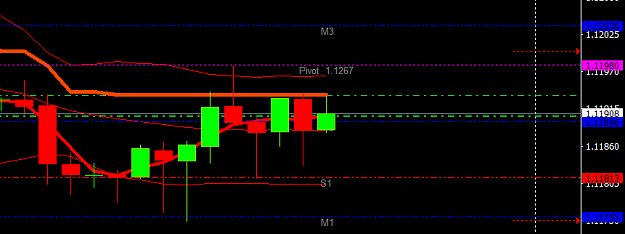
- sunilpawar replied Jun 6, 2019
I see a possible visit of 1185-1195 today as per down direction and daily ATR before a pull back.
EURUSD only
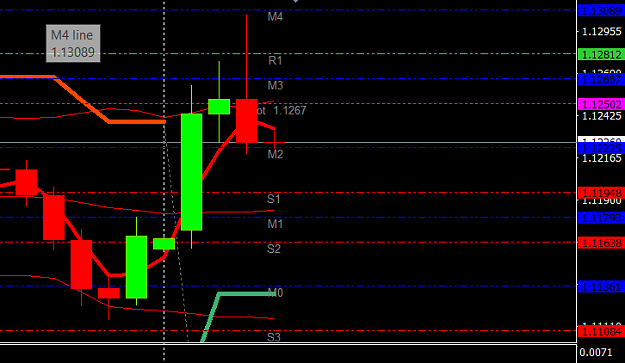
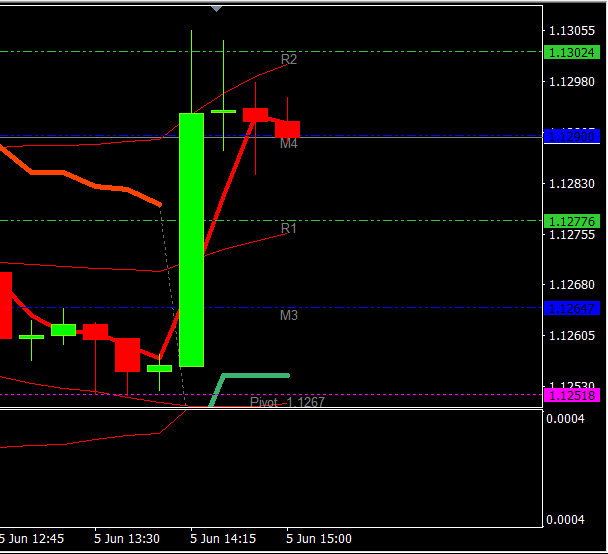
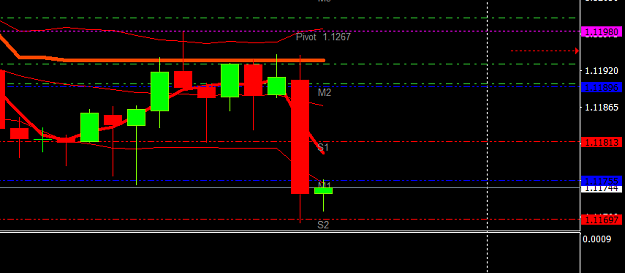
- sunilpawar replied Jun 5, 2019
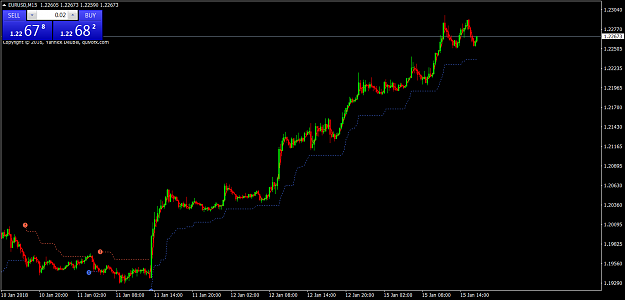
This is my 15 mins chart Close of Candle below 1283 will be reverse for me for back to 1155 levels. I will look for next 2 hours pattern. For sure I ll not enter as I have made my pips.
EURUSD only
- sunilpawar replied Jun 3, 2019
We will have to wait for daily closing over this level....@1205 I can see a level of 1213 to be touched Daily Range crossed over here 44 pips So My charts say Uptrend will be if 1205-1190(Daily closing over 1205-1213 levels) support hold for target ...
EURUSD only
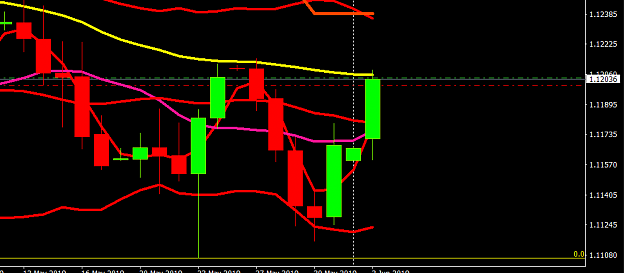
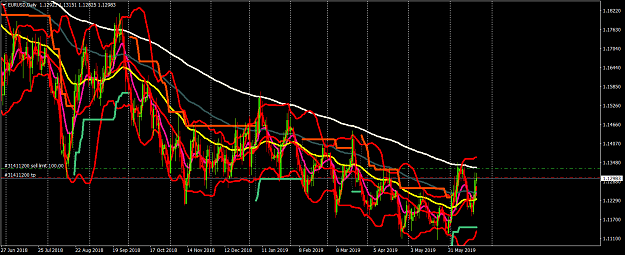
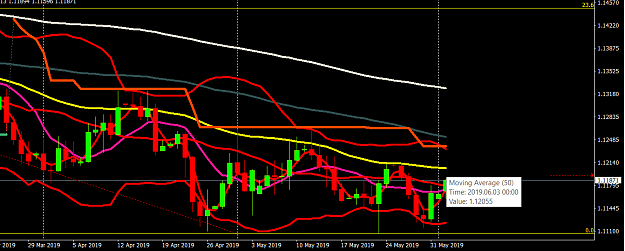
- sunilpawar replied Jun 3, 2019
As I can see on my chart... The yellow line @1205 on daily chart is 50 SMA. Daily close above this would lead for test of Higher SMA
EURUSD only
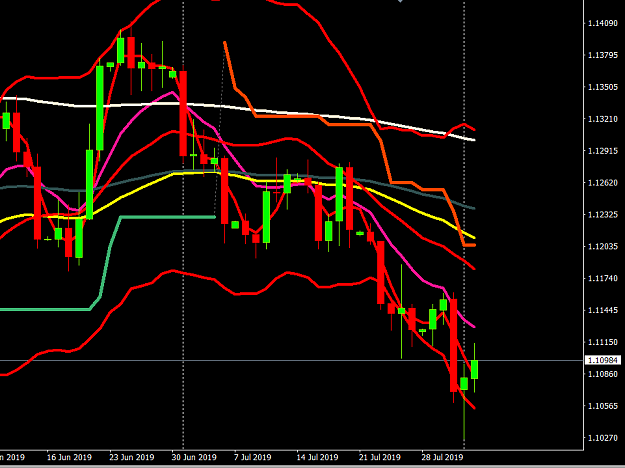
- sunilpawar replied May 29, 2019
To my previous post: Today Only I believe we are into retest of 1132 and low might be 1090 to complete the pattern... However Daily closing above 1150 would be kind of strong support apart from spikes ATR daily suggests todays range 1172-1132. for ...
EURUSD only
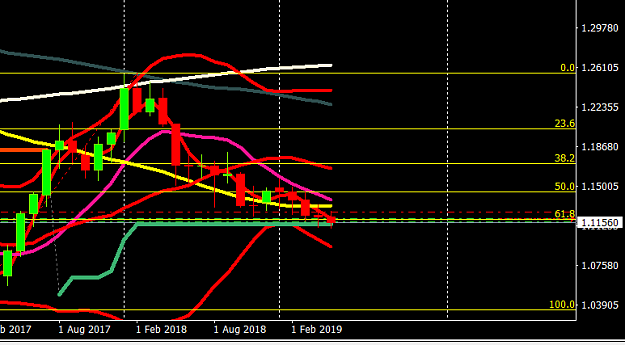
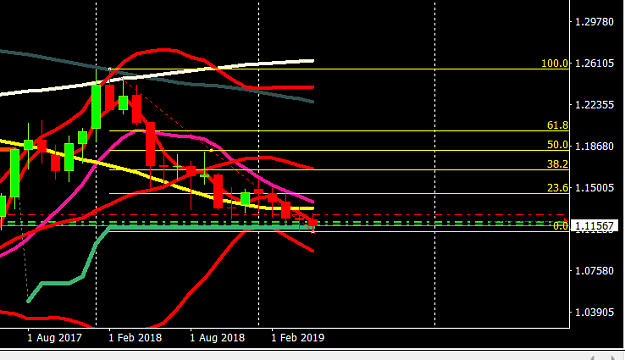
- sunilpawar replied Jan 26, 2018
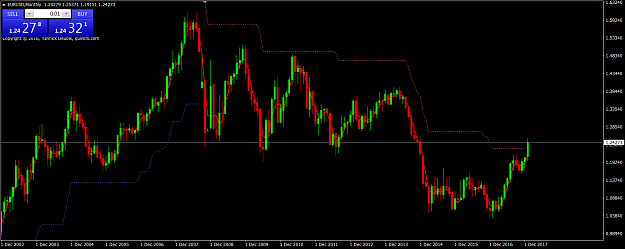
An observation on Monthly chart since last 10 years image
EURUSD only