- Search Forex Factory
- 51 Results
-
 taypot replied Jan 7, 2014
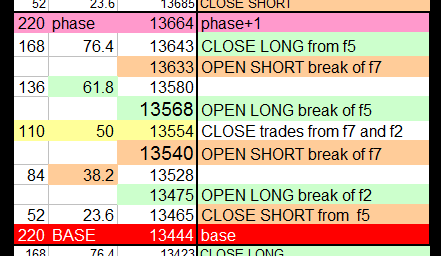
I have set up a T4Y_680 template for Eurusd with the new baselines. Just out of interest I extended the phase lines into last year so I could draw some yellow rockets on the charts in order to visualise trade set ups for myself according to the ...
Are support and resistance levels predetermined?
- taypot replied Oct 14, 2013
Thanks for this info, its helped me find the missing template that Aebab must have been using. i queried it a few posts back. Its the t4y_220. I've found some rules and popped it into my spreadsheet...
Are support and resistance levels predetermined?
- taypot replied Oct 10, 2013
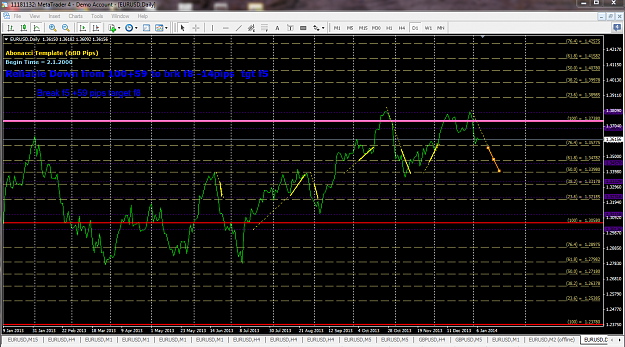
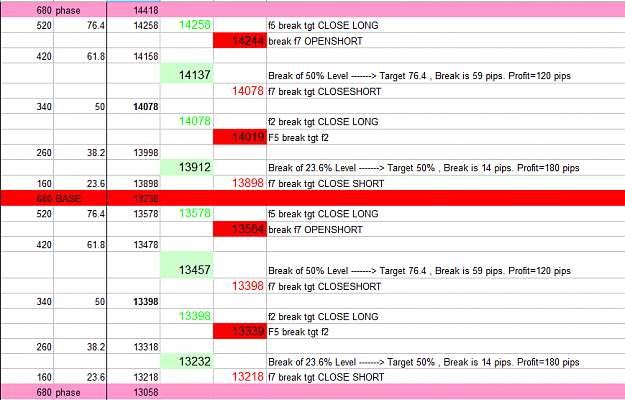
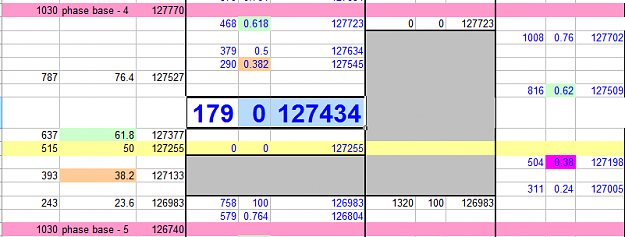
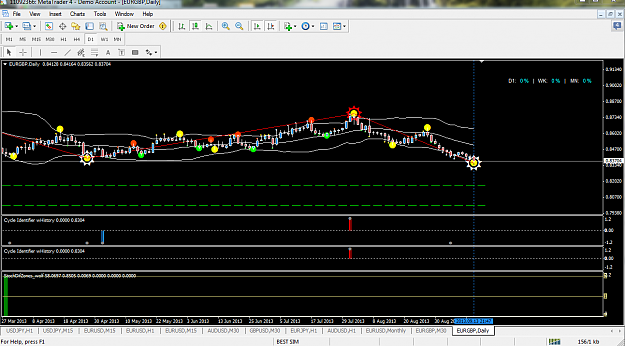
There are two 'rules' that coincide with EURUSD target of 1.3658/1.3660 on two of the more accurate templates. See my screenshot of a phase of each template showing trades in bold. So this should go up to meet this target as T4_680 'never fails'! ...
Are support and resistance levels predetermined?

- taypot replied Oct 9, 2013
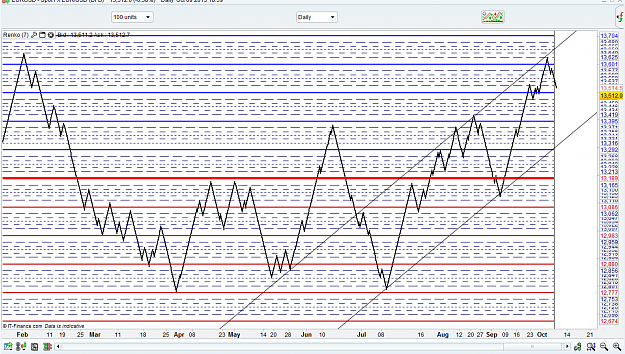
Can we now assume the EURUSD has become bearish as this rule applies:- price travels from above 76.4% level and breaks 50% , so the trend will become bearish and should and must reach 23.6% If so and we continue down then I think if price closes ...
Are support and resistance levels predetermined?
- taypot replied Oct 9, 2013
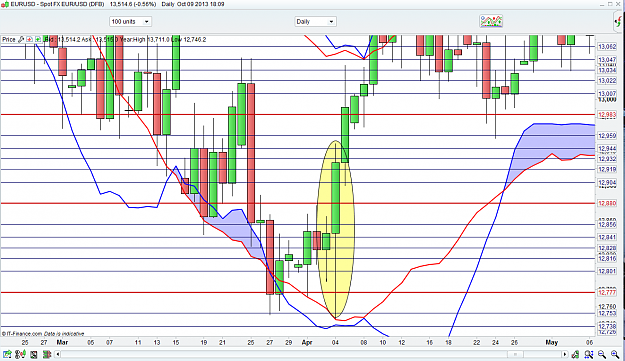
Its the length of the daily candle (yellow ellipse) that proves there is a reversal according to one of the rules when price travels from below 23.6% level and breaks 50% , so the trend will become bullish and should and must reach 76.4%
Are support and resistance levels predetermined?
- taypot replied Oct 9, 2013
The only relevance I can find on the 103 template to this figure is in the fib lines at the 23.6 fib level as shown in my excel file here. I constructed this excel file out of interest while trying to understand the "white" fib lines mentioned in ...
Are support and resistance levels predetermined?
- taypot replied Sep 14, 2013
Heres a great addition for us. See higher zones on smaller timeframes on MT4. You need alphonso's rectangle reader indi. Brilliant! You draw a rectangle on higher time zone and lines appear on smaller ones. ie. month, week, day, 4hr, but no lower ...
The similarity system
- taypot replied Sep 14, 2013
Hi OConnor...This post explains more about what i was trying to do url Its moved away from the method a bit as its not time frames but I couldn't work out how to do it any other way and I'm not really sure how logical it is. (I'm an artist!). The ...
The similarity system
- taypot replied Sep 14, 2013
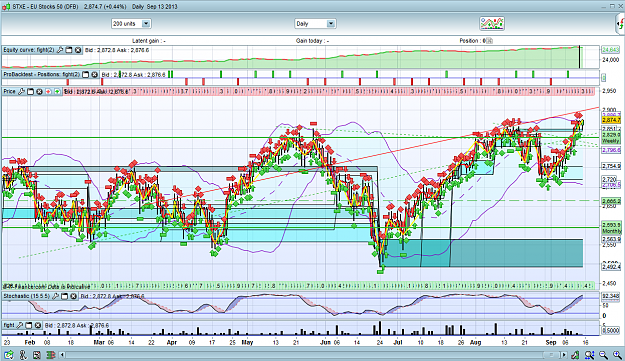
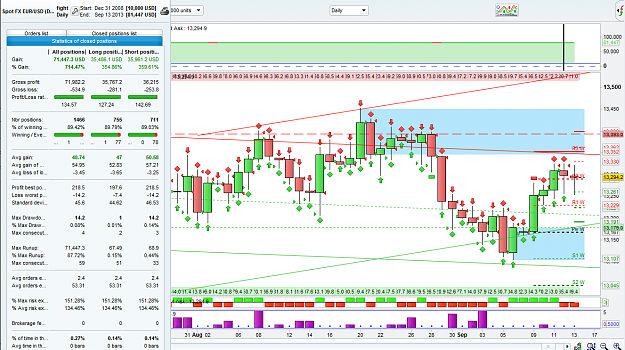
Hi Trexy, I have written an indicator that does something like that for Prorealtime ( a few zones on each chart that appear whenever there is dissim to 1MA on any of the stoch values have set it to monitor for that time frame and they stop once new ...
The similarity system
- taypot replied Sep 13, 2013
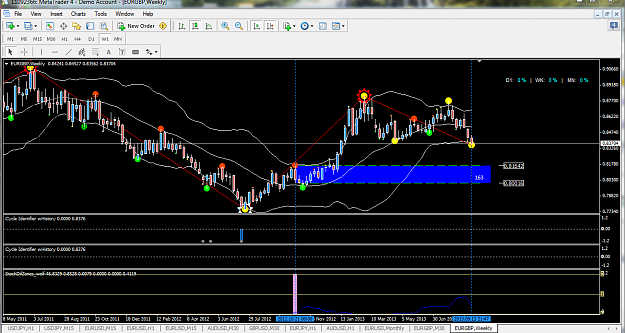
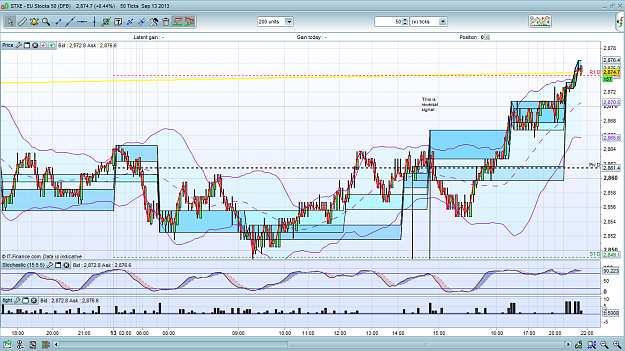
Hi OConnor, Yes i am still intrigued by dissimilarity but are on a different path combining it with another trading method. My fight indicator is based on dissim between 1ma and several stoch values. Its purple on my image. If its 5 or above I know ...
The similarity system
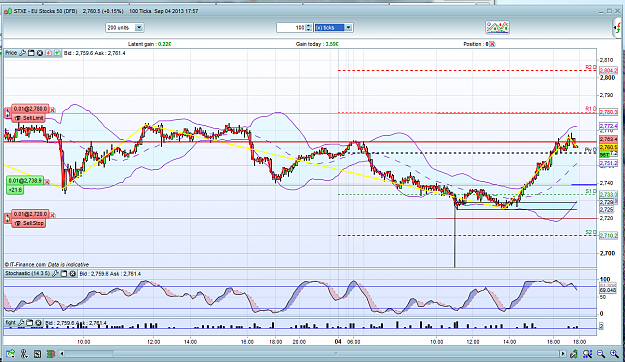
- taypot replied Sep 4, 2013
Hi Guys, this thread has gone quiet which is a shame, but I have now moved house and ready to check this out more. I have been doing things a little differently and have built indicators for Prorealtime that record a slight difference between the ...
Similarity: A Practical Approach
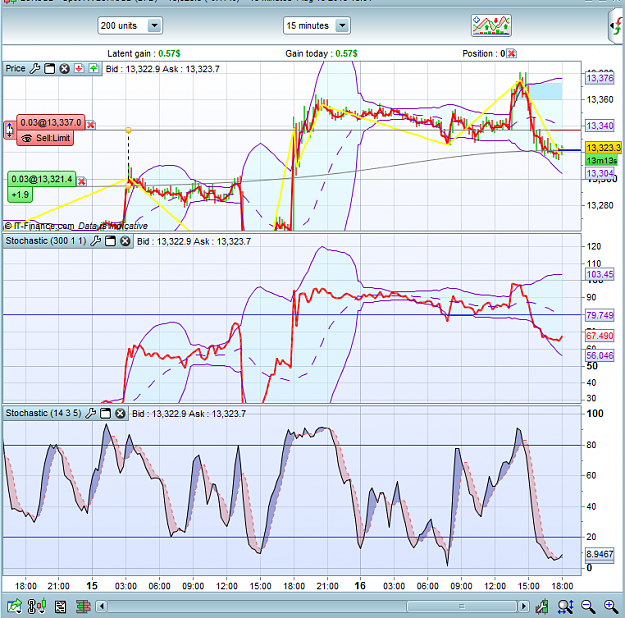
- taypot replied Aug 16, 2013
Looks like I'm talking to myself and trading alone! But its good...PIPS. Have closed a bit more but will leave the rest to run now as will provide a 'sort of' slight hedge for a tiny usdjpy long i have open. Here's my layout, I'm off now. Bye and ...
The similarity system
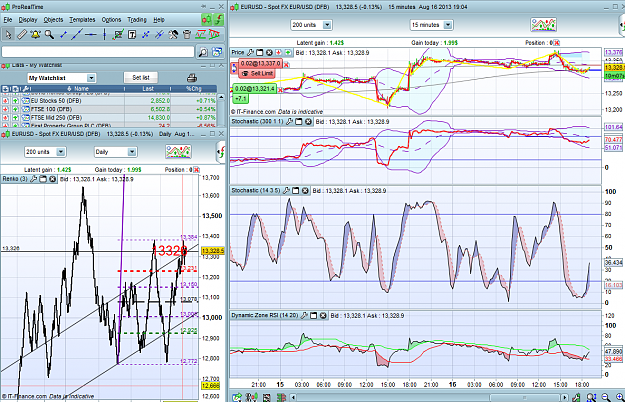
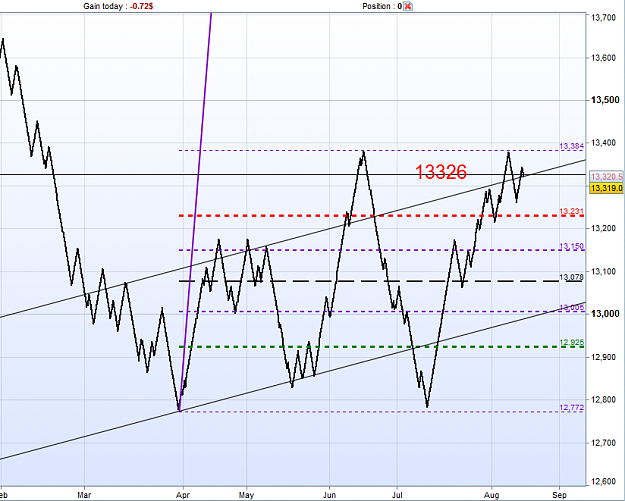
- taypot replied Aug 16, 2013
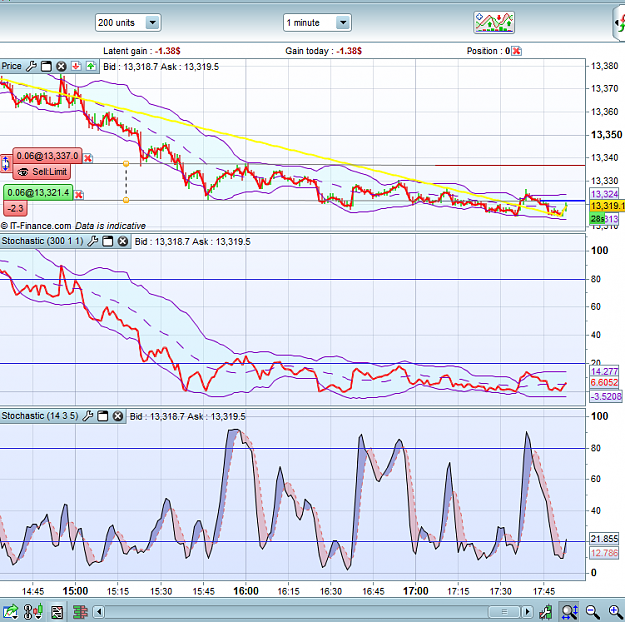
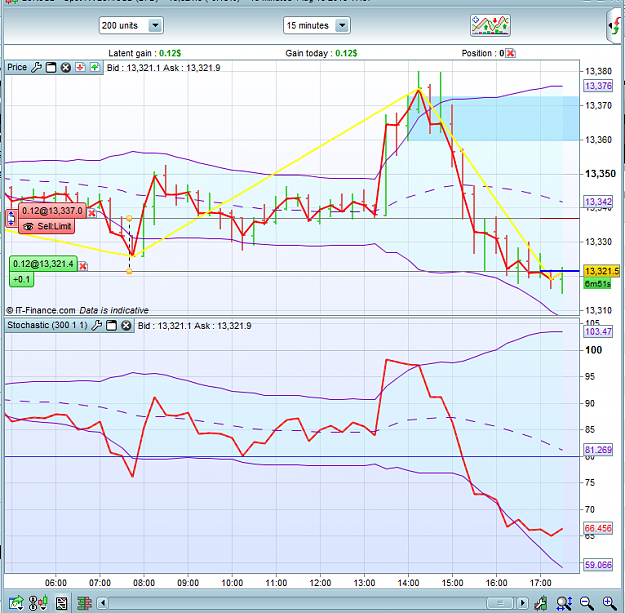
Still in, back in profit and watching. Stoch is about to cross 20 which will be bullish...I like using renko charts as they tend to continue in same direction most of the time. You can see the importance of 13326 as it is above my trend line and ...
The similarity system
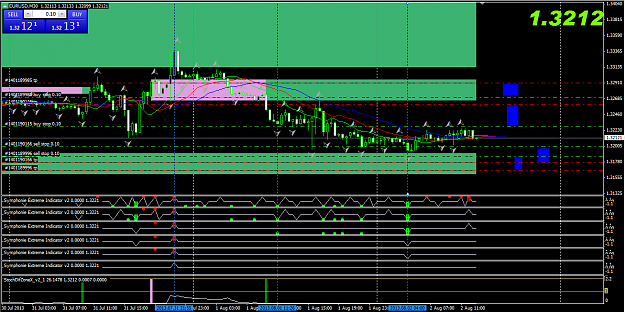
- taypot replied Aug 2, 2013
Ranging market at the moment and NFP later so not trading but have left 4 orders based on zones only (see blue rectangles). Whipsaw will happen of course but there seems to be a increased buying of USDJPY prior to today (I keep a little .01 USDJPY ...
Similarity: A Practical Approach
- taypot replied Jul 31, 2013
Wow thanks Me3w.. i have homework to do. So much interesting stuff today and my demo trades were mostly winners too! I will take a look at CFG MO but in the meanwhile here's an interesting (pretty) view of Joe's indicators with some DS blocked in in ...
Similarity: A Practical Approach
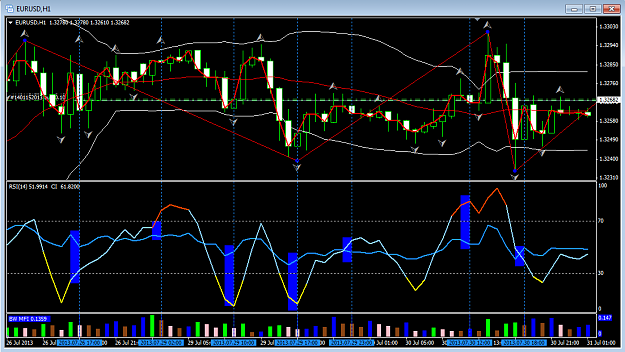
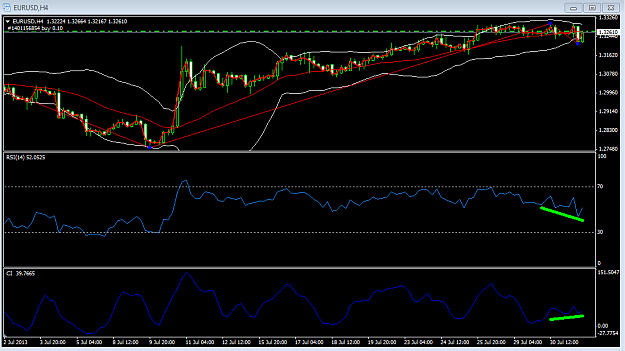
- taypot replied Jul 31, 2013
Here I have put them both on the same 1 hr chart. Maybe I can compare them easier like this
Similarity: A Practical Approach
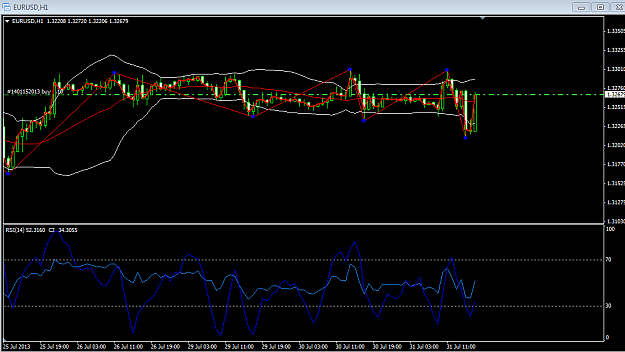
- taypot replied Jul 31, 2013
Hi Joe, Would you mind giving me your view on this 4hr difference which I have spotted. I am trying to understand what is happening with these two indicators as there is at first glance strong divergence but I think its just the scale or time of ...
Similarity: A Practical Approach