- Search Forex Factory
- 26 Results
-
 trademark replied Jan 14, 2019
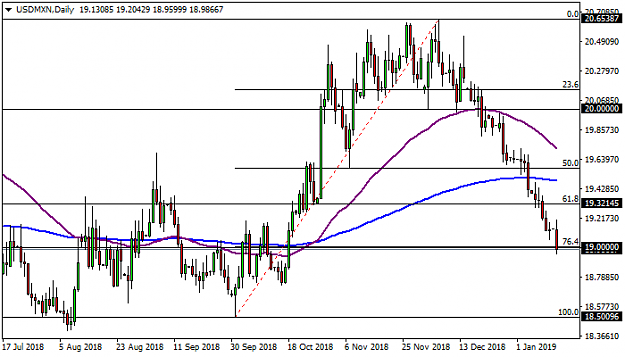
The USDMXN is at the 76.4% Fibo on the daily chart at the 19.00 level after retracing to the downside from the peak at the 20.65 zone in November. The 19.00 level may act as support, but if the pair continues falling, then the low at the 18.50 level ...
USD/MXN -- US Dollar / Mexican Peso
- trademark replied Jan 8, 2019
Breakout-pullback pattern on silver. The breakout-pullback pattern is formed when the price of an asset breaks a support or resistance level to then pull back to the same level and continue in direction of the initial breakout. The breakout-pullback ...
XAU/USD & XAG/USD - Gold & Silver Traders Thread
- trademark replied Dec 13, 2018
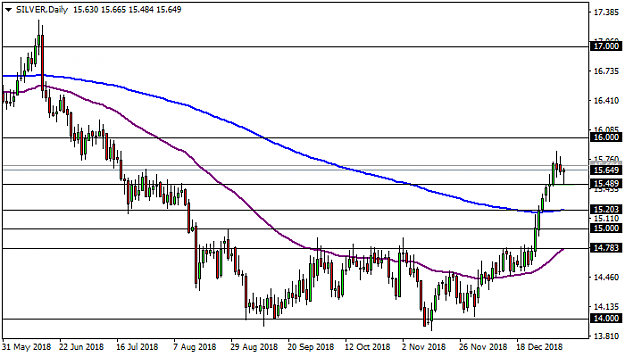
Silver is heading higher. The price of silver has been consolidating between the 14.00 level and the 15.00 level during the past 5 months as shown on the daily chart. The current consolidation ends with the bearish trend on this timeframe. The ...
XAU/USD & XAG/USD - Gold & Silver Traders Thread
- trademark replied Nov 7, 2018
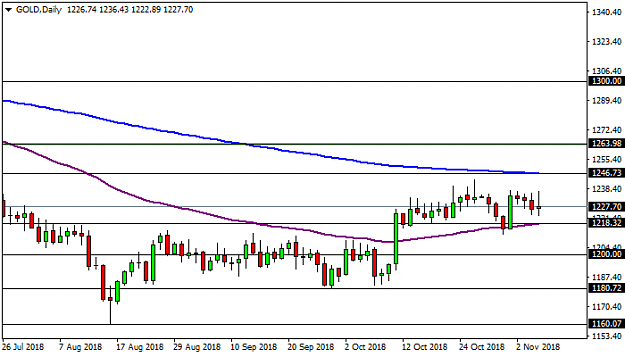
Gold narrows its range. After breaking above the 55 day EMA at the 1218 level, gold consolidates and starts a sideways movement for approximately one month, until it narrowed its range little by little. The price of gold consolidates just between ...
XAU/USD & XAG/USD - Gold & Silver Traders Thread
- trademark replied Oct 17, 2018
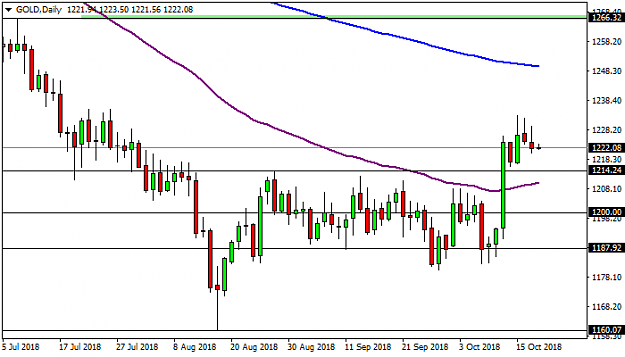
Gold consolidates around the 1222 level and forms what it appears to be a flag or pennant pattern. From the current level, the price of gold may head in any direction even though it is trying to keep its bullish momentum. To the upside, the 200 day ...
XAU/USD & XAG/USD - Gold & Silver Traders Thread
- trademark replied Oct 10, 2018
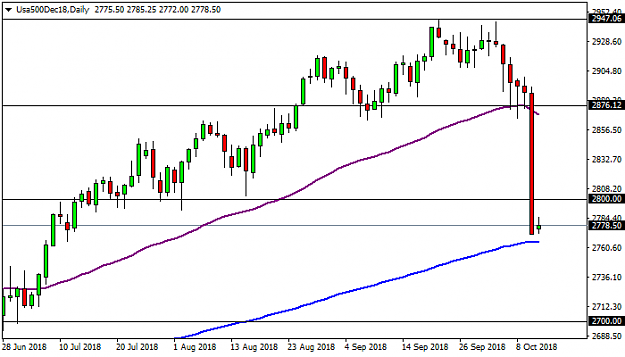
A bloodbath on the S&P 500. The S&P 500 plummets during today’s session with the US bond yields on the rise while risk aversion hits the markets. On the daily chart of the S&P 500 we can see that index drops below the 55 day EMA (purple line) at the ...
S&P500 trading
- trademark replied Oct 6, 2018
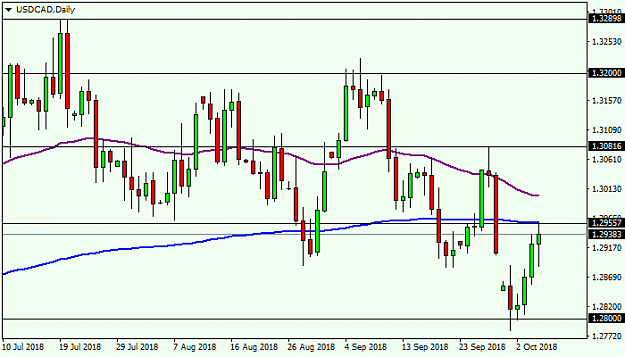
The USDCAD rallies exactly to the 200 day EMA at the 1.2955 level as shown on the daily chart. The moving average may act as a resistance, to the downside the 1.2800 level may act as support. Above the 200 day EMA, the 55 day EMA (purple line) may ...
USD/CAD
- trademark replied Sep 27, 2018
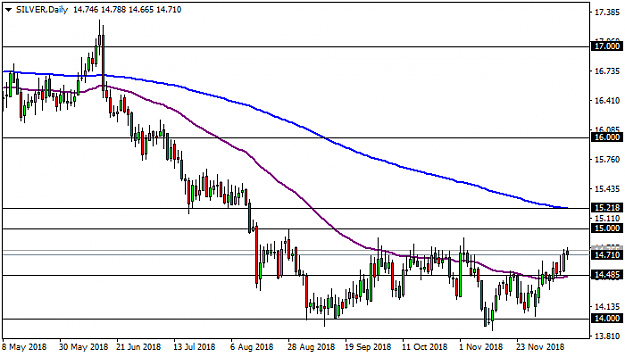
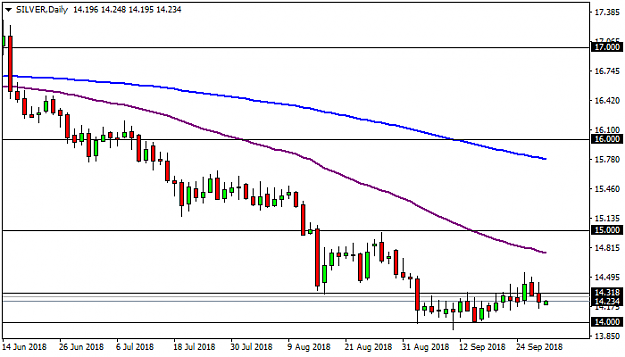
The price of silver is still consolidated around the 14.31 level, with a good support at the 14.00 level. Despite the current consolidation, the bearish trend is still in place on silver, at least on the daily chart. From the current congestion area ...
XAU/USD & XAG/USD - Gold & Silver Traders Thread
- trademark replied Sep 19, 2018
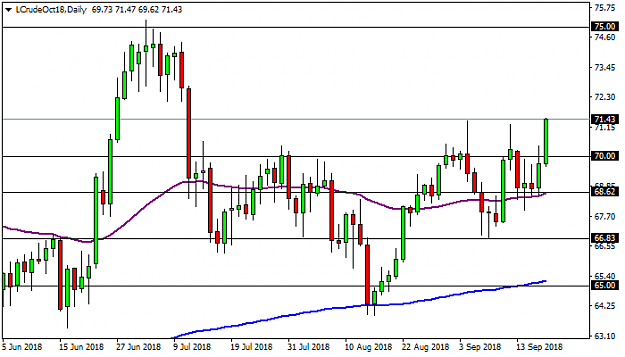
Good rally on oil. WTI oil rallies on the back of lower than expected US crude oil inventories. The sanctions on Iran and a rise in demand has also contributed to the rally on WTI oil. After the breakout of the 70.00 level, the commodity rises to ...
WTI Crude Oil Trading
- trademark replied Sep 17, 2018
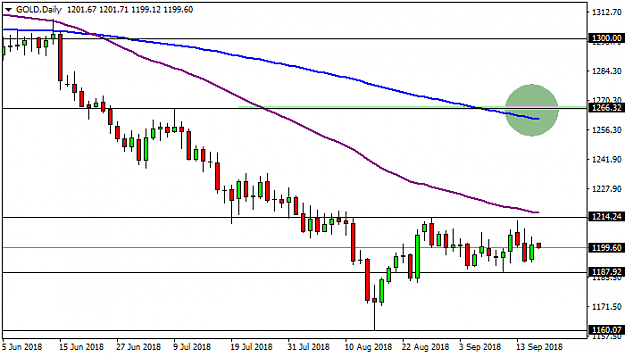
Consolidation on gold continues. The precious metal keeps consolidating between the 1187 level as support and the 1214 level as resistance. Gold has been consolidating for the last twenty sessions in the same area as shown on the daily chart. Just ...
XAU/USD & XAG/USD - Gold & Silver Traders Thread
- trademark replied Sep 11, 2018
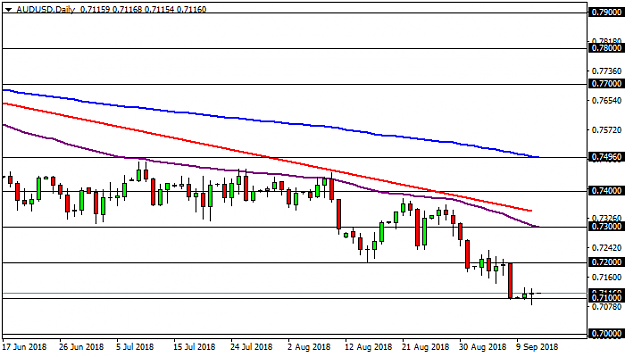
The AUDUSD completes three trading sessions in a row stuck around the 0.7100 level as support. The AUDUSD keeps a bearish trend, which is confirmed by the 55 day EMA that is pointing to the downside. The 200 day EMA is also pointing to the downside, ...
AUD/USD
- trademark replied Sep 5, 2018
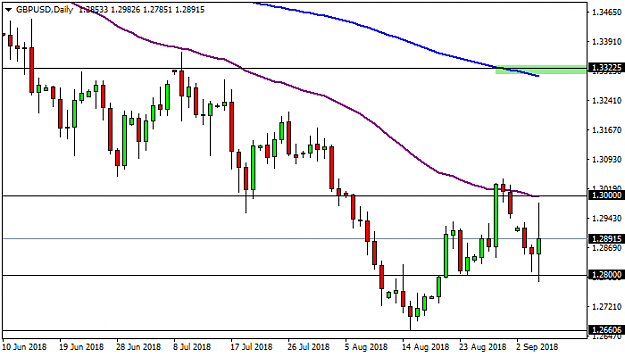
The GBP/USD is in a downtrend with the 55 day EMA acting as a good resistance level. The pair pulled back to the upside from the low at the 1.2660 to the 55 day EMA and the 1.3000 level. Since last week, the price of the GBP/USD has been pulling ...
Cable Update (GBPUSD)
- trademark replied Sep 4, 2018
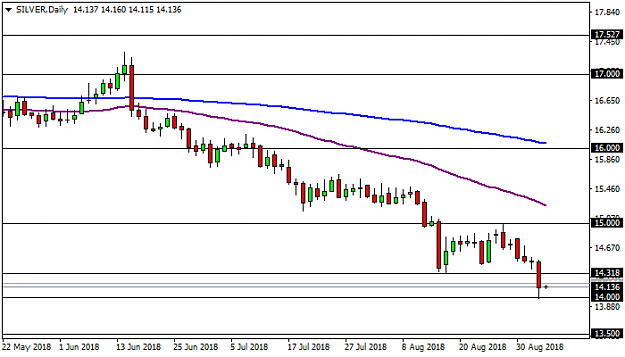
Silver has broken below the 14.31 level and reaches the 14.00 level, which could act as support as shown on the daily chart. The rally on the Dollar and the trade war between the US and China has pressured the commodities sector and the precious and ...
XAU/USD & XAG/USD - Gold & Silver Traders Thread
- trademark replied Aug 29, 2018
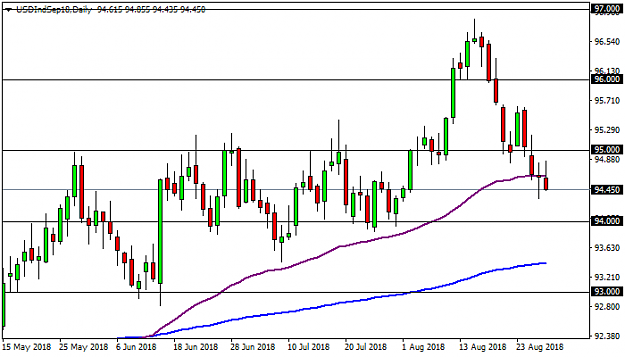
The Dollar index breaks below the 55 day EMA and it may continue falling to the 94.00 level. Below the 94.00 level, its next support could be the 93.00 level. On the other hand, the Dollar index may consolidate around the 94.00 level, which has been ...
Exotics (USD/TRY, USD/ZAR, USD/MXN, and others)
- trademark replied Aug 24, 2018
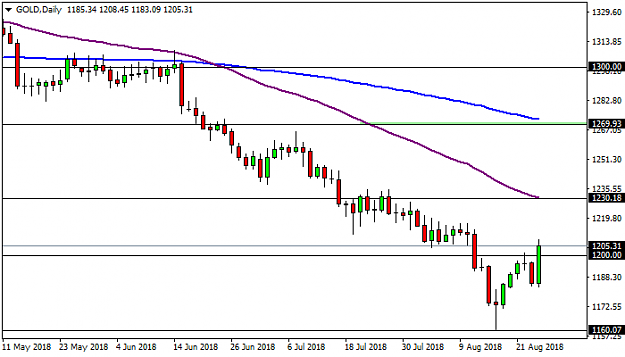
Gold tried to complete a breakout-pullback pattern on the daily chart, around the 1200 level, but it couldn’t continue falling after yesterday’s session. Today the price of gold breaks above the 1200 level and accelerates its bullish momentum. The ...
XAU/USD & XAG/USD - Gold & Silver Traders Thread
- trademark replied Nov 20, 2017
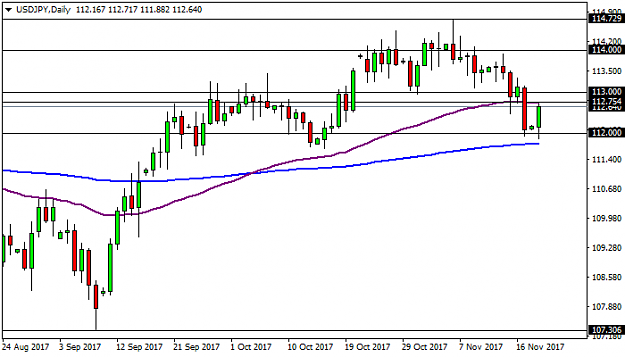
Great bounce on the USDJPY from the 112.00 level to the 55 day EMA at the 112.75 level. The moving average may act as resistance and the pair may try to go back to the 112.00 level or the 200 day EMA. A breakout above the 113.00 level may take the ...
USD/JPY Discussion
- trademark replied May 1, 2017
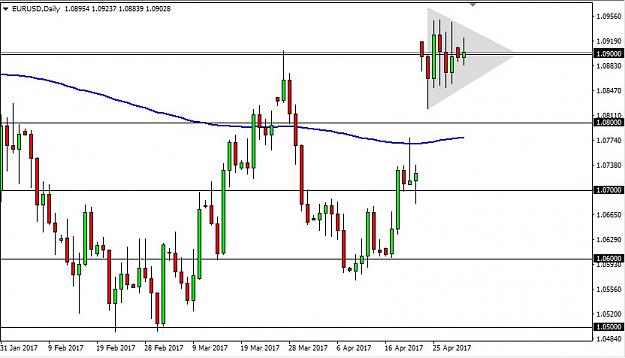
The EURUSD is consolidating around the 1.0900 zone and it has formed what it appears to be a symmetrical triangle on the daily chart from where the price may head in any direction. If the pair breaks to the upside, then the 1.1000 level may act as ...
EURUSD
- trademark replied Mar 31, 2017
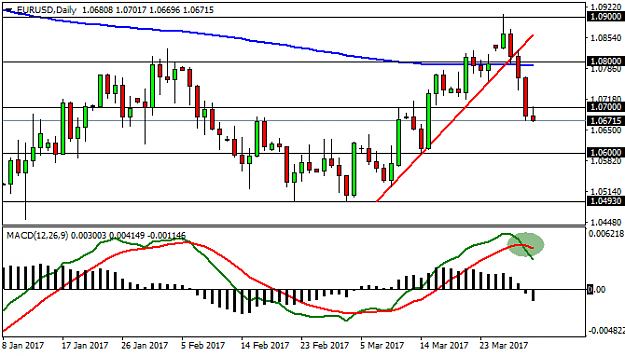
Seems like the EURUSD has changed direction to the downside, according to the MACD indicator on the daily chart. The pair may try to visit the 1.0600 level. image
EURUSD
- trademark replied Jun 13, 2016
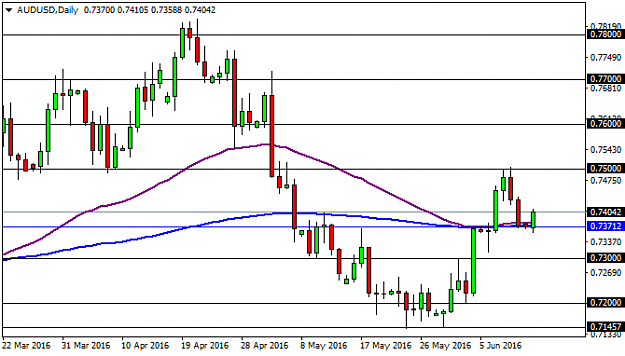
Good bullish bounce on the AUD/USD from the 200 day EMA, a breakout and pullback pattern may be completing, possible bullish continuation. image
AUD/USD
- trademark replied May 4, 2016
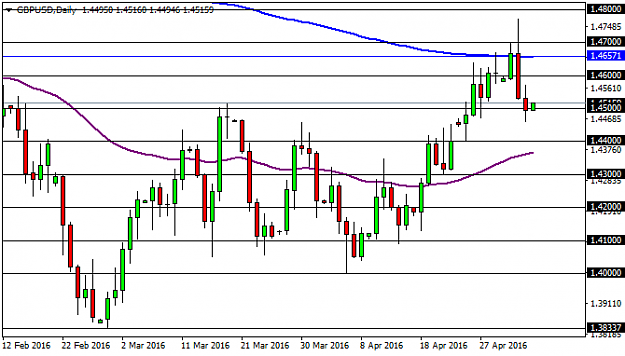
I also have a good support on the GBP/USD daily chart, around the 1.4500 level.
Cable Update (GBPUSD)